

I. Introduction
Few subjects in modern economics have received more attention, both from professional economists and from policymakers, than the issue of economic growth as it relates to “equity.” Is a more prosperous society a more just or even happier society? Does the pursuit of increased output come at the cost of a loss of welfare because of adverse distributional effects of output expansion? How does one even measure inequality? Should it be measured in terms of income distribution in a given year, wealth distribution at a given point in time, the present value of lifetime income distributions, or the distribution of consumption expenditures (either currently or over a lifetime)? Should one use pre- or post-tax measures of income or wealth? And so on. The questions are endless, and the answers are inconclusive, at least in the minds of some.
This essay touches on some of these eternal questions in the context of tax policy, although it does not even attempt to offer more than partial answers to them. The basic arguments advanced in this essay are threefold. First, high taxes very often have adverse effects on the growth in incomes. If higher incomes are desirable, ceteris paribus, then low taxes are most often preferred to higher ones, unless one makes what I would regard as probably implausible assumptions about positive external welfare effects of tax-financed governmental expenditures, or the income distributional effects of higher incomes. Second, some crude but useful indicators of economic welfare suggest that the inverse correlation between tax burdens and economic welfare (or happiness) exists. Low-tax areas have, on average, a better quality of life. Third, even if one takes the view that economic growth resulting from tax reductions leads to some forms of potentially welfare-reducing income inequality as conventionally measured, a broader perspective on equality measurement likely would lead one to a different conclusion, namely that the growth-equity trade-off is more illusionary than real.
II. Taxes and Economic Growth
Taxes impact human behavior. Should I take an overtime job paying $15 per hour? If I am taxed 80 percent of the additional income, my after-tax compensation of $3 an hour may well be too low to make it worthwhile for me to sacrifice leisure time for working. I am happier watching football games on television. In contrast, if the marginal tax rate is 20 percent, and I can keep $12 per hour, I am more likely to prefer working—the opportunity cost of watching football is perhaps too high. Likewise, businesses facing taxes on capital investments might make similar decisions—if marginal tax rates on profits are high, the expected after-tax return may be too low to justify the risk of making the investment, thus increasing the probability that an alternative use of the funds would be more desirable. Thus, taxes can have an adverse impact on the magnitude of labor and capital resources used in making goods. Moreover, such taxes can lower investment and capital formation over the long run, having further long-run consequences on output and income. For example, if income from savings is highly taxed, the reduced supply of savings may lead to higher interest rates, leading to lower investment. Conceivably, technological progress could be impeded as well, as investments in innovation and research and development become excessively risky relative to the after-tax expected rate of return.
However, there are other theoretical reasons to believe that new or increased taxes could conceivably have positive effects on output. Individuals facing higher taxes may feel the need to work more hours to match previous levels of disposable income—the “income effect” of taxes induces more work. Also, tax revenues are spent, and if spent in a way that enhances output, it is possible that the resource-reducing disincentive effects of taxes may be offset by positive effects of government spending and the income effect. Therefore, it is not obvious a priori if taxes will have positive, negative, or neutral effects on the growth in income and wealth.
What does the empirical evidence show? Obviously, such factors as the type of taxes imposed, the uses of funds, and the time horizon studied (short-run versus long-run effects) will have an impact on the tax-growth relationship. Moreover, on a variety of grounds one might expect that the impact of new taxes will depend in part on the magnitude of taxes and the overall size of government. A society with a small government and modest taxes might benefit from higher taxes to fund needed expenditures, such as protection of property rights by improving the effectiveness of the police and justice system. A society with a large government (and already relatively high tax burdens) might find that the gains in economic growth from added taxes are far more than offset by the adverse disincentive effects of the new taxes. With these caveats in mind, a large majority of the studies seen by this author show that new taxes have adverse effects on economic indicators such as income, output, employment, migration, business investment, and plant location.
The overwhelming evidence that taxes impact behavior, often adversely, is demonstrated by a little research done for this essay. I downloaded five working papers dealing with taxes issued in the past year from the website of America's most prestigious economic research organization, the National Bureau of Economic Research. Below are excerpts from the summaries of each study, in reverse chronological order:
This evidence is consistent with the notion that wealthy elderly people change their real (or reported) state of residence to avoid high state taxes… .1
Jon Bakija and Joel Slemrod, “Do the Rich Flee from High Taxes? Evidence from Federal Estate Tax Returns,” Cambridge, MA: National Bureau of Economic Research (hereafter NBER) Working Paper w10645, July 2004.
The individual income tax burden on dividends was lowered sharply in 2003 from a maximum rate of 35% to 15%…. The surge in regular dividend payments after the 2003 reform is unprecedented in recent years.2
Raj Chetty and Emmanuel Saez, “Do Dividend Payments Respond to Taxes? Preliminary Evidence from the 2003 Dividend Tax Cut,” Cambridge, MA: NBER Working Paper w10572, June 2004.
Regressions on rich-country samples in the mid 1990s indicate that a unit standard deviation tax rate difference of 12.8 percentage points leads to 122 fewer market work hours per adult per year, a drop of 4.9 percentage points in the employment-population ratio, and a rise in the shadow economy equal to 3.8 percent of GDP.3
Steven J. Davis and Magnus Henrekson, “Tax Effects on Work Activity, Industry Mix, and Shadow Economy Size: Evidence from Rich-Country Comparisons,” Cambridge, MA: NBER Working Paper w10509, May 2004.
This paper presents new evidence on how corporate payout policy responds to the differential between the tax burden on dividend income and that on accruing capital gains…. Time series estimates … imply that the recent tax reform could ultimately increase dividends by almost twenty percent.4
James Poterba, “Taxation and Corporate Payout Policy,” Cambridge, MA: NBER Working Paper w10321, February 2004.
Americans now work 50 percent more than do Germans, French, and Italians. This was not the case in the early 1970s…. I examine the effect of the marginal tax rate on labor income…. [T]his marginal tax rate accounts for the predominance of the differences at points in time and the large change in relative labor supply over time.5
Edward Prescott, “Why Do Americans Work So Much More Than Europeans?” Cambridge, MA: NBER Working Paper w10316, February 2004.
Two of the studies (the third and last one cited above) show that high taxes have significant negative effects on the supply of labor, thereby lowering output. Two of the studies (the second and fourth) show that lowering taxes on dividends powerfully increases the amount of dividends, while the remaining study suggests that the elderly rich migrate to low-tax states, lowering tax revenues in high-tax states in the process. Without exception, these studies are consistent with the view that taxes significantly impact human behavior, often in ways that lower income and labor and capital inputs (and thereby output).
Literally scores of other studies reach the same general conclusion. Some of the studies look at different geographic areas (nations or American states) at one moment in time; others look at the same area over different periods in time; still others use questionnaires or other means to assess behavioral impacts. Similarly, alternative economic indicators are used: the growth in income, output, employment, new business start-ups, etc. Some studies find modest-sized relationships between taxes and the economic indicator examined, while others find stronger relationships. Most of them find, however, that taxes on balance have at least some adverse impact on the growth in incomes, output, jobs, business investment, human migration, etc.
A full review of the literature is beyond the scope of this essay, but some examples will strengthen the points made above. In the third quarter of the twentieth century, say around 1960, the prevailing view was that “taxes do not matter” much in economic decision making. Speaking of the business location literature, the distinguished public finance professor John Due said in 1961 that studies “suggest very strongly that the tax effects cannot be of major importance.”6
John F. Due, “Studies of State-Local Tax Influences on the Location of Industry,” National Tax Journal 14 (November 1961): 163–73.
Ronald Grieson, William Hamovitch, and Richard Morgenstern, “The Effects of Business Taxation on Industry,” Journal of Urban Economics, April 1977; Deborah S. Ecker and Richard F. Syron, “Personal Taxes and Interstate Competition for High Technology Industries,” New England Economic Review, September/October 1979, 25–32; Thomas R. Plaut and Joseph E. Pluta, “Business Climate, Taxes and Expenditures, and State Industrial Growth in the United States,” Southern Economic Journal 50, no. 1 (July 1983): 99–119; and Robert Premus, “Location of High Technology Firms and Economic Development,” Staff Study, Joint Economic Committee of Congress (Washington, DC: Government Printing Office, 1983).
Thomas Romans and Ganti Subrahmanyam, “State and Local Taxes, Transfers, and Regional Income Growth,” Southern Economic Journal 46, no. 2 (October 1979): 435–44; L. Jay Helms, “The Effect of State and Local Taxes on Economic Growth: A Time Series–Cross Section Approach,” Review of Economics and Statistics 67, no. 4 (November 1985): 574–82; Bruce L. Benson and Ronald N. Johnson, “The Lagged Impact of State and Local Taxes on Economic Activity and Political Behavior,” Economic Inquiry 24, no. 3 (July 1986): 389–401; Victor A. Canto and Robert Webb, “The Effect of State Fiscal Policy on State Relative Economic Performance,” Southern Economic Journal 54, no. 1 (July 1987): 186–202; and Alaeddin Mofidi and Joe A. Stone, “Do State and Local Taxes Affect Economic Growth?” Review of Economics and Statistics 72, no. 4 (November 1990): 686–91.
Five representative examples: Keith Marsden, “Links Between Taxes and Economic Growth: Some Empirical Evidence,” Washington, DC: World Bank Staff Working Papers no. 604, 1983; Reinhard B. Koester and Roger C. Kormendi, “Taxation, Aggregate Activity, and Economic Growth: Cross-Country Evidence on Some Supply-Side Hypotheses,” Economic Inquiry 27, no. 3 (July 1989): 367–80; Alan Reynolds, “Some International Comparisons of Supply-Side Policy,” Cato Journal 6, no. 2 (Fall 1985): 545–55; Bernhard Heitger, “Convergence, ‘The Tax State,’ and Economic Dynamics,” Weltwirtschaftliches Archiv 129, no. 2 (1993): 254–74; and Gian Maria Milesi-Ferretti and Nouriel Roubini, “Growth Effects of Income and Consumption Taxes,” Journal of Money, Credit, and Banking 30, no. 4 (November 1998): 721–44.
Nor have the studies been confined to analysis of income or output growth. Just as Edward Prescott and others have noted that taxes reduce labor effort of those working, other researchers have studied the impact of taxes on the number of people holding jobs or, conversely, the number who are unemployed, most often finding that increased taxation has adverse employment effects.10
Six examples: Michael Wasylenko and Therese J. McGuire, “Jobs and Taxes: The Effects of Business Climates on States' Employment Growth Rates,” National Tax Journal 38, no. 4 (December 1985): 497–511; Andrew Newell and James Symons, “Macroeconomic Consequences of Taxations in the '80s,” Discussion Paper 121 (London: London School of Economics, Centre for Economic Performance), February 1993; Ernest Goss, Phillips Preston, and Joseph M. Phillips, “State Employment Growth: The Impact of Taxes and Economic Development Agency Spending,” Growth and Change 25, no. 3 (Summer 1994): 320–33; Douglas R. Dalenberg and Mark D. Partridge, “The Effects of Taxes, Expenditures, and Public Infrastructure on Metropolitan Area Employment,” Journal of Regional Science 35, no. 4 (November 1995): 617–40; Guido Tabellini and Francesco Daveri, “Unemployment, Growth, and Taxation in Industrial Countries,” London: Centre for Economic Policy Research, Discussion Paper 1681, August 1997; and Stephen T. Mark, Therese J. McGuire, and Leslie E. Papke, “The Influence of Taxes on Employment and Population Growth: Evidence from the Washington, D.C. Metropolitan Area,” National Tax Journal 53, no. 1 (March 2000): 105–23. For Prescott's work, see note 5 above.
Helen F. Ladd and Katharine L. Bradbury, “City Taxes and Property Tax Bases,” National Tax Journal 41, no. 4 (December 1988): 503–23.
Robert Carroll et al., “Personal Income Taxes and the Growth of Small Firms,” Cambridge, MA: NBER Working Paper w7980, October 2000; and James R. Hines, Jr., “Altered States: Taxes and the Location of Foreign Direct Investment in America,” American Economic Review 86, no. 5 (December 1996): 1076–94.
A few representative samples from different time periods: Richard J. Cebula, “Local Government Policies and Migration: An Analysis for SMSA's in the United States, 1965–1970,” Public Choice 19 (Fall 1974): 185–93; Lynn E. Browne, “The Shifting Pattern of Interregional Migration,” New England Economic Review, November–December 1979, 17–32; William A. Niskanen, “The Case for a New Fiscal Constitution,” Journal of Economic Perspectives 6, no. 2 (Spring 1992): 13–24; and Karen Smith Conway and Andrew J. Houtenville, “Elderly Migration and State Fiscal Policy: Evidence from the 1990 Census Migration Flows,” National Tax Journal 54 no. 1 (March 2001): 103–23.
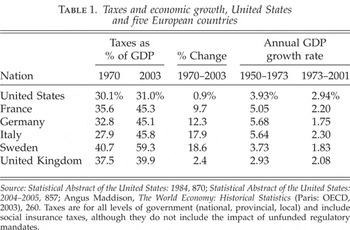
This huge body of evidence, only a small part of which is cited here, is confirmed by less rigorous, more casual observation. Western Europe, which in the 1950s and 1960s grew far faster than the United States, has grown far slower in recent years, as table 1 indicates.14
It is true that the 1950s European growth rates were at least partially enhanced by the “catch up” effect of recovering from World War II related damage, although that factor clearly was not so important in the equally high-growth 1960s, long after the war's end and long after output had exceeded prewar levels.
Angus Maddison, The World Economy: Historical Statistics (Paris: OECD, 2003), 69, and author's calculations.
U.S. Bureau of the Census, Statistical Abstract of the United States: 1973 (Washington, DC: Government Printing Office, 1973), 812.
In the 1995–2000 period, Russia's economic growth was actually negative according to official statistics, while it has averaged about 5 percent a year since 2001. To be sure, the numbers are somewhat suspect because of a sizable underground economy in the years when tax rates were high, and because of transitional difficulties after the collapse of the Soviet Union in the early 1990s, including the Russian financial crisis of 1998.
The data are from the U.S. Bureau of the Census, available at http://www.census.gov. The numbers are the sum of estimates for 1990 to 1999 and 2000 to 2004, and exclude the period from July 1, 1999, to April 1, 2000. The non-income-tax states are Alaska, Florida, Nevada, New Hampshire, South Dakota, Tennessee, Texas, Washington, and Wyoming. The exclusion of data from July 1999–April 2000 simply reflects the fact that between decennial censuses, the Census Bureau does annual population estimates (including migration) for states as of July 1, except in the year in which the Census was taken on April 1. Thus, the data for the short 1999–2000 period are unavailable.
The Tax Foundation website, at www.taxfoundation.org, is a particularly good source of information on taxes in the United States. In addition to sluggish income growth, in large parts of the modern era (e.g., the early 1980s, in 2003–2005), Ohio's unemployment rate has exceeded the national average by significant amounts.
Taxes and economic growth, United States and five European countries

Before moving on, it is worthwhile to briefly ponder why the strong negative relationship between taxes and growth exists. The disincentive effects of taxation on savings, investment, innovation, and work effort have already been mentioned. But in the most fundamental sense, taxation takes resources from the relatively productive (in most modern societies with market economies and a strong rule of law) private sector, and diverts those resources to the public sector, which is less productive, since it is less competitive (more monopolistic) and does not face the accountability, the “bottom line,” that markets impose. Private businesses strive for increased profits by becoming more efficient (lowering costs) and offering better products. The profit incentive is absent in most government enterprises.
III. Taxes and Human Welfare—Is There a Relationship?
It is one thing to present evidence that high and increased levels of taxation tend to reduce the levels of income, wealth, and employment, but quite another thing to demonstrate that high taxes lead to reduced levels of happiness or well-being. One fundamental problem is that utility (economist jargon for satisfaction or happiness) cannot be scientifically measured with any great precision—a major reason why, for example, economic historians still debate whether the Industrial Revolution that came to Great Britain was, in some ultimate sense, a success or a failure. Material gains do not necessarily equate with gains in happiness.
Economists say that “cardinal utility”—a precise quantitative measure of the satisfaction derived from an activity or good purchased—is not measurable, whereas “ordinal utility” (as determined by preferences for one activity or good relative to others) is. I can say with reference to new cars, “I prefer a Lexus to a Honda,” but I cannot meaningfully say, “I believe I will be 42.17 percent more satisfied with a Lexus than a Honda.”
There are two major arguments that can be used to suggest that the welfare of the general populace may be improved by large government financed by taxes even if the crowding-out of productive private-sector activity reduces levels of income and wealth. The first argument is that much of what government does has what economists call “positive externalities”—spillover benefits that accrue not only to the user of government-provided services, but to society as a whole. For example, education spending, it is argued, leads to higher literacy, which in turn leads to better communications, lowering the costs of transactions and making the market economy more efficient in allocating resources. Also, a well-educated electorate is more likely to pick leaders who are wise and moral, as opposed to corrupt charlatans. These positive spillover effects are not present, we are told, in most goods and services sold in the private sector.
The second argument states that the material well-being of individuals is related not only to the absolute amount of income or wealth that people have, but to the distribution of that income or wealth. As Karl Marx once said, “A house may be large or small; as long as the surrounding houses are equally small, it satisfies all social demands for a dwelling. But if a palace rises beside the little house, the little house shrinks into a hut.”20
Karl Marx, “Wage-Labor and Capital,” in Selected Works, vol. 1 (New York: International Publishers, 1933).
Therefore, it is at least plausible that a society with average household income of $45,000 where the overwhelming majority (say, 85 percent) of households have between $25,000 and $75,000 in income will have a higher level of aggregate happiness, and an absolutely larger number of happier people, than a society with average household income of $50,000, but where there are a large proportion of households (say, 30 percent) with less than, say, $25,000 in income and another good-sized group (say, 15 percent) with more than $75,000. It is argued that income is subject to diminishing marginal utility, meaning that adding $1,000 in income to households who already have $200,000 in income will increase their happiness far less than adding the same $1,000 in income to households with $20,000 in income. Since both taxation and tax-financed government spending can be used to reduce inequalities in disposable (after-tax) income, taxation (particularly progressive taxation that is directed disproportionately to upper-income persons) can serve to increase the well-being of a large majority of the population, causing only modest losses in well-being to a relatively small minority. This is in keeping with the utilitarian ideal, attributable to Jeremy Bentham, of “the greatest good for the greatest number.”21
For a good discussion of utilitarian philosophy as it relates to this discussion and more specifically to Jeremy Bentham, see Joseph A. Schumpeter, History of Economic Analysis (New York: Oxford University Press, 1954), esp. 128–34.
Looking at the first argument, it is extremely hard to measure “positive externalities,” a somewhat imprecisely defined concept that ultimately depends on evaluating the utility derived from governmental activity. One might argue equally that governmental activities sometimes have negative spillover effects or externalities. The government constructs a sewage plant that emits an odor. The residents in the area surrounding the plant see their utility decline—as well as the value of their houses. It is not unambiguously clear a priori whether governmental activities in the aggregate have positive or negative spillover effects. Moreover, private expenditures can have positive spillover effects as well—my neighbor puts up a gorgeous Christmas holiday display in his front yard, which I enormously enjoy. His spending provides utility to me, although I cannot precisely measure it given the inability to measure cardinal utility. In contrast, some private activity has negative externalities—an entrepreneur opens a bar near my house that brings a lot of noise and alcohol-induced reckless driving to my neighborhood. My utility declines. All in all, it is hard to say whether governmental or private activities have more positive or negative spillover effects impacting on human welfare.
Yet there is one form of human behavior that is measurable that does relate quite directly to the issue of positive and negative externalities—human migration. When a person moves from A to B, he or she is revealing a preference for B—in effect saying, “I think life will be better in coming years in B than if I were living in A.” Implicitly, assuming people in general wish to maximize their satisfaction or utility in life, the mover says, “I believe I will derive more utility living in B than living in A.” Migration is an exercise in revealing one's ordinal utility rankings.
If area B has more taxes and governmental services than area A, but similar income levels, job opportunities, climate, etc., it may well be that the move to the high-tax area B reflects the fact that the governmental services provided there have external benefits not reflected in the dollar value of the services provided. If positive externalities result from governmental activity, this should be reflected in in-migration, as people move to acquire the benefits associated with the governmental services. If governmental activity produces net positive externalities, one would expect a positive relationship between the size of government (measured by tax burden or governmental expenditures) and the in-migration of people.
This is a testable proposition. Indeed, as mentioned above, a number of studies have looked at the relationship between government size and in-migration, and have found a negative or nonexistent relationship, inconsistent with the notion that tax-financed governmental activity produces large positive external benefits. I confirmed that directly by using regression analysis to explain variations in net domestic migration among the fifty American states and the District of Columbia over the period from 1990 to 2004. I regressed the tax burden of each state in the middle of that period (as measured by total state and local taxes as a percentage of personal income) against the net number of in-migrants. Doing so produced a statistically significant (at the 5 percent level) negative relationship—persons tended to move away from the high-tax states. Adding some other possible factors into the analysis for control purposes (e.g., average income levels and the number of days the sun typically shines), the relationship remains negative. This finding certainly is inconsistent with the notion that large positive externalities of government spending add significantly to the quality of life.22
For a more extended discussion, see my Taxation and Migration: Do Tax Decisions of State and Local Government Officials Impact on the Movement of People? (Cedarburg, WI: Taxpayers Network, March 2003). The Census data in question are not classified by age. Other data suggest that while it is true that the elderly migrate in moderately large numbers, an even larger group quantitatively is young adults—relatively new workers to the labor force.
For readers less acquainted with multivariate statistical techniques, I made a simple calculation. I took the ten states that in the middle of the period examined had the highest tax burdens. I found that those states had a net out-migration of 2,976,513 persons from 1990 to 2004. I then compared that with the ten states with the lowest tax burden. They had a net in-migration of 4,199,194.23
Data were provided by the U.S. Bureau of the Census (and available via www.census.gov). Data on state and local tax burdens in 1997 (from the Census of Governments of that year) were divided by state personal income (provided by Bureau of Economic Analysis via www.bea.doc.gov) to obtain the average tax burden. The year 1997 was the mid-year in the period.
I turn now to the second argument discussed above. This argument suggests that economic growth fostered by low levels of taxation might not be welfare-enhancing because the unequal distribution of income or wealth affects well-being. Studies based on average data ignore income distribution, and widening income inequality might lower utility as much as (or more than) rising general income levels raise it. The validity of this scenario, however, is questionable for a variety of reasons.24
The classic work questioning the policy of using government fiscal policy to bring about changes in the distribution of income and wealth is Walter J. Blum and Harry Kalven, Jr., The Uneasy Case for Progressive Taxation (Chicago: University of Chicago Press, 1953).
To begin with, the thesis that increasing economic equality associated with bigger government has positive welfare effects cannot be evaluated if we cannot agree on the appropriate measures of economic inequality. It is my contention that the measure most often used is inappropriate, and that alternative measures often show a dramatically different picture as to the amount and trends in inequality.
At least three different economic indicators are commonly used in evaluating inequality: personal income, wealth, and consumption expenditures. Of these, income is the most used indicator, consumption the least. Yet it is my contention that consumption is the best of the three indicators for measuring the welfare implications of the inequality of economic conditions in any given time period. People do not derive utility from the income they earn as much as from the income they spend. Income taken from individuals involuntarily in the form of taxes or voluntarily in the form of savings does not provide direct material satisfaction to those individuals, at least in the period in which the individual is taxed or saves. To be sure, savers are, in effect, bribed to forgo consumption by the prospects of receiving future interest, dividend, and capital-gains income. Yet the ultimate goal of economic activity is consumption, not the act of earning the income itself, and that is why people have to be induced (through interest and dividend payments) to save rather than consume.
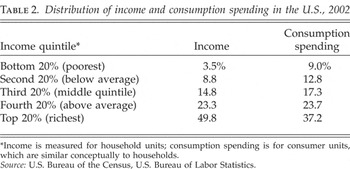
Data on consumption spending is less readily available than income data, but the Bureau of Labor Statistics of the U.S. Department of Labor has a much respected Consumer Expenditure Survey that provides relatively good consumption data. Table 2 shows consumption data for 2002 classified by income quintiles, along with Census Bureau data on household income similarly classified.25
U.S. Department of Labor, Bureau of Labor Statistics, Report 974, Consumer Expenditures in 2002 (Washington, DC: Government Printing Office, February 2004), table 1; U.S. Census Bureau, Historical Income Tables—Households, available at http://www.census.gov/hhes/income/histinc/h02ar.html (accessed February 22, 2005).
Distribution of income and consumption spending in the U.S., 2002

The data show that consumption spending is far more compressed (equal) than income. The richest 20 percent have four times the share of total consumption compared to the poorest 20 percent, while the richest 20 percent of households have more than fourteen times as much income. While the poorest Americans have only 3.5 percent the nation's income, they are responsible for 9 percent of its consumption, a share two and a half times as large as their share of income. The rich save or pay taxes equal to large portions of their income, while the poor actually dissave significantly, spending far more than they earn in income.
The major reason why the distribution of consumption spending is only roughly half as unequal as the distribution of income is that consumption spending is heavily influenced by expected lifetime income, not just income receipts in a particular twelve-month period. Americans have extraordinary income mobility, moving up and down the economic ladder frequently and sometimes abruptly. A “poor” person one year may be a financially average American two years later, and in the following decade might be rich. The “poor” that the government might try to subsidize this year may be the “rich” that they “soak” through high taxes next year.
The data demonstrating high income mobility are striking. Treasury Department data from 1992 showed that 86 percent of the poorest Americans in 1979 (those in the bottom 20 percent of the distribution) moved to a higher quintile in the income distribution in the next nine years.26
See Income Mobility and the U.S. Economy: Open Society or Caste System? Joint Economic Committee of Congress, 102nd Congress, Second Session, January 1992.
Daniel P. McMurrer and Isabel V. Sawhill, “How Much Do Americans Move Up and Down the Economic Ladder?” Urban Institute, Opportunity in America, no. 3, 1996.
W. Michael Cox and Richard Alm, “By Our Own Bootstraps: Economic Opportunity and the Dynamics of Income Distribution,” Federal Reserve Bank of Dallas, 1995 Annual Report, pp. 2–23; Lawrence Mishel, Jared Bernstein, and John Schmitt, The State of Working America (Ithaca, NY: Cornell University Press, 2000). See also Cox and Alm's book Myths of Rich and Poor: Why We're Better Off Than We Think (New York: Basic Books, 1999), esp. chap. 4.
To the extent that incomes tend to equalize over time, a case can be made for public tax and spending policies that are relatively neutral toward the distribution of income, since single-year income differences are of little long-term meaning in terms of life income equality. While no one claims that incomes perfectly equalize over time, lifetime income differentials are sharply smaller than the single-year differentials most often cited.
This brings us to another problem with the arguments that tax-financed government expenditures might be on balance utility-enhancing. Suppose that, despite the argument made above, it were concluded that promoting income equality is utility-enhancing on balance. Such conclusions could not be made with any confidence based on empirical evidence, particularly given the extreme difficulty of measuring utility. But even if one were to accept the notion that income inequality is an obstacle in maximizing the community's welfare (or utility), what assurances are there that tax-financed government spending would reduce that inequality? As the economist Gordon Tullock pointed out more than two decades ago, large amounts of government spending are essentially middle-class or even upper-class entitlements—subsidies for pro football stadiums, National Public Radio, and even farmers come to mind, not to mention corporate welfare such as the Export-Import Bank.29
Gordon Tullock, Economics of Income Distribution (Boston: Kluwer-Nijhoff, 1983).
For example, in 1983, after federal expenditures per capita on the poor had expanded nearly fourfold in real terms since the Great Society era, the poverty rate was higher than in 1966, before the War on Poverty had gotten far off the ground. Lowell Gallaway and I have argued that the federal government got on the wrong side of what we termed the “poverty-welfare curve.” See our short monograph Poverty, Income Distribution, the Family, and Public Policy, Joint Economic Committee of Congress (Washington, DC: Government Printing Office, 1986).
For details on poverty, see U.S. Bureau of the Census, Current Population Reports, P-60-226, Income, Poverty, and Health Insurance in the United States: 2003 (Washington, DC: Government Printing Office, 2004).
Author's calculations from the U.S. Council of Economic Advisers, Economic Report of the President: 2003 (Washington, DC: Government Printing Office, 2003), from tables on pp. 373 and 276. Including state and local governments in the analysis does not change the conclusion, although the decline in the relative size of government is smaller (from 30.99 percent to 30.04 percent).
The notion that government spending might increase poverty (and increase income inequality) is hardly new: in 1848, Frédéric Bastiat opined that the state “produces more poverty than it cures.”33
Frédéric Bastiat, Selected Essays on Political Economy (Irvington-on-Hudson, NY: Foundation for Economic Education, 1964).
Richard Vedder, Lowell Gallaway, and David Sollars, “The Tullock-Bastiat Hypothesis: The Inequality-Transfer Curve and the Natural Distribution of Income,” Public Choice 56 (1988): 285–94.
As a general proposition, does economic growth (whether stimulated by lower taxes or other means) generally lead to greater or lesser amounts of income inequality? The most famous answer to that question comes from the painstaking work of economist Simon Kuznets (who netted a Nobel Prize for his efforts). Kuznets suggested, based on examining empirical evidence, that economic growth among poor nations may generate greater inequality, but that, as nations get wealthier, growth is associated with lesser inequality.35
Simon Kuznets, “Economic Growth and Income Inequality,” American Economic Review 45 (March 1955): 1–28.
A representative recent study, using Italian time series data, is Gianni Toniolo, Nicola Rossi, and Giovanni Vecchi, “Is the Kuznets Curve Still Alive? Evidence from Italy's Household Budgets, 1961–1991,” CEPR Working Paper No. 2140, May 1999, available at http://papers.ssrn.com/so13/papers.cfm?abstrract_id=175468 (accessed February 22, 2005). This paper is particularly appealing in that it uses consumption data.
In short, arguments used to justify tax-financed expansions of government on the grounds that they promote the general welfare and human happiness appear to me to be largely statements of faith not justified by the realities of the modern world. To the extent that empirical evidence speaks to this issue at all, it suggests that Americans prefer to live in relatively low tax areas where economic prosperity is enhanced by the relatively less fettered operation of market processes.
IV. Markets and the Elimination of Spatial Income Inequality
As the foregoing discussion suggests, it is an unproven hypothesis that reductions in income inequality are associated with advances in human satisfaction, and, even if it were proven, governments have a dubious track record in promoting equality. Yet, given the difficulties of measuring utility, it is still an unsettled question whether happiness is promoted by reducing the gap between the rich and the poor. The fact that people tend to migrate over time from poor to rich areas (for example, far more persons migrate from India, China, or Mexico to the United States than in the opposite direction) suggests that the acquisition of income is perceived to be utility-enhancing. If low-income countries have income gains relative to higher-income ones, they should witness some utility gains similar to what happens with migration from low- to high-income areas. Because of this, a case can be made, at least on a global level, for reducing income inequality (by having higher economic growth in lower-income countries relative to more affluent ones). The really huge disparities in income are not found within nations like the United States, but between rich and poor countries.
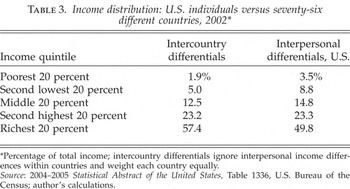
Table 3 documents these large international income disparities. Taking the average income levels in seventy-six countries for which data were available for 2002, I have treated each country as if it were an individual. I have then compared the quintile shares of the total income of these seventy-six individuals (actually, countries) with the shares for individuals living in the United States in the same year. The data show that the richest 20 percent of countries have thirty times the proportion of total income as the poorest ones do, more than double the differential between the rich and poor for individuals within the U.S. The rich nations produce a larger proportion of total world income (so measured) than rich individuals do of total U.S. income. International inequality is greater than interpersonal inequality within the United States. Moreover, for a variety of technical reasons, the statistics in table 3 probably understate international inequality. Purchasing-power-parity income data are used instead of data based on exchange rates, which would show even greater international inequality, for example. Many nations are excluded, a majority of which are poor (e.g., Haiti). Since many poor countries are populous (e.g., India), a weighted (by population) table would probably show even more inequality than is indicated here.
Income distribution: U.S. individuals versus seventy-six different countries, 2002*

It is arguable that the world would be a better place if these wide disparities were reduced. In a world with a strong rule of law and property rights, no significant barriers to moving people or resources, and only minimal governmental interferences and involvement in the economy, economists would predict that international differences in average income levels would be drastically reduced. In such a world, capital would migrate from high- to low-wage countries to minimize labor costs, while labor would migrate from low- to high-wage areas to increase worker earnings. The two moves would serve to equalize differences in the amount of capital available per worker, and thereby also help to equalize incomes. This basic framework was most explicitly developed in a model by Robert Solow and was an important factor in his receiving the Nobel Prize in Economic Science.37
Robert M. Solow, “A Contribution to the Theory of Economic Growth,” Quarterly Journal of Economics 70 (February 1956): 65–94.
Robert J. Barro and Xavier Sala-i-Martin, “Convergence,” Journal of Political Economy 100, no. 2 (April 1992): 223–51.
A few representative samples from the 2002–2004 period: Gasper A. Garofalo and Steven Yamarik, “Regional Convergence: Evidence from a New State-by-State Capital Stock Series,” Review of Economics and Statistics 84, no. 2 (May 2002): 316–23; Leo Michelis and Simon Neaime, “Income Convergence in the Asia-Pacific Region,” Journal of Economic Integration 19, no. 3 (September 2004): 470–98; David Cook, “World War II and Convergence,” Review of Economics and Statistics 84, no. 1 (February 2002): 131–38; Frank S. T. Hsiao and Mei-Chu W. Hsiao, “Catching Up and Convergence: Long-Run Growth in East Asia,” Review of Development Economics 8, no. 2 (May 2004): 223–36; S. Nahar and B. Inder, “Testing Convergence in Economic Growth for OECD Countries,” Applied Economics 34, no. 16 (November 2002): 2011–22; and Eric Neumayer, “Beyond Income: Convergence in Living Standards, Big Time,” Structural Change and Economic Dynamics 14, no. 3 (September 2003): 275–96.
Three recent examples: Richard Kozul-Wright and Robert Rowthorn, “Globalization and the Myth of Economic Convergence,” Economic Appliquée 55, no. 2 (June 2002): 141–78; Stephen M. Miller and Mukti P. Upadhyay, “Total Factor Productivity and the Convergence Hypothesis,” Journal of Macroeconomics 24, no. 2 (June 2002): 267–86; and Javier Andrés, José E. Boscá, and Rafael Doménech, “Convergence in the OECD: Transitional Dynamics or Narrowing Steady-State Differences?” Economic Inquiry 42, no. 1 (January 2004): 141–49.
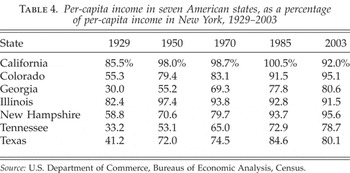
The reasons for this somewhat mixed evidence are explained by tables 4 and 5. In table 4, personal income per capita for seven states scattered around the U.S. is expressed as a percentage of the level prevailing in New York, the most populous and one of the most prosperous states at the beginning of the period examined. In every single state, a majority of the percentage income differential with New York was erased from 1929 to 2003—strong evidence of income convergence. In a majority of the states, income converged on the New York figure at every date included in the chart. Southern and border states like Georgia and Tennessee had less than one-third the per-capita income level of New York in 1929, but more than three-fourths that level by 2003. In Georgia, for example, 72.3 percent of the differential with New York was eliminated. To be sure, convergence was not always continuous or complete, but it was still substantial and real. Note that in California and Illinois income levels stopped converging on New York (at almost New York's level) around 1950 and actually have diverged slightly since. Convergence, then, does not appear to be complete, but the sharp narrowing of regional income differentials is still one of the most important dimensions of twentieth-century American economic history.
Per-capita income in seven American states, as a percentage of per-capita income in New York, 1929–2003

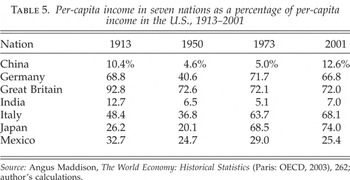
Per-capita income in seven nations as a percentage of per-capita income in the U.S., 1913–2001

The international data, however, are far more mixed. Only three of the seven nations shown in table 5 show any convergence with the U.S. over the very long run (1913 to 2001), with two of them (Japan and Italy) showing the classic convergence similar to that observed by states in the U.S., and one, China, showing very limited convergence. Three nations (Great Britain, India, and Mexico) actually diverged significantly from the U.S. over time, while the seventh nation, Germany, showed little change (modest divergence). In short, table 5 is a mixed bag of results not very strongly supporting the convergence hypothesis.
Yet an examination of tables 4 and 5 suggests a reason for these diverging patterns. In the U.S., there is a relatively uniform rule of law, protection of property rights, a regulatory regime that is moderate by world standards, and taxation that is low by the standards of modern welfare states. In that environment, the forces of markets work to greatly reduce geographically-related income inequality over time. In nations where those characteristics (e.g., the rule of law, low taxation, minimal regulation, etc.) have been absent (e.g., Mexico, India, or until the past generation, China) divergence occurs, as it does when wars (a form of massive government spending) absorb a large portion of national resources (see, e.g., the German, British, and Japanese divergence in the 1913–1950 period in table 5). Labor resources are not free to leave and capital resources have no desire to migrate into authoritarian societies where there are few if any private property rights. Some recent empirical work confirms that increased government taxes and spending have adverse effects on economic growth in general (in keeping with the discussion in Section II of this essay) and on convergence in particular.41
On taxes and convergence, see Benjamin Russo, “Taxes, the Speed of Convergence, and Implications for Welfare Effects of Fiscal Policy,” Southern Economic Journal 69, no. 2 (October 2002): 444–56; see also Michelis and Neaime, “Income Convergence in the Asia-Pacific Region.”
Using American state data, I looked at the role of state and local tax burdens in income convergence over the period from 1970 to 2003, years for which good tax data are available.42
The tax data are from the Tax Foundation website, http://www.taxfoundation.org/statelocal70.html, and also http://www.taxfoundation.org/statelocal03.html; the income per capita data are from the website of the Bureau of Economic Analysis, U.S. Department of Commerce, at http://www.bea.doc.gov/bea/regional/spi/drill.cfm.
The states were Alabama, Colorado, Georgia, Maine, Mississippi, Nebraska, New Hampshire, North Carolina, North Dakota, South Carolina, South Dakota, Tennessee, Vermont, Virginia, and Wyoming.
The states were Arizona, Florida, Idaho, Indiana, Iowa, Missouri, Montana, Oklahoma, Oregon, and Utah.
Income equalization between areas is a by-product of convergence. High-tax welfare states and authoritarian societies that reject market solutions to problems have been slow to converge on the most affluent societies like the United States, where the discipline of the market plays a dominant resource-allocation role—witness the end to convergence in Britain and Germany after episodes of large growth in government (in the 1930s and 1940s in Britain, after 1973 in Germany). Not only are market solutions more conducive to the growth of incomes and prosperity, they are also more powerful and successful in equalizing economic opportunities across time and space. It may seem ironical to some readers that greater income equality can be achieved with less government, less taxation, and less redistribution—but that is what the evidence suggests. Well-intended government policies often have behavioral effects that lead to unintended consequences.
V. Conclusion
Humans have a finite time on earth, and most want to use it productively, which in some ultimate sense means having a fulfilling, happy existence. Two visions for achieving this goal exist—a market vision where the “invisible hand” allocates resources and provides rich rewards for those exercising hard work and innovation, and a welfare state approach where collective action by government is used to provide security and to equalize opportunities, funded by high taxation. The low-tax, smaller-government model simply works better in delivering the goods—lower taxes (or lower government spending, for that matter) are associated with higher growth in incomes.
Which model works better in dividing up the goods? It is not altogether clear that it really matters from the standpoint of maximizing human welfare, given the difficulty of demonstrating that income equality is in some sense utility-enhancing. Even if it does matter, however, the evidence that bigger government brings about greater opportunities for the disadvantaged or eliminates poverty is very weak indeed. The fact that people migrate into low-tax, smaller-government areas is a powerful hint that people perceive themselves to be happier in a low-tax environment where individual responsibility takes primacy over group rights and entitlements. Moreover, in a very important sense, the market is a very powerful and effective institution in equalizing incomes as well. The poor in China are declining in numbers and in levels of destitution not because of the success of a benevolent socialist experience or welfare state, but because of the rejection of that approach by pragmatic “communists” who are far more embracing of markets than many Western political leaders. Market-induced globalization has brought job and investment opportunities to relatively poor Chinese, reducing their relatively inferior economic status. A low tax and spend society where markets and individuals, not collective organizations, make decisions appears better for promoting material prosperity, a better way of life, and reduced poverty and destitution on our planet.