INTRODUCTION
During the last few decades of the 20th century, a higher level of awareness arose regarding the impact of global climate change on the world's economy (Houghton et al. Reference Houghton, Meira Filho, Callander, Harris, Kattenburg and Maskell1996) and on agricultural production, its most vulnerable component (Watson et al. Reference Watson, Zinyowera and Moss1996). Owing to the lack of scientifically based agricultural policy and the low level of agricultural inputs, agricultural production in less developed and developing countries is especially vulnerable to climate variability and extreme weather events (Sivakumar & Motha Reference Sivakumar and Motha2007; Stigter Reference Stigter2010). South-eastern Europe is a highly heterogeneous region in the sense of agricultural production conditions and its systems. With agricultural production accounting for as much as 0·11 of Serbia's national GDP in 2004 (Statistical Office of the Republic of Serbia 2006), the overall regional economy is highly vulnerable to changes that affect agriculture.
The scientific community has invested much effort in assessing the effects of climate change on agricultural production on a global scale (Rosenzweig & Iglesias Reference Rosenzweig and Iglesias1994; Harrison & Butterfield Reference Harrison and Butterfield1995; Harrison et al. Reference Harrison, Butterfield and Downing1995; Wolf & van Diepen Reference Wolf and van Diepen1995; Watson et al. Reference Watson, Zinyowera and Moss1996; Downing et al. Reference Downing, Harrison, Butterfield and Lonsdale2000; Parry et al. Reference Parry, Canziani, Palutikof, van der Linden and Hanson2007, among others) and on a regional scale (Alexandrov et al. Reference Alexandrov, Eitzinger, Cajic and Oberforster2002; Patil et al. Reference Patil, Laegdsmand, Olesen and Porter2010; Iqbal et al. Reference Iqbal, Eitzinger, Formayer, Hassan and Heng2011; Kristensen et al. Reference Kristensen, Schelde and Olesen2011; Thaler et al. Reference Thaler, Eitzinger, Trnka and Dubrovsky2012). Recently, the focus of studies about climate change impacts on agricultural production has shifted in the direction of suggestions about how climate change will affect current agricultural systems at individual locations (Eitzinger et al. Reference Eitzinger, Orlandini, Stefanski and Naylor2010). Particular attention in the above studies has been devoted to the following: (a) plant responses to extreme weather events and changing climate (e.g. Foulkes et al. Reference Foulkes, Scott and Sylvester-Bradley2001; Kamara et al. Reference Kamara, Menkir, Badu-Apraku and Ibikunle2003; Beniston et al. Reference Beniston, Stephenson, Christensen, Ferro, Frei, Goyette, Halsnaes, Holt, Jylhä, Koffi, Palutikof, Schöll, Semmler and Woth2007; Klik & Eitzinger Reference Klik and Eitzinger2010; Trnka et al. Reference Trnka, Eitzinger, Dubrovsky, Semeradova, Stepanek, Hlavinka, Balek, Skalak, Farda, Formayer and Zalud2010), (b) crop production in conditions of altered water availability (e.g. Downing et al. Reference Downing, Butterfield, Edmonds, Knox, Moss, Piper and Weatherhead2003; Arnell Reference Arnell2004; Attaher et al. Reference Attaher, Medany, Abdel Aziz and El-Gindy2006; Bates et al. Reference Bates, Kundzewicz, Wu, Palutikof, Bates, Kundzewicz, Wu and Palutikof2008; Anderson et al. Reference Anderson, Arblaster, Bartley, Cooper, Kettunen, Kaphengst, Leipprand, Laaser, Umpfenbach, Kuusisto, Lepistö and Holmberg2008) and (c) adaptation measures and its limits (e.g. Mendelson & Dinar Reference Mendelson and Dinar1999; Nelson et al. Reference Nelson, Rosegrant, Koo, Robertson, Sulser, Zhu, Ringler, Msangi, Palazzo, Batka, Magalhaes, Valmonte-Santos, Ewing and Lee2009; Smith & Olesen Reference Smith and Olesen2010; Deressa et al. Reference Deressa, Hassan and Ringler2011).
Global climate model (GCM) simulations are employed using dynamical downscaling (regional climate models, RCM) (e.g. Laprise Reference Laprise2008) or statistical downscaling (weather generators) (e.g. Dubrovsky et al. Reference Dubrovsky, Zalud and Stastna2000) techniques. Results from all GCMs suggest that the countries in south-eastern Europe are facing significant impacts from climate change (Chimielewski & Rötzer Reference Chimielewski and Rötzer2002; Vidale et al. Reference Vidale, Lüthi, Wegmann and Schär2007), resulting in an increased frequency of extreme weather events and a significant change in the rate and amplitude of different meteorological elements. However, predictions for the area of the Pannonian lowland may be subject to pronounced bias. For example, in south-eastern Europe, the observed frequency of the ‘summer drying problem’ (SDP; the frequency and intensity of drought periods during summer) is significantly different from predictions using GCM simulations (Machenhauer et al. Reference Machenhauer, Windelband, Botzet, Christensen, Deque, Jones, Ruti and Visconti1998; Hagemann et al. Reference Hagemann, Machenhauer, Jones, Christensen, Deque, Jacob and Vidale2004; Rowell & Jones Reference Rowell and Jones2006). The impact of expected climate change effects and the response of crops depends on: (a) the most pronounced change in meteorological elements; (b) land use, soil types and crop access to groundwater and (c) the intensity and type of production techniques (crop management). To assess the severity of climate change effects on crop growth and yield with regard to the impact of single climatic parameters, it is necessary to explore correlations between agroclimatic indices, as quantifiers of climate change effects, and the change of simulated or measured crop yields under different agroecological conditions.
The present case study is an attempt to estimate the sensitivity of crop production to climate change in the south-eastern European-Pannonian region by analysing the correlation between the relative changes of multi-year simulated winter wheat yields and selected agroclimatic indices for different soil types in a particular region. For these reasons, the Vojvodina region (Serbia), which is part of the Pannonian lowland, was selected as an area of interest.
MATERIALS AND METHODS
Location
The Pannonian (or Carpathian) Basin is situated in the southeastern part of Central Europe, at the boundary between Central Europe, Eastern Europe and Southeastern Europe (the Balkans). The lowlands are surrounded by the Carpathian Mountains, the Alps, the Dinarides and the Balkan mountains and extend roughly from Vienna in the northwest to Zagreb in the southwest, to Belgrade in the southeast and Satu Mare in the northeast. The rivers Danube and Tisza divide the basin roughly in half. The Vojvodina region is mostly a flat area located in the northern part of Serbia and the southern part of the Pannonian lowland [18°51′–21°33′E, 44°37′–46°11′N and 75–641 m asl (Fruska Gora mountain in the south)]. This region is the most important crop production area in Serbia. The mean annual temperature is 11 °C and mean annual precipitation is 602 mm (Mihailovic et al. Reference Mihailovic, Lalic, Arsenic, Malinovic, Milosevic and Malesevic2004).
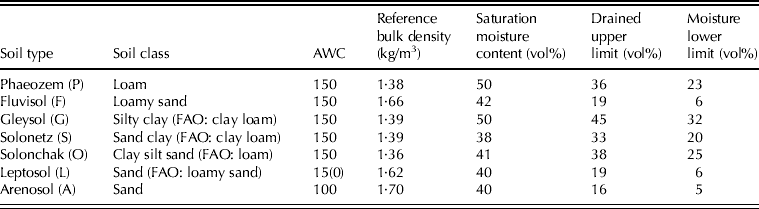
The soil map of Vojvodina (Fig. 1), according to the FAO soil classification (FAO/IIASA/ISRIC/ISSCAS/JRC 2009), indicates seven different soil types. Phaeozem is the prevailing soil type, covering 0·43 of the region's cultivated area. The soil characteristics used in the present study, such as soil class, available water content (AWC) and reference bulk density, are set following the FAO soil classification. Saturation moisture content (Table 1) is set using data from Saxton et al. (Reference Saxton, Rawls, Romberger and Papendick1986), but taking into account some local soil characteristics (Zivkovic et al. Reference Zivkovic, Nejgebauer, Tanasijevic, Miljkovic, Stojkovic and Drezgic1979) mostly related to the sand and clay content. The amount of organic and inorganic nitrogen (N), and the proportion of nitrate in the top (1/3) and middle (2/3) of the soil column up to a 1·2 m depth were used for crop model simulations. These simulations were prepared on the basis of data collected during experiments performed during the 1994–2006 growing seasons on the experimental fields of the Institute for Field and Vegetable Crops, Novi Sad, Serbia (45°15′ N, 19°50′ E, 84 m asl).
(Colour online). Soil map of the Vojvodina region (FAO/IIASA/ISRIC/ISSCAS/JRC 2009).

Soil characteristics (0·12 m reference depth, except for leptosol where it is 0·30 m)
Climate scenarios and crop model weather input data
The GCMs used in the present study were developed at: (1) the UK Hadley Centre for Climate Prediction and Research (HadCM3) (Gordon et al. Reference Gordon, Cooper, Senior, Banks, Gregory, Johns, Mitchell and Wood2000); (2) the Max-Planck Institute for Meteorology (ECHAM5) (Roeckner et al. Reference Roeckner, Bäuml, Bonaventura, Brokopf, Esch, Giorgetta, Hagemann, Kirchner, Kornblueh, Manzini, Rhodin, Schlese, Schulzweida and Tompkins2003); (3) the US National Center for Atmospheric Research (NCAR-PCM) (Washington et al. Reference Washington, Weatherly, Meehl, Semtner, Bettge, Craig, Strand, Arblaster, Wayland, James and Zhang2000); and (4) the Atmosphere Ocean Global Circulation Model (SX-G) (Gualdi et al. Reference Gualdi, Navarra, Guilyardi and Delecluse2003). The first step in an assessment of climate change impacts on agriculture is the downscaling of climate model outputs. For this purpose, either statistical or dynamical downscaling techniques are used. To synthesize the daily weather data series, the Met&Roll weather generator (Dubrovsky Reference Dubrovsky1996, Reference Dubrovsky1997) was used to statistically downscale the HadCM3, ECHAM5 and NCAR-PCM climate model outputs using the A2 scenario for greenhouse gas (GHG) emissions for two integration periods (2040 and 2080). The current state of climate change was considered by comparing climate conditions in the periods 1951–81, 1981–2005 and 1995–2005. The variability of temperature and precipitation during the spring and winter crop growing periods was calculated for 1981–2005. The expected changes in climate conditions were quantified by considering the changes of temperature and precipitation for 2040 and 2080 relative to the 1985–2005 reference period.
Crop model and crop simulation
The dynamic crop growth simulation model SIRIUS (Semenov & Porter Reference Semenov and Porter1995; Jamieson et al. Reference Jamieson, Semenov, Brooking and Francis1998) has already been calibrated and validated for the agroecological conditions of the Vojvodina region (Lalic Reference Lalic2006; Lalic et al. Reference Lalic, Pankovic, Mihailovic, Malesevic and Arsenic2007, Reference Lalic, Mihailovic, Malesevic, Mihailovic and Vojinovic-Miloradov2008, Reference Lalic, Mihailovic, Malesevic and Utset2009) and was applied in the present study to simulate the climate change impact on winter wheat yield change. The SIRIUS model calculates the biomass production from intercepted photosynthetically active radiation (PAR) and grain growth from simple partitioning rules, whereas the leaf area index (LAI) is calculated from a thermal time sub-model. Phenological development was calculated from the mainstem leaf appearance rate and final leaf number, with the latter determined by responses to daylength and vernalization. The effects of water and nitrogen (N) deficits were calculated through their influence on LAI development and radiation-use efficiency (Jamieson et al. Reference Jamieson, Semenov, Brooking and Francis1998).
The changes of winter wheat yield relative to 1985–2005 and the correlation between relative change of yield and different agroclimatic indices were calculated for six areas in the Vojvodina region, with seven different types of soils and three different CO2 concentrations (330, 550 and 1050 ppm), using the synthesized weather time series. Firstly, crop simulations were performed with climate-change effects only, i.e. impacts on yield of air temperature, precipitation and solar radiation only. The atmospheric CO2 concentration was assumed to be 330 ppm for the baseline (1985–2005) and for the expected climate. In the next step, simulations were performed supposing a CO2 concentration of 550 ppm for 2040 and 1050 ppm for 2080 according to the SRES-A2 scenario from the IPCC Third Assessment Report (Houghton et al. Reference Houghton, Ding, Griggs, Noguer, van der linden, Dai, Maskell and Johnson2001).
Agroclimatic indices such as ETa, accumulated precipitation during the growing season, number of days with water deficit, number of summer or tropical days and sum of effective temperatures above a certain threshold were calculated using the AGRICLIM model (Trnka et al. Reference Trnka, Dubrovský, Semerádová, Eitzinger, Olesen, Mozny, Hlavinka, Balek and Stepanek2008). Using daily values of meteorological elements (maximum and minimum air temperature, solar radiation, water vapour pressure or relative air humidity, wind speed), AGRICLIM calculates the following: (a) snow cover characteristics (presence, duration and start–end), (b) water balance components (ETa, ETr and soil water content), (c) temperature sums and extremes (number of days with temperature above or below a certain threshold and sum of temperatures), (d) ‘combined’ indices (drought probability and duration, and frost risk) and (e) field-related indices (e.g. number of days with suitable conditions for sowing and harvest, and growing period duration).
The selected winter wheat cultivar for the simulation study was ‘Balkan’, for which a crop model had been successfully validated in the previous study (Lalic et al. Reference Lalic, Mihailovic, Malesevic and Utset2009). In addition to soil characteristics, data related to time and number of management operations, variety characteristics and phenological dates were recorded for the selected seasons. As the middle of October is a typical time for sowing winter wheat in the Vojvodina region, 15 October was set as the time of sowing for all runs. A typical management scenario was used with no irrigation and with only three fertilizer applications: (i) before sowing (15 October) – 50 kg N/ha, (ii) at the end of winter (10 February) – 55 kg N/ha and (iii) during spring (10 April) – 40 kg N/ha.
RESULTS
Climate variability under present and future conditions in the Vojvodina region
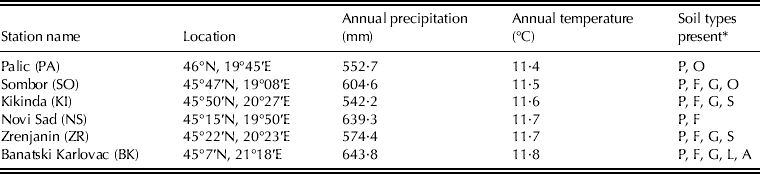
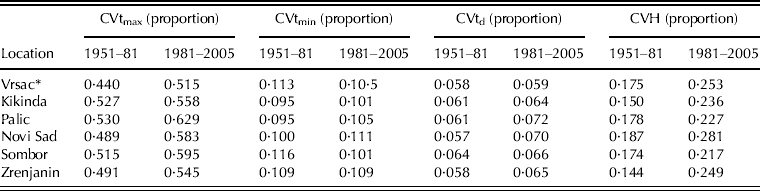
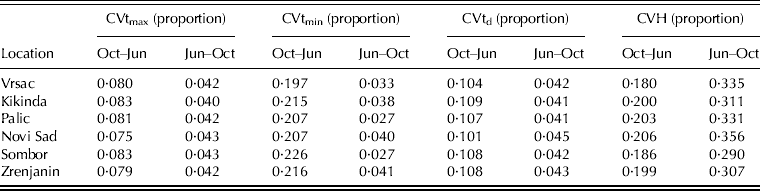
Six climatological weather stations were selected for the study (Table 2), with different soil types prevailing within the vicinity of the stations. The data cover the period 1985–2005 from weather stations located in rural areas and providing continuous daily data, including maximum and minimum temperatures, sunshine hours, precipitation, mean daily water vapour pressure and wind speed. Over the 54 years from 1951 to 2005, atmospheric warming accelerated in the Vojvodina region. Climatic conditions during the 1951–81 period were quite different from those during the 1981–2005 and 1995–2005 periods (Fig. 2). In particular, the precipitation records during the 1995–2005 period indicate positive and negative trends, with a strong temperature gradient in the SE–NW direction. One possible explanation for the occurrence of these trends is the increased number of extreme weather events during this period. For example, in Novi Sad in 1999, due to a few extreme precipitation events, the annual precipitation was 50% above the long-term average, whereas in 2000 the annual precipitation was 50% below the long-term average due to an extremely dry spring and summer (the very strong trend of precipitation in Fig. 2(f)). This precipitation regime led to increased variability (Table 3) as a most pronounced characteristic of climate in the Vojvodina region during the 1981–2005 period, especially for precipitation. However, climate variability during the vegetation period of the winter and spring crops is more emphasized (Table 4). During the winter crop growing season, warmer winters were accompanied by higher temperature variability, particularly in the case of minimum temperatures. The high variability of precipitation during the April–October period leads to higher variability of crop water resources (i.e. soil water content), producing non-favourable conditions for spring crop growth.
(Colour online). Trend of annual temperature (a, c and e) (°C per decade) and annual precipitation (b, d and f) (mm per decade) in the Vojvodina region in the different periods. BK, Banatski Karlovac; KI, Kikinda; NS, Novi Sad; PA, Palic; SO, Sombor; ZR, Zrenjanin.
Geographical position and climate characteristics (1985–2005) of selected locations with indicated soil types for each station area
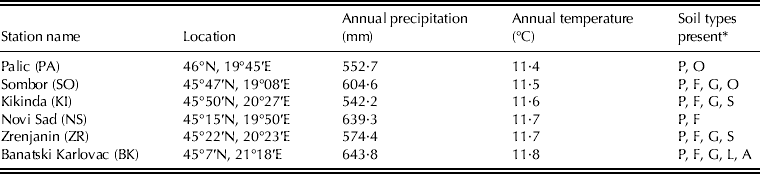
* See Table 1 for explanation of codes
Coefficient of variability of maximum (CVtmax), minimum (CVtmin) and average (CVtd) annual air temperature and precipitation (CVH) in the Vojvodina region for 1951–81 and 1981–2005 periods (Sokal & Braumann Reference Sokal and Braumann1980)
Coefficient of variability of maximum (CVtmax), minimum (CVtmin) and average (CVtd) air temperature and precipitation (CVH) in the Vojvodina region for winter and spring crop vegetation during the 1981–2005 period (Sokal & Braumann Reference Sokal and Braumann1980)
Downscaling climate scenarios
Among the six GHG emission scenarios presented in the IPCC Third Assessment Report for the coming century (Houghton et al. Reference Houghton, Ding, Griggs, Noguer, van der linden, Dai, Maskell and Johnson2001), SRES-A2 was chosen because it is the ‘worst’ emission scenario, and consequently, the strongest climate change signal is expected. The three GCMs were used for two integration periods (2040 and 2080).
The GCMs used were HadCM3 (H), ECHAM5 (M) and NCAR-PCM (N). For each climate model and integration period, three characters are used in the text, the first of which indicates the GCM and the other two the integration period (45=integration period 2040; 85=integration period 2080, giving, e.g. H45, M85, etc.). In all GCMs, the change in global mean temperature was estimated using the middle (2·6 °C) climate sensitivity.
The observed daily weather data for the reference period 1985–2005 were used to train the Met&Roll weather generator. The parameters of the weather generator, which were derived from the reference weather series, were perturbed using the GCM outputs. For each site, a 99-year stochastic weather series of the daily sum of global radiation and precipitation, maximum and minimum temperatures, daily means of water vapour pressure and wind speed were prepared to represent the future climate conditions.
From all GCMs used in the study (Fig. 3), it can be seen that the annual temperature in the Vojvodina region is expected to increase by 1·3 °C by 2040 and 2·4 °C by 2080. Accumulated temperatures above 0 °C in the Vojvodina region during the winter wheat vegetation period (October–June) are expected to be 8·6–12% higher by 2040 and 18–26% higher by 2080, relative to the reference period.
(Colour online). Relative change of accumulated temperatures above 0 °C (growing degree days) in the Vojvodina region during the winter wheat vegetation period (15 October–30 June) for 2040 and 2080 against the 1985–2005 reference period. BK, Banatski Karlovac; KI, Kikinda; NS, Novi Sad; PA, Palic; SO, Sombor; ZR, Zrenjanin.
A detailed analysis of GCM outputs led to the conclusion that the annual precipitation is expected to decrease only slightly by 2040, between 1·9 mm (H) and 4·3 mm (M), with significant amplitude, particularly during the spring crop vegetation period (April–October). As the most significant decrease of precipitation is expected during the summer, it is no surprise that the accumulated precipitation during the winter wheat vegetation period (Fig. 4) is expected to increase (5% in Kikinda according to H45) and decrease (5% in Novi Sad according to N85) with non-uniform spatial and temporal distribution and increased number of crop drying days.
(Colour online). Relative change of accumulated precipitation in the Vojvodina region during the winter wheat vegetation period (15 October–30 June) for 2040 and 2080 against the 1985–2005 reference period. BK, Banatski Karlovac; KI, Kikinda; NS, Novi Sad; PA, Palic; SO, Sombor; ZR, Zrenjanin.
The projected drought conditions during the winter wheat vegetation period were considered using the relative change of potential evapotranspiration (PET) (Fig. 5), calculated using Turck's formula (Vucic Reference Vucic1976). According to all GCMs, an increase of PET can be expected in the whole region varying from 1–9% (by 2040) to 7–15% (by 2080), but with relatively uniform spatial distribution. High temperatures and very strong relative PET changes should strongly affect soil moisture conditions and the future moisture stress of plants.
(Colour online). Relative change of PET in the Vojvodina region during the winter wheat vegetation period (15 October–30 June) for 2040 and 2080 against the 1985–2005 reference period. BK, Banatski Karlovac; KI, Kikinda; NS, Novi Sad; PA, Palic; SO, Sombor; ZR, Zrenjanin.
Crop simulation results
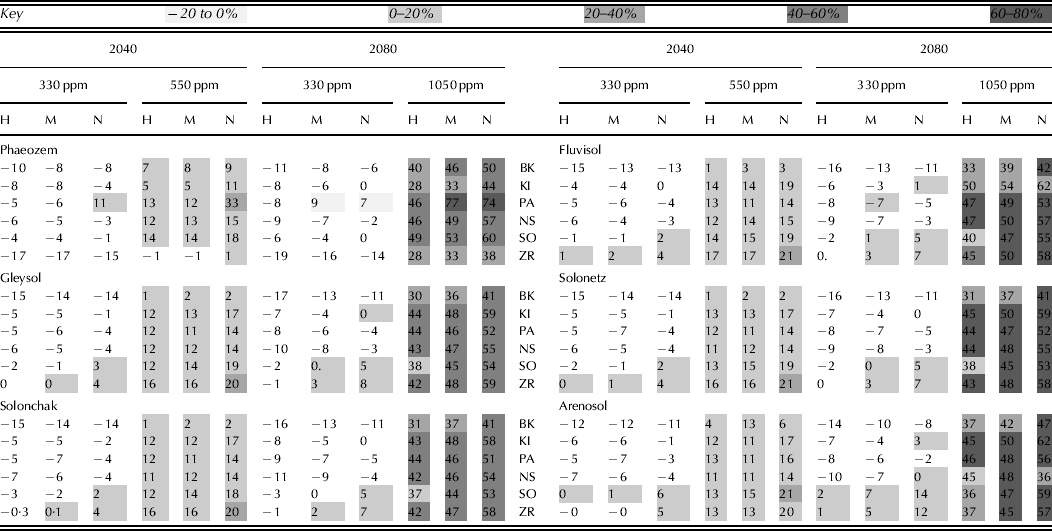
To quantify the crop response to climate and soil-type changes under different CO2 concentrations, the SIRIUS crop model was used to calculate winter wheat yield. The relative change of crop yield for different climate conditions, soil types and CO2 concentration is depicted in Table 5. If the obtained results are pursued, the expected changes of winter wheat yield growing on phaeozem soils vary within the range of −19% (H85 at Zrenjanin) with a 330 ppm CO2 concentration to 77% (M85 at Palic) with a 1050 ppm CO2 concentration. Based on these results, it can be concluded that an increase in the amount of CO2 can have a more pronounced positive impact on yield than an unfavourable temperature and precipitation regime.
Relative change of winter wheat yield in the Vojvodina region for 2040 and 2080 against the 1985–2005 reference period
H, HadCM3; M, ECHAM5; N, NCAR-PCM; BK, Banatski Karlovac; KI, Kikinder; PA, Palic; NS, Novi Sad; SO, Sombor; ZR, Zrenjanin.
Calculated correlations
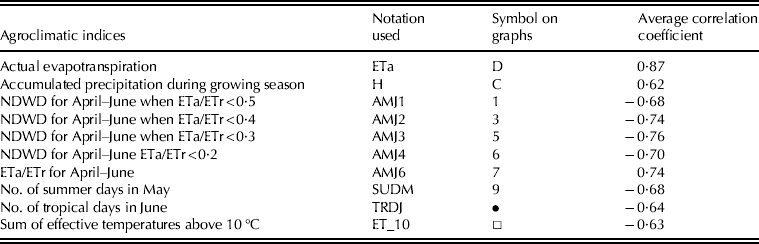
To identify the most important agroclimatic indices best describing the impact of climate change on yield in the Pannonian lowland climate conditions, correlations between yield and 37 climatic indices were calculated using daily weather data observed during the 1985–2005 reference period and data generated from the HadCM3 climate model outputs. The AGRICLIM software was used to calculate 29 of the indices. The remaining indices were taken either from SIRIUS crop model outputs (ETa and maximum water deficit (def)) or were calculated using the standard procedure for their calculation (maximum, minimum and mean daily air temperature, sum of temperature above 0 °C, daily sum of global radiation and accumulated precipitation for winter wheat vegetation period). Among all tested indices, those ten for which the mean correlation coefficient (calculated using observed data and averaged over all stations, Table 6) is above 0·60 for each soil type were selected. Coefficients of correlation between agroclimatic indices and winter wheat yield were calculated using the observed and generated data, for different soil types and CO2 concentrations (Fig. 6). The results obtained using the HadCM3 model outputs were chosen because there was no significant difference between the correlation coefficients calculated using different climate models for 2040 and 2080. Among all the correlations obtained for different CO2 concentrations and integration periods, only 550 ppm for 2040 and 1050 ppm for 2080 were chosen, because they represent extreme but realistic cases.
(Colour online). Correlation coefficients between agroclimatic indices and winter wheat yield in the Vojvodina region calculated using daily weather data observed 1985–2005 reference period (black) and data generated from HadCM3 climate model outputs (red) for 2040 and 2080. Codes used are explained in Table 6.
Correlation coefficients between agroclimatic indices and winter wheat yield, averaged for all stations and soil types in the Vojvodina region in the 1985–2005 reference period (NDWD, number of days with water deficit)
According to results obtained for the whole region and all soil types, indices describing the number of days with water and temperature stress as well as accumulated precipitation and ETa during the growing season were the most important. High-positive correlations between yield and ETa, H and AMJ6 (Table 6 explains the codes used) were observed (Fig. 6), whereas high-negative correlations were noted for AMJ1, AMJ2, AMJ3, AMJ4, summer days in May (SUDM) and tropical days in June (TRDJ). However, it should be borne in mind that indices such as SUDM and TRDJ are indicators of extreme weather events whose impacts are extremely difficult to quantify. For this reason, the SUDM and TRDJ indices can be useful indicators in future assessment studies related to the impacts of extreme weather events on crop yield.
The influence of soil type on crop yield sensitivity to atmospheric conditions (described by certain indices) showed that the coefficients of correlation between the relative change of yield and agrometeorological indices obtained using observed data were significantly higher (in absolute value) than those obtained using generated data for all soil types (Fig. 6). At all locations, a high correlation and a clear distinction among indices producing positive or negative correlations was observed. The lowest values of correlation coefficients, found at the Sombor and Zrenjanin locations, are obtained for leptosols. For the other soil types and locations, these differences vary within the range of 0·01. A possible reason for this deviation is that, in contrast to all other soil types, the characteristic depth and soil properties of leptosols are defined 0·30 m below the surface.
DISCUSSION
Crop yield is a result of all processes that describe the plant–environment interaction. Climate change is a complex phenomenon affecting crop yield in different ways; from changes in the values of normal temperatures and mean precipitation and the frequency of extreme weather events to the structure and content of soil. Therefore, this complex phenomenon affects plant–environment interactions and changes crop yield. Demand for an assessment of the magnitude of this change is understandable, but the ability to simulate the climate change impact on crop yield is significantly restricted by the ability of crop and climate models to simulate all significant physical and physiological processes. Therefore, all the results of the present paper should be interpreted while keeping these facts in mind.
According to the results presented, the most pronounced decrease of yield for all soil types can be expected in the southwestern (Novi Sad) and southeastern (Banatski Karlovac) parts of the Vojvodina region if the impact of CO2 is not explicitly considered. One of the main causes of this effect is the supposed significant increase of accumulated temperature during the winter wheat growing season. That is, higher temperatures shorten the growing period of crops, leading to a reduction in total ETa and thus restricting crop yields. Increasing water shortage and drought can also reduce ETa and related grain yield due to decreased biomass accumulation or other negative effects on crop physiology, such as grain filling or reduced photosynthetically active leaf area.
However, it is not realistic to suppose that the CO2 concentration will remain the same as in the base period. According to Ellsworth et al. (Reference Ellsworth, Oren, Huang, Phillips and Hendrey1995), a two-fold increase in atmospheric CO2 concentration would lead to a positive yield of c. 0–30% for winter wheat depending on environmental conditions. Therefore, the results obtained in the present paper for 2040 with a 550 ppm CO2 concentration in the atmosphere reflect realistically the yield response of the simulated cultivar to CO2 increase. The impact of soil type on the relative change of yield can be identified particularly for phaeozem and fluvisol, in which case slightly higher changes of yield can be expected.
The agroclimatic indices best describing the response of winter wheat yield to changing climate are (a) the ratio of ETa and ETr during the period April–June, (b) the number of days with significant water and heat stress during the same period and (c) ETa and accumulated precipitation during the growing season.
One interesting feature of the present results is that correlations obtained using observed weather data are commonly higher than those obtained using generated data, whereas the 2040 correlations are higher than those for 2080. One possible reason for the low correlations (positive or negative) can be found in the time of appearance and intensity of extreme weather events. According to the above results, the variability of temperature and precipitation during the vegetation period of winter and summer crops (also related strongly to extreme weather events), is already one of the most pronounced features of the recent climate in the Vojvodina region. If all climate models and assessment studies are pursued, more frequent appearances of extreme weather events will be a common characteristic of future climate (Milly et al. Reference Milly, Wetherald, Dunne and Delworth2002; Palmer & Raisanen Reference Palmer and Raisanen2002). Supporting this assumption is the fact that in all generated weather series the number of days with extreme temperatures in the period February–June in 2040 is higher than in the same period in 2080. However, the ability of models to reproduce crop responses to extreme weather events is still under discussion. It implies that the absence of high correlations between indices describing actual weather conditions and crop yield (in cases when this correlation should occur) are due to certain meteorological elements being important for yield formation (e.g. accumulated temperatures during the growing season) and is affected strongly by extreme events.
The conclusions from this work are that high climatic variability is a common characteristic of south-eastern European regions due to the influence of continental climate. In the southern part of the Pannonian lowland, high amplitudes of precipitation, especially during the vegetation period, generate unfavourable conditions for crop growth. However, because the annual amount of precipitation decreases very slowly (or even increases in some areas), there is a slight ‘window of opportunity’ for adaptation measures focusing on the minimization of evapotranspiration. In the case of the Vojvodina region, the yield changes obtained were the result of significantly higher accumulated temperatures, non-significant relative changes of accumulated precipitation and a significant increase of PET. At Sombor and Zrenjanin, these changes are less pronounced for leptosols, but for all other soil types and locations the differences are negligible. Based on the evidence provided in the present study, the best indicators of climate change impacts on winter wheat are the ETa and precipitation amounts and the number of dry days and days with extreme temperatures during spring.
If the expected non-significant decrease (or even increase) of precipitation during the October–June period appears, adaptation measures against evapotranspiration (e.g. reducing wind speed by planting hedgerows, increasing conductance by mulching, reducing available energy by shading) can significantly reduce yield losses. Additional adaptation measures such as (a) crop rotation (reducing spring crops and increasing winter crops for better use of soil water), (b) reducing soil cultivation and improving soil structure (increasing soil water storage capacity), (c) adaptation of the crop growing period (changing sowing date), (d) employing protection measures against soil erosion, (e) land use change and (f) improving soil functions and soil water storage capacity can reduce plant vulnerability to a changing climate without irrigation. However, the impact of damaging factors other than heat and drought, such as hail, tropospheric ozone and heavy precipitation, are not considered in the present study.
The research work described in the present paper was undertaken as part of the project ‘Studying climate change and its influence on the environment: impacts, adaptation and mitigation’ (43007) financed by the Ministry of Education and Science of the Republic of Serbia within the framework of integrated and interdisciplinary research for the period 2011–2014. The climate change scenarios were prepared within the framework of project IAA300420806 sponsored by the Grant Agency of the Academy of Sciences of the Czech Republic.