1. Introduction
When rigid spheres impinge onto the surface of a liquid, characteristic and well-known splash patterns can be formed during their impact, and complex subsurface flow structures develop in their wake once they have become fully submerged in the fluid. The fluid dynamics associated with such projectiles entering a liquid have captured the imagination of scientists and engineers ever since the pioneering studies of Worthington & Cole (Reference Worthington and Cole1897, Reference Worthington and Cole1900) and Worthington (Reference Worthington1908) who succeeded in obtaining the first high-speed photographs of the impact dynamics associated with liquid droplets after developing an ingenious experimental arrangement for the rudimentary photographic equipment available to them at the end of the 19th century. Modern state-of-the art visualizations showing details of the developing flow patterns, and references to many of the existing, relevant publications on the subject, are contained in, for instance, Thoroddsen et al. (Reference Thoroddsen, Etoh, Takehara and Takano2004), Truscott & Techet (Reference Truscott and Techet2006, Reference Truscott and Techet2009a ,Reference Truscott and Techet b ), Aristoff & Bush (Reference Aristoff and Bush2009), Thoroddsen (Reference Thoroddsen2012) or Truscott, Epps & Belden (Reference Truscott, Epps and Belden2014).
Here we study aspects of the cavity dynamics developing when falling spheres enter a stratified liquid system comprising a thin layer of oil resting above a deep pool of water. This issue was briefly addressed by Bell (Reference Bell1924) but does not seem to have been revisited since then. In the context of our study we initially conducted experiments corresponding to some of those in Truscott & Techet (Reference Truscott and Techet2009a ) on cavity formation behind spheres upon their entry into a single-fluid system. It will be seen that the comparison of our experimental data for the single-phase system with the corresponding data in Truscott & Techet (Reference Truscott and Techet2009a ) yields a very good quantitative agreement. However, we also find that the cavity dynamics become substantially modified for the two-layer system when the spheres have to descend through the thin layer of oil prior to submerging into the water residing below.
2. The experimental study
For our experiments we used a stratified system of immiscible fluids where a shallow layer of oil rested atop a deep pool of water prior to the impact of the free-falling sphere. Unless otherwise stated explicitly, the spheres used for all results discussed here were Chrome AISI 52100 stainless steel ball bearings with diameters
 $2.9~\text{mm}\leqslant D\leqslant 14.3$
mm. The spheres were released from heights between about 0.1 m and 1.8 m to acquire impact velocities
 $1.4~\text{m}~\text{s}^{-1}\leqslant u_{i}\leqslant 6~\text{m}~\text{s}^{-1}$
. These ranges for the sphere diameter and the impact velocity yield Froude numbers
 $\mathit{Fr}=u_{i}/\sqrt{gD}$
(where
 $g$
is gravitational acceleration) in the range
 $3.7\leqslant \mathit{Fr}\leqslant 35.6$
.
In order to obtain well-defined initial starting conditions the spheres were held in place at their release position by means of a simple electromagnetic mechanism prior to their descent. Moreover, to ensure reproducible initial surface conditions the spheres were immersed in acetone, and then dried using a clean paper tissue, prior to each run of the experiment to exclude the effects of surface contamination on the cavity dynamics.
We used two different types of oil for the oil layer resting above the water. The first type was sunflower oil with a dynamic viscosity of
 ${\it\mu}=50$
cP and density
 ${\it\rho}=920~\text{kg}~\text{m}^{-3}$
, corresponding to a kinematic viscosity of
 ${\it\nu}=54.4~\text{mm}^{2}~\text{s}^{-1}$
. The second liquid was silicone oil with a substantially higher dynamic viscosity of
 ${\it\mu}=970$
cP and density
 ${\it\rho}=970$
kg m
 $^{-3}$
, i.e. kinematic viscosity
 ${\it\nu}=1000~\text{mm}^{2}~\text{s}^{-1}$
. Together with the values for the ranges of sphere diameter and impact velocity one can calculate Reynolds number values
 $\mathit{Re}=u_{i}D/{\it\nu}$
associated with the motion of the oil-coated sphere immediately after it has fully submerged into the pool of water underneath the oil layer. If one bases the Reynolds number on the kinematic viscosity
 ${\it\nu}=1~\text{mm}^{2}~\text{s}^{-1}$
of the ambient water one obtains
 $4060\leqslant \mathit{Re}\leqslant 85\,800$
and one finds values
 $4\leqslant \mathit{Re}\leqslant 1577$
if the values of the viscosities of the oils are used instead.
To facilitate a comprehensive evaluation of the present experiments in the context of other studies (e.g. Aristoff & Bush Reference Aristoff and Bush2009; Mansoor et al.
Reference Mansoor, Marston, Vakarelski and Thoroddsen2014) we estimate the minimum and maximum values for the Weber number,
 $\mathit{We}={\it\rho}u_{i}^{2}R/{\it\sigma}$
, and the Bond number,
 $\mathit{Bo}={\rm\Delta}{\it\rho}gR^{2}/{\it\sigma}$
. We base these estimates on the maximum possible value of
 ${\it\sigma}$
relevant to the system, this is given by the surface tension of water at room temperature,
 ${\it\sigma}=72.8~\text{mN}~\text{m}^{-1}$
. Moreover,
 ${\rm\Delta}{\it\rho}\approx 1000$
kg m
 $^{-3}$
represents the magnitude of the density difference between the ambient liquids and the air filling the cavity in the wake of the spheres. Note also that we have used the sphere radius,
 $R=D/2$
in the definitions of
 $\mathit{We}$
and
 $\mathit{Bo}$
whereas our definitions of
 $\mathit{Re}$
and
 $\mathit{Fr}$
are based on the sphere diameter. This choice appeared sensible because we will directly compare some of our quantitative data to the studies of Truscott & Techet (Reference Truscott and Techet2009a
), who used
 $D$
in their definitions of
 $\mathit{Re}$
and
 $\mathit{Fr}$
, but it will also become necessary to evaluate aspects of our discussions in the wider context of other studies, such as Aristoff & Bush (Reference Aristoff and Bush2009) or Mansoor et al. (Reference Mansoor, Marston, Vakarelski and Thoroddsen2014), who used
 $R$
for their definitions
 $\mathit{We}$
and
 $\mathit{Bo}$
. Together with the relevant values for the impact velocity,
 $u_{i}$
, we find
 $39\leqslant \mathit{We}\leqslant 3536$
and
 $0.28\leqslant \mathit{Bo}\leqslant 6.9$
; but note that these values are probably underestimates since they are based on the surface tension of the water only.
The experiments were filmed with a high-speed camera (Phantom 5.2) at a frame rate of up to 2900 frames per second. Throughout the experiments the room temperature was kept constant at 21 °C to minimize temperature-induced viscosity variations.
The depth of the oil layer was varied between
 $5~\text{mm}\leqslant d\leqslant 15$
mm in thickness. Hence, the ratio of sphere diameter and depth of the oil layer was in the range
 $0.19\leqslant D/d\leqslant 2.86$
. The minimum layer thickness of 5 mm was close to the critical depth for which a uniform coverage of the water surface could be established without surface tension resulting in disconnected oil patches floating on the water surface. The purpose of the oil atop the water was to cover the spheres with an oil layer during their passage through the layer and immediately prior to their entry into the water underneath. In the context of practical applications, such oil layers can be used to calm water waves (see Lucassen-Reynders & Lucassen Reference Lucassen-Reynders and Lucassen1970) and help to avoid, or reduce, undesired splashing wherever relevant.
Cavity formation behind a sphere in pure sunflower oil for
 $D=6$
mm,
 $u_{i}=3.1$
m s
 $^{-1}$
and
 $\mathit{Re}=343$
. Each two successive images are separated by
 ${\rm\Delta}t=10$
ms.

Cavity formation behind sphere (
 $D=6$
mm,
 $u_{i}=3.7$
m s
 $^{-1}$
,
 $\mathit{Re}=22\,000$
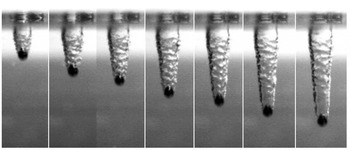
) 8, 10, 12, 14, 16, 18, 20 ms after entering water with a 5 mm layer of sunflower oil floating on its surface.

Cavity formation behind sphere (
 $D=10$
mm,
 $u_{i}=5.24$
m s
 $^{-1}$
,
 $\mathit{Re}=52\,410$
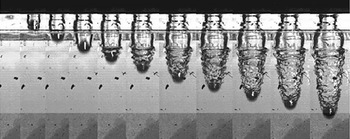
) following its entry into water with a 12.5 mm layer of silicone oil floating on the surface. The time difference between each image is 2 ms.

3. Qualitative observations
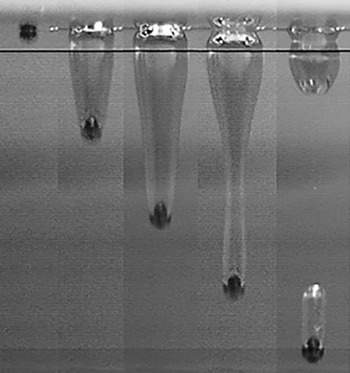
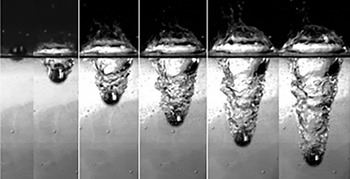
When the spheres entered a homogeneous environment of sunflower oil the walls of the cavities were observed to be smooth, as is illustrated in figure 1. This observation is consistent with the results of other authors. This can be seen, for instance, by reference to the photographs contained in numerous previous publications (see e.g. May Reference May1952; Truscott & Techet Reference Truscott and Techet2006; Duclaux et al. Reference Duclaux, Caillé, Duez, Ybert, Bocquet and Clanet2007; Aristoff & Bush Reference Aristoff and Bush2009; Truscott & Techet Reference Truscott and Techet2009a ,Reference Truscott and Techet b ; Truscott, Epps & Techet Reference Truscott, Epps and Techet2012; Truscott et al. Reference Truscott, Epps and Belden2014) for water and Reynolds number up to the order of several hundred thousand or for silicone oil and Reynolds numbers up to around 100 in Le Goff, Quéré & Clanet (Reference Le Goff, Quéré and Clanet2013). However, our observations have revealed that the formation and appearance of the air cavity is substantially modified when the sphere passes through the layer of oil before entering the water underneath. One striking difference being that the boundary between the air cavity and the ambient liquid is no longer smooth when the sphere is covered with oil but that it develops wave-like instability patterns as illustrated in the photographs in figures 2 and 3. It was observed that the wave patterns became more pronounced, more regular and well-defined for increasing dynamic viscosities of the oil. Note that we have also conducted some test runs for two-layer systems of miscible liquids, methanol above water, for which we observed smooth cavity walls similar to figure 1.
The characteristic length scales, wavelength
 ${\it\lambda}$
and ripple-onset length
 $y_{r}$
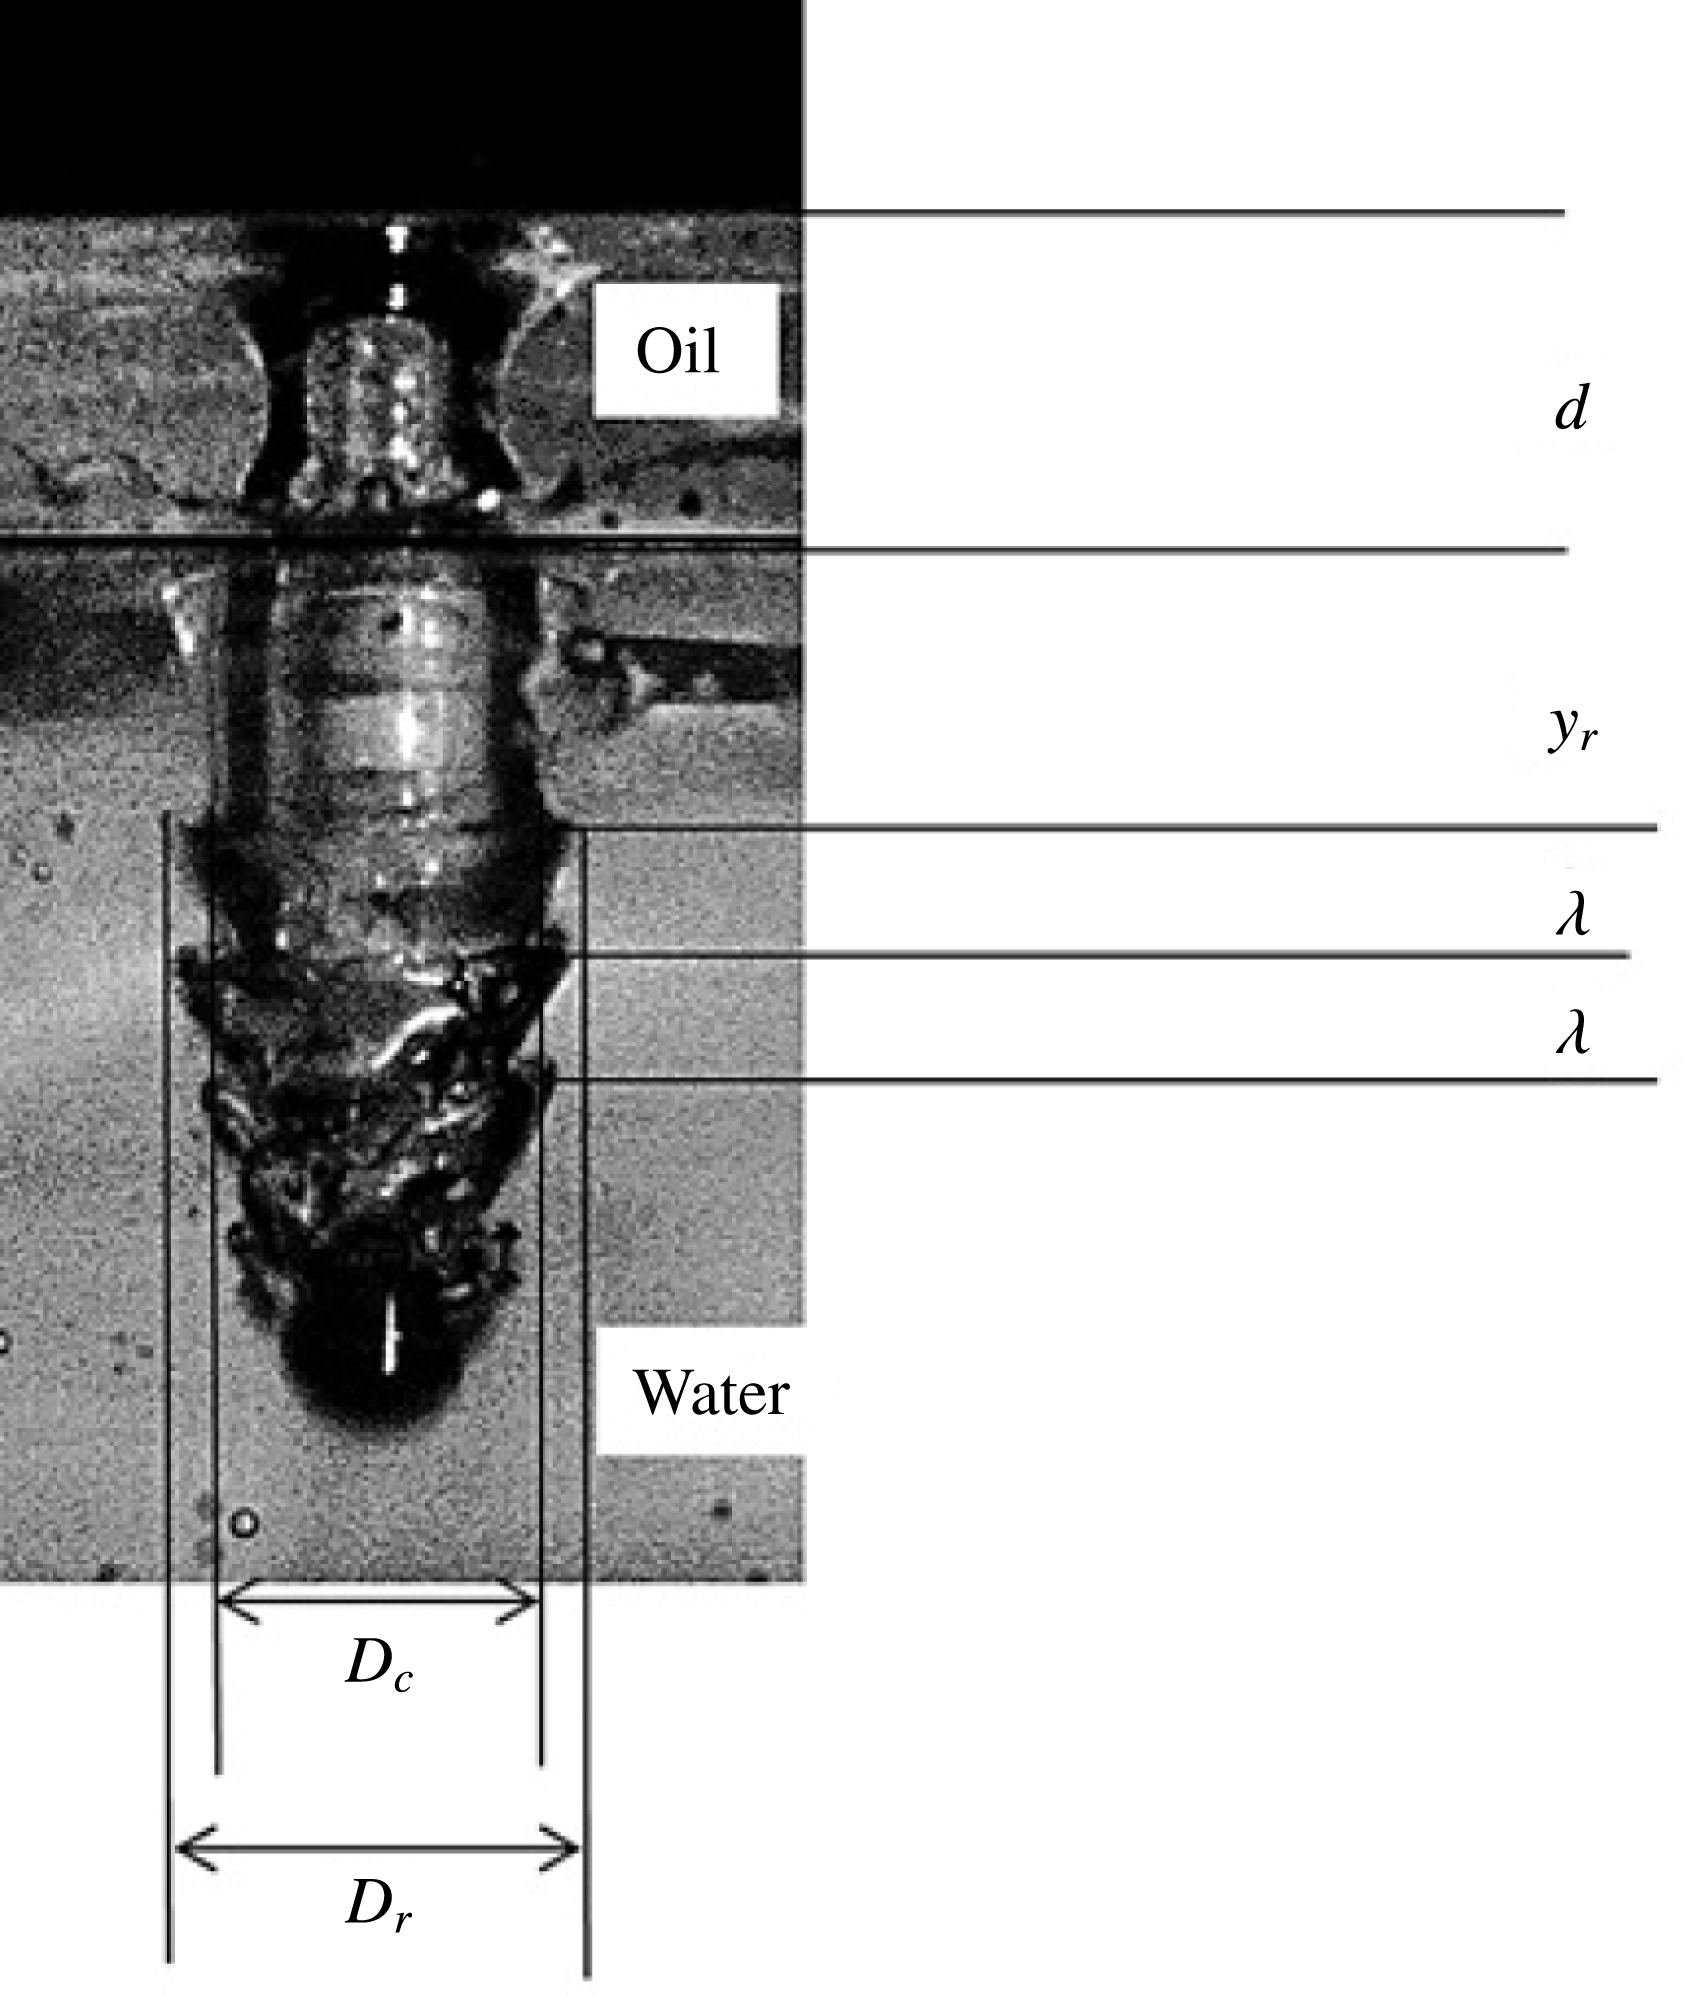
. The photo shows ripples on the cavity wall for a sphere of diameter
 $D=8$
mm with impact velocity
 $u_{i}=3.43$
m s
 $^{-1}$
that has submerged into the pool of water through a layer of the high-viscosity silicone oil of thickness
 $d=12.5$
mm. The Reynolds number associate with the sphere impact, based on the kinematic viscosity of water, is
 $\mathit{Re}=27\,450$
. See supplementary movie available at http://dx.doi.org/10.1017/jfm.2016.10.

Figure 4 illustrates the characteristic length scales associated with the rippling instability that were studied here in detail for the two-layer systems. The scales are the ripple wavelength,
 ${\it\lambda}$
; the depth
 $y_{r}$
below the oil–water interface where ripples first appeared and the ripple amplitude
 ${\it\gamma}=(D_{r}-D_{c})/2$
. The photo shown in figure 4 is for a sphere which descended through the higher-viscosity silicone oil used in our experiments where the ripple patterns were more well-defined than for the lower-viscosity sunflower oil. Note moreover, from a comparison of figure 4 with figure 3, that the initially well-developed ripple pattern becomes increasingly less well-defined as the sphere descends further downwards within the ambient water. For the quantitative analysis of the instability it was usually possible to obtain reliable data from the first three to five well-developed ripples.
4. Cavity collapse
4.1. Deep-seal time and deep-seal depth
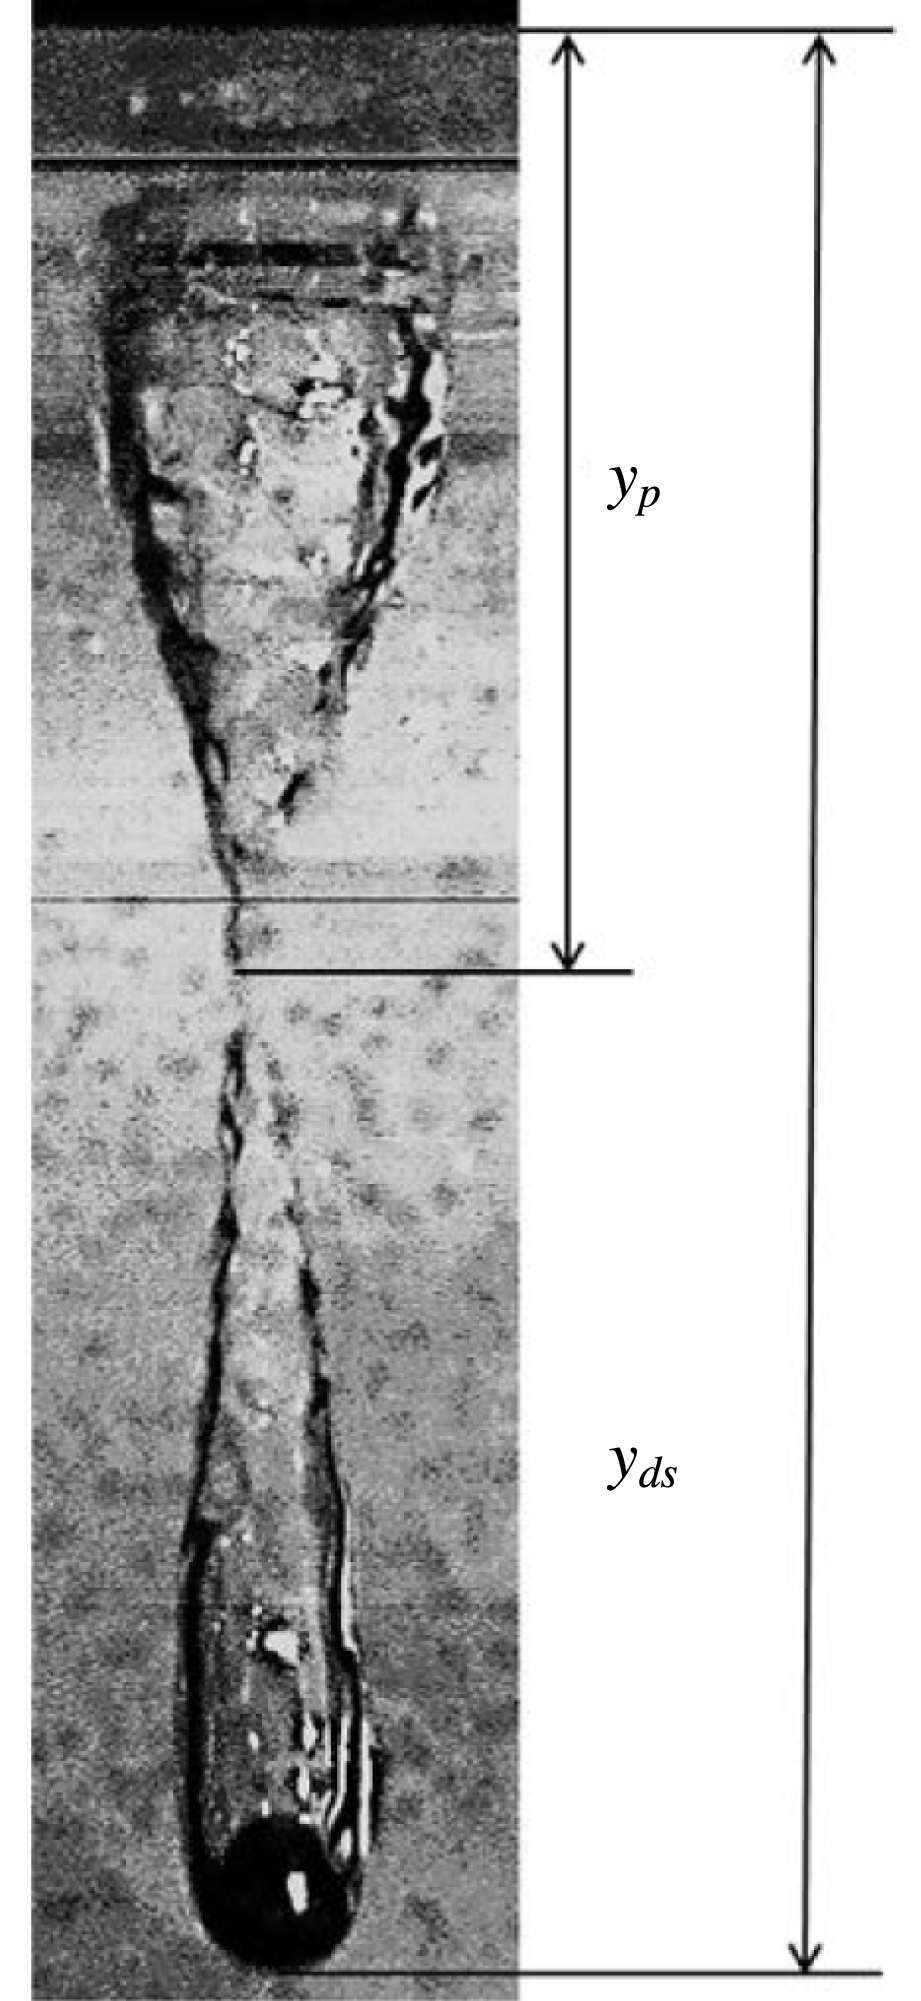
The dynamics of the cavity formation for spheres entering a homogeneous liquid are closely associated with a process commonly referred to as deep seal: this is described in detail for instance in Aristoff & Bush (Reference Aristoff and Bush2009) and Gekle et al. (Reference Gekle, Gordillo, van der Meer and Lohse2009). Our experiments have revealed that deep seal also exists in qualitatively similar form for sphere entry into our stratified two-layer system and a photograph illustrating the nature of the phenomenon is shown in figure 5. During deep seal the cavity in the wake of the sphere splits into two separate, smaller cavities at a certain depth below the liquid surface. In the remainder the depth
 $y_{ds}$
indicated in figure 5 is referred to as deep-seal depth while
 $y_{p}$
is referred to as pinch-off depth. The time interval between the instant when the sphere impinges on the liquid surface and the instant at which deep seal occurs is referred to as the deep-seal time,
 $t_{ds}$
.
In order to evaluate our current experiments in the context of studies conducted by other authors we have initially investigated the deep-seal time for the entry of spheres into a homogeneous liquid medium. Thereafter we have extended our study to obtain corresponding data for the entry of spheres into a stratified two-layer oil–water system.
Truscott & Techet (Reference Truscott and Techet2009a
) investigated the non-dimensional deep-seal depth,
 $y_{ds}^{\ast }=y_{ds}/D$
, and the associated non-dimensional deep-seal time,
 $t_{ds}^{\ast }=u_{i}t_{ds}/D$
as a function of the Froude number,
 $\mathit{Fr}$
. Their data obtained for a single-layer, i.e. homogeneous, water system are compared to our corresponding current results for the homogeneous sunflower oil and the stratified two-layer system of sunflower oil above water in figures 6–8.
Deep seal: the process whereby the cavity splits in two at a certain depth under the surface. The photo shown is for a layer of sunflower oil atop water and values
 $D=8$
mm,
 $u_{i}=2.43$
m s
 $^{-1}$
,
 $\mathit{Re}=19\,440$
.

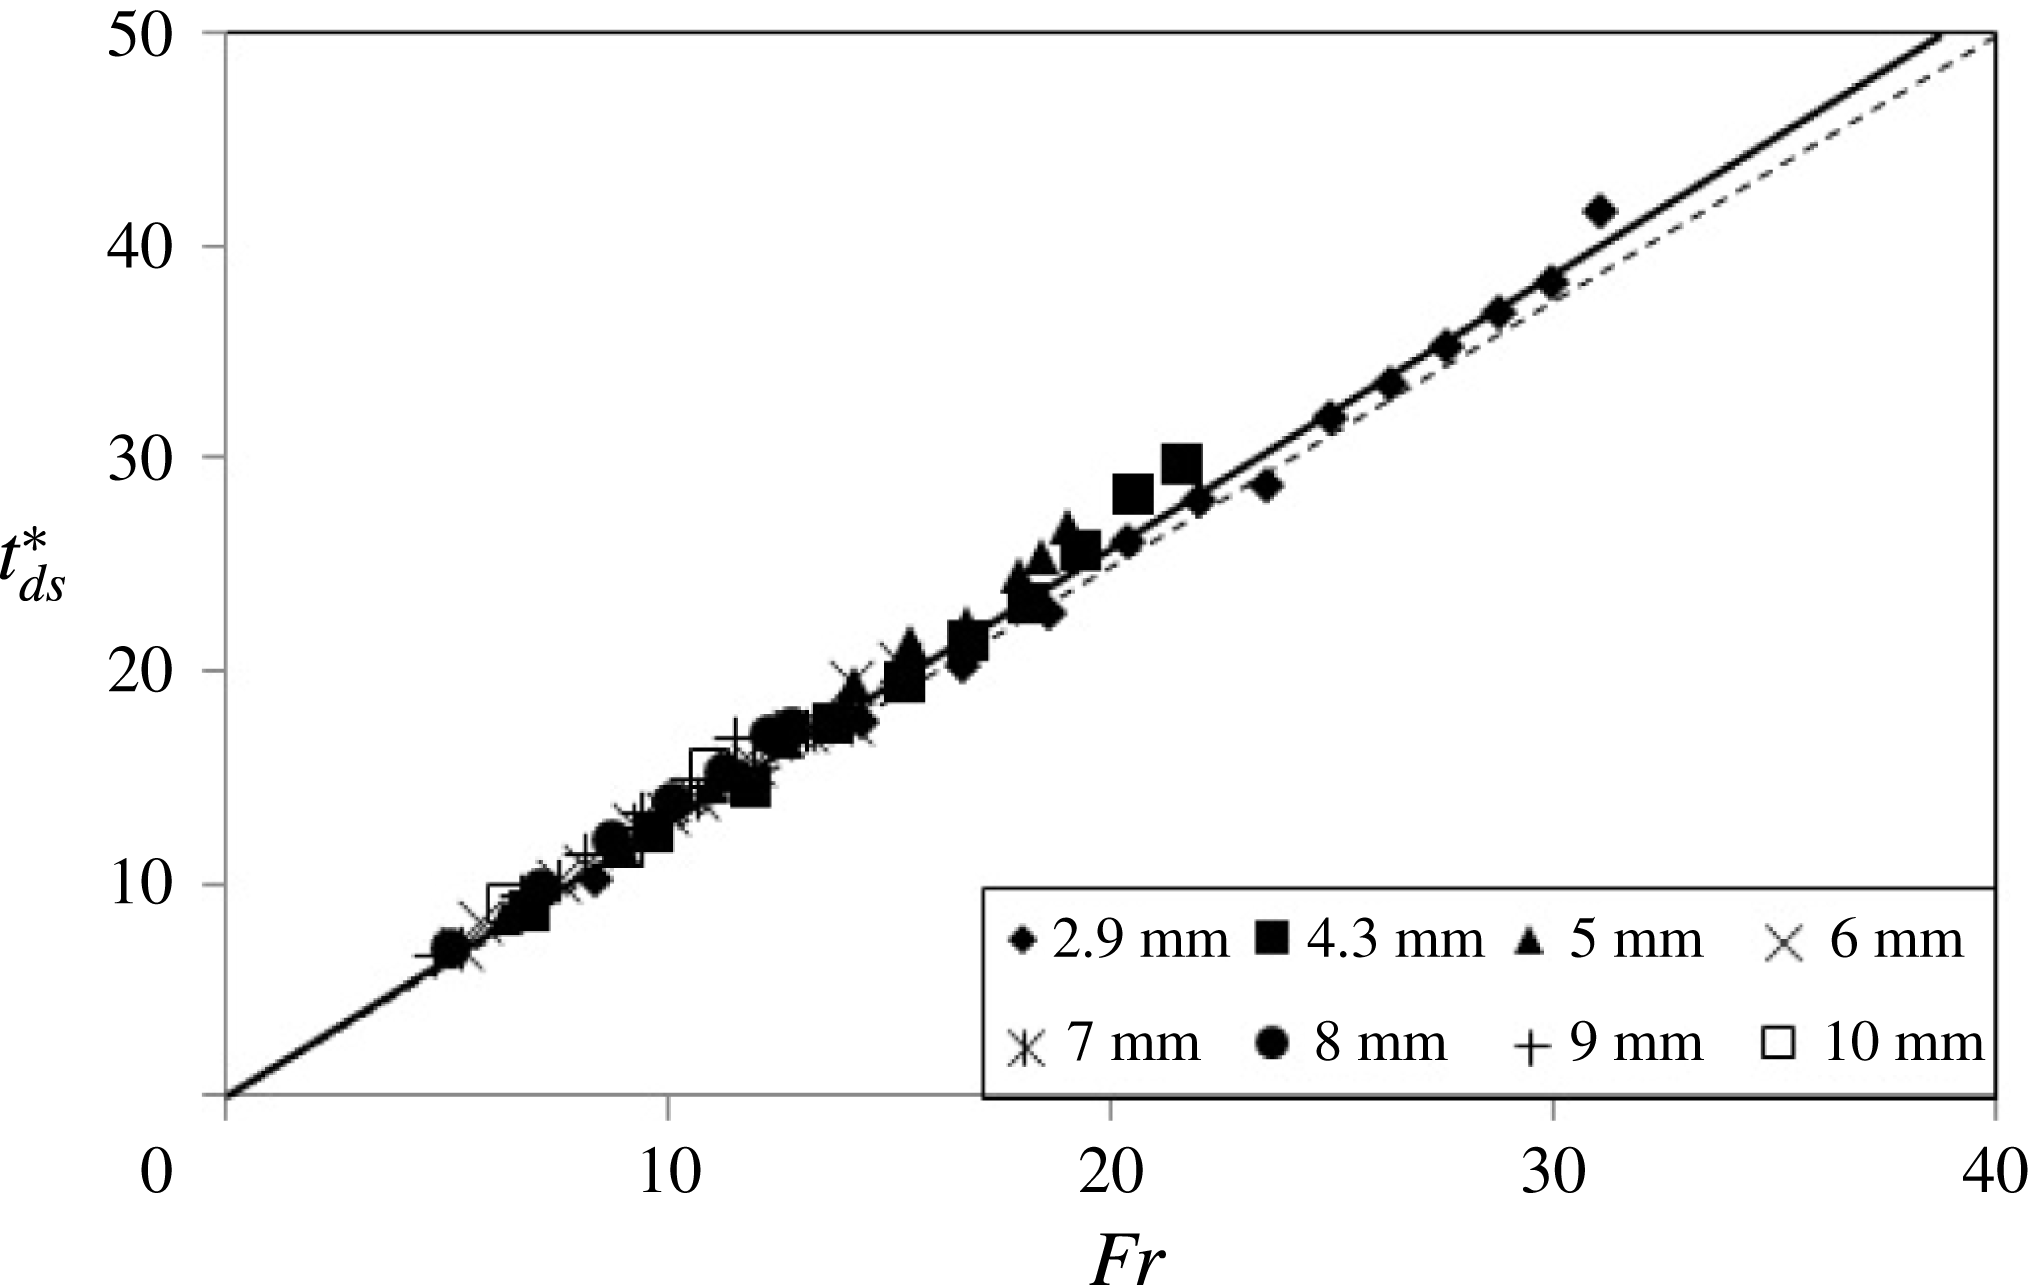
Figure 6 displays the comparison for the non-dimensional deep-seal time
 $t_{ds}^{\ast }$
. The figure reveals that we have been able to reproduce the result of Truscott & Techet (Reference Truscott and Techet2009a
) for the single-layer system with very high accuracy. The gradients
 $k$
of the linear least-squares fits
 $t_{ds}^{\ast }=k\mathit{Fr}$
in figure 6 are
 $k=1.25$
for the data for water of Truscott & Techet (Reference Truscott and Techet2009a
) while we obtained
 $k=1.27$
for our sunflower oil. A graph similar in appearance to that in figure 6, but for our silicone oil with its nearly twenty-fold higher viscosity compared with the sunflower oil, and one-thousand-fold higher viscosity compared with water, yielded
 $k=1.3$
. Despite the large differences in the viscosity the three values for
 $k$
are approximately equal and the reason for this will be addressed at the end of § 4.4.
Dimensionless deep-seal time,
 $t_{ds}^{\ast }$
as a function of the Froude number,
 $\mathit{Fr}$
, for spheres of different diameter
 $D$
(see legend). Results for impact on homogeneous one-fluid system. ——: present experimental data for sunflower oil, linear least-squares fit,
 $t_{ds}^{\ast }=1.27\mathit{Fr}$
; - - - - -: result for water of Truscott & Techet (Reference Truscott and Techet2009a
),
 $t_{ds}^{\ast }=1.25\mathit{Fr}$
.

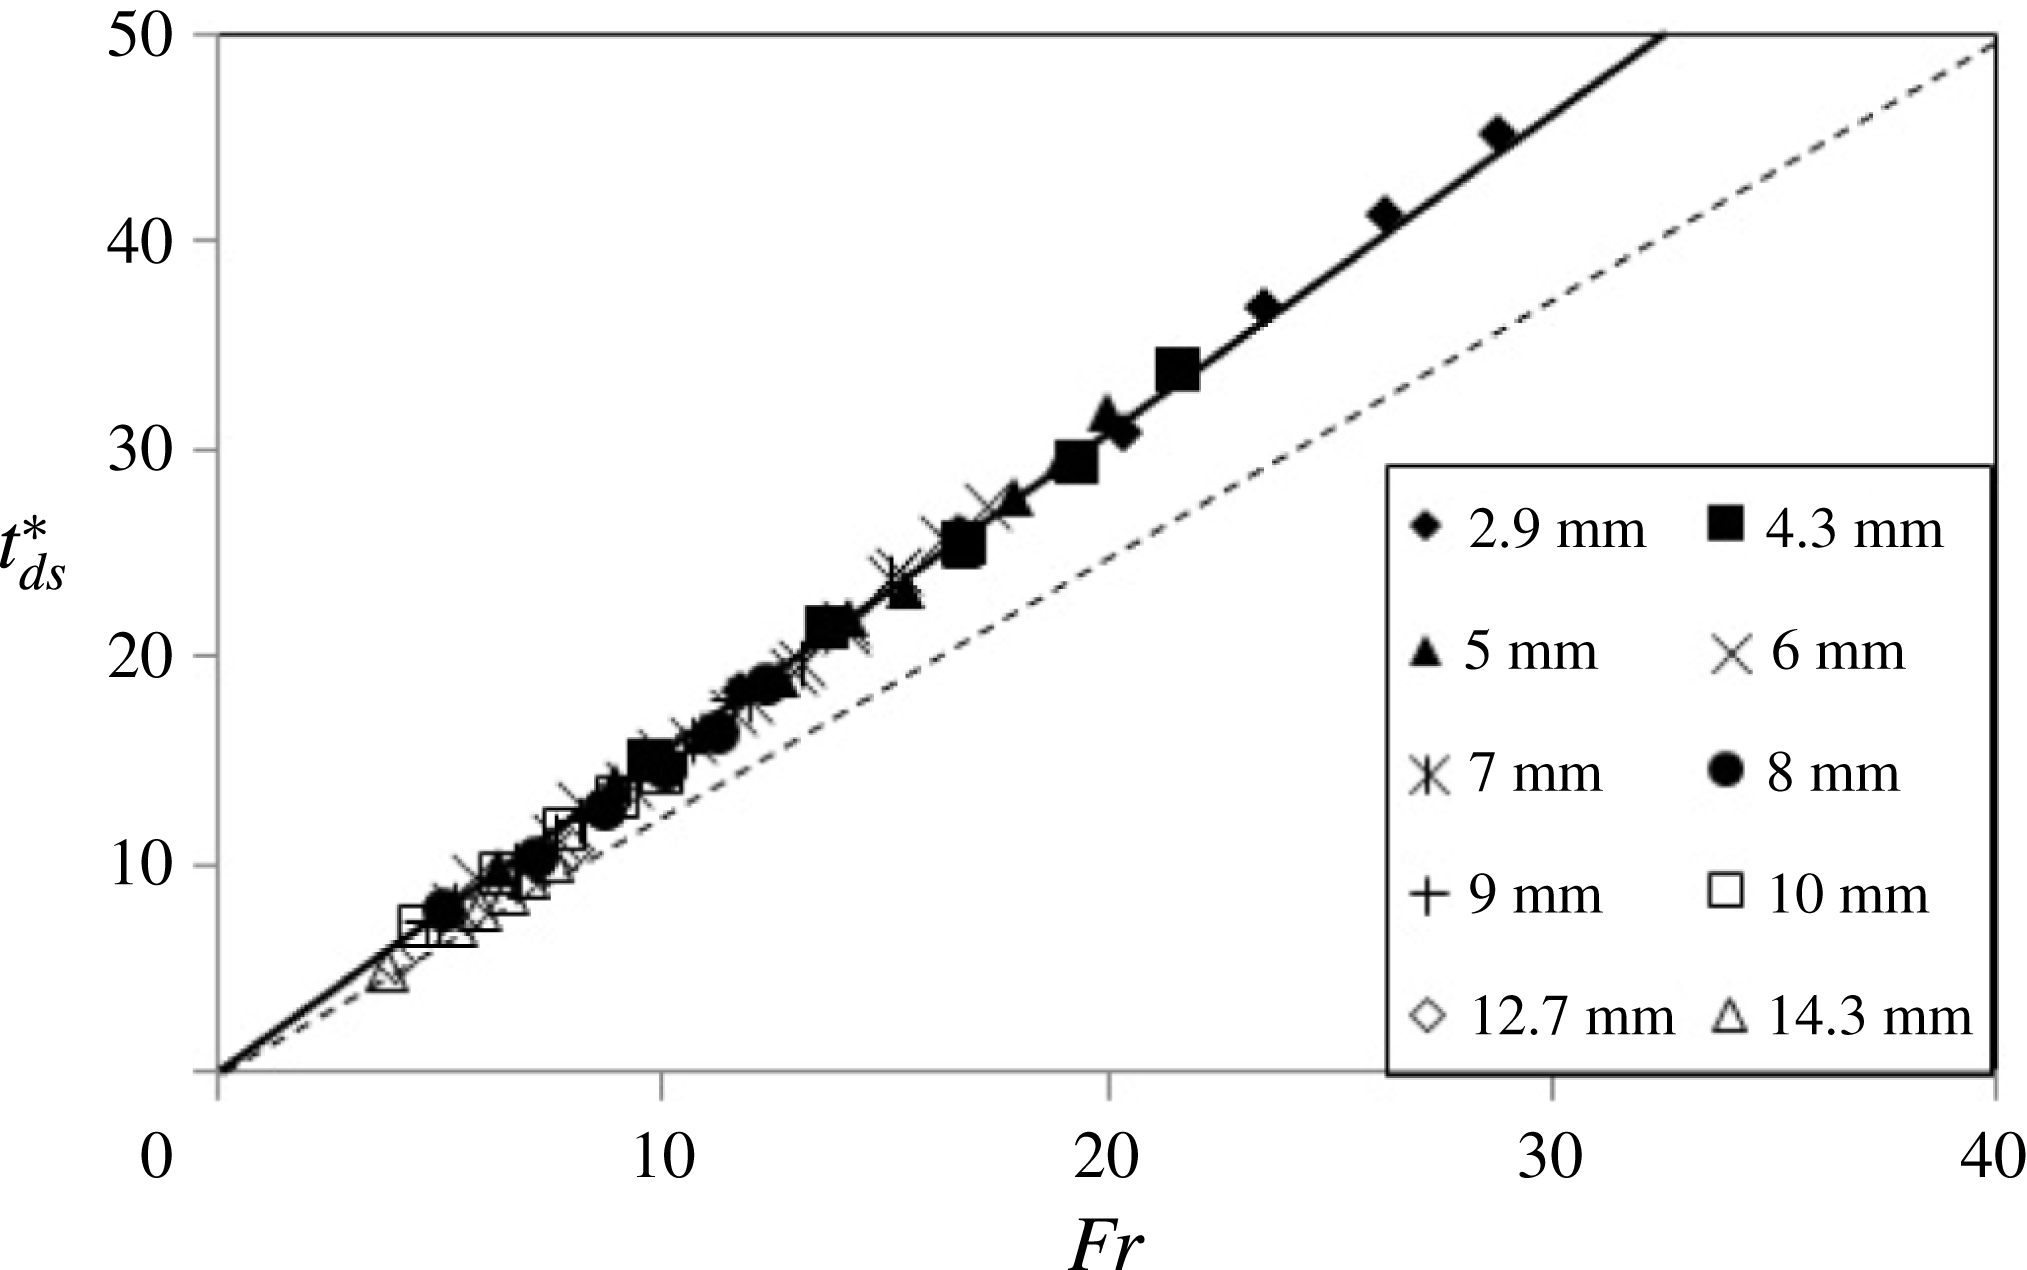
Figure 7 compares our current experimental data points obtained for
 $t_{ds}^{\ast }$
for the two-layer system of sunflower oil above water to the single-layer results from figure 6. The dashed line in figure 7 represents the results of Truscott & Techet (Reference Truscott and Techet2009a
) discussed in the context of figure 6. The data displayed in the figure reveal that there exists a substantial difference between the data for the single-layer system and the data for the two-layer system. The least-squares fit (solid line) interpolating our two-layer data in figure 7 reveals a gradient
 $k=1.55$
. The corresponding result obtained for the higher-viscosity silicone oil on water was
 $k=1.53$
. Note also that for the experiments involving sunflower oil the depth of the oil layer was constant at
 $d=5$
mm while the result for the silicone oil included data for a number of different layer depths between
 $d=5$
mm and
 $d=15$
mm. In summary, the time
 $t_{ds}^{\ast }$
to deep seal for the two-layer system is approximately 23 % longer than the corresponding time for the single-layer system (dashed line) for which
 $t_{ds}^{\ast }=1.25\mathit{Fr}$
.
Dimensionless deep-seal time,
 $t_{ds}^{\ast }$
as a function of the Froude number,
 $\mathit{Fr}$
, for spheres of different diameter
 $D$
(see legend). ——: present experimental data points for two-layer system of sunflower oil above water, linear least-squares fit,
 $t_{ds}^{\ast }=1.55\mathit{Fr}$
; - - - - -: result for water only, Truscott & Techet (Reference Truscott and Techet2009a
),
 $t_{ds}^{\ast }=1.25\mathit{Fr}$
.

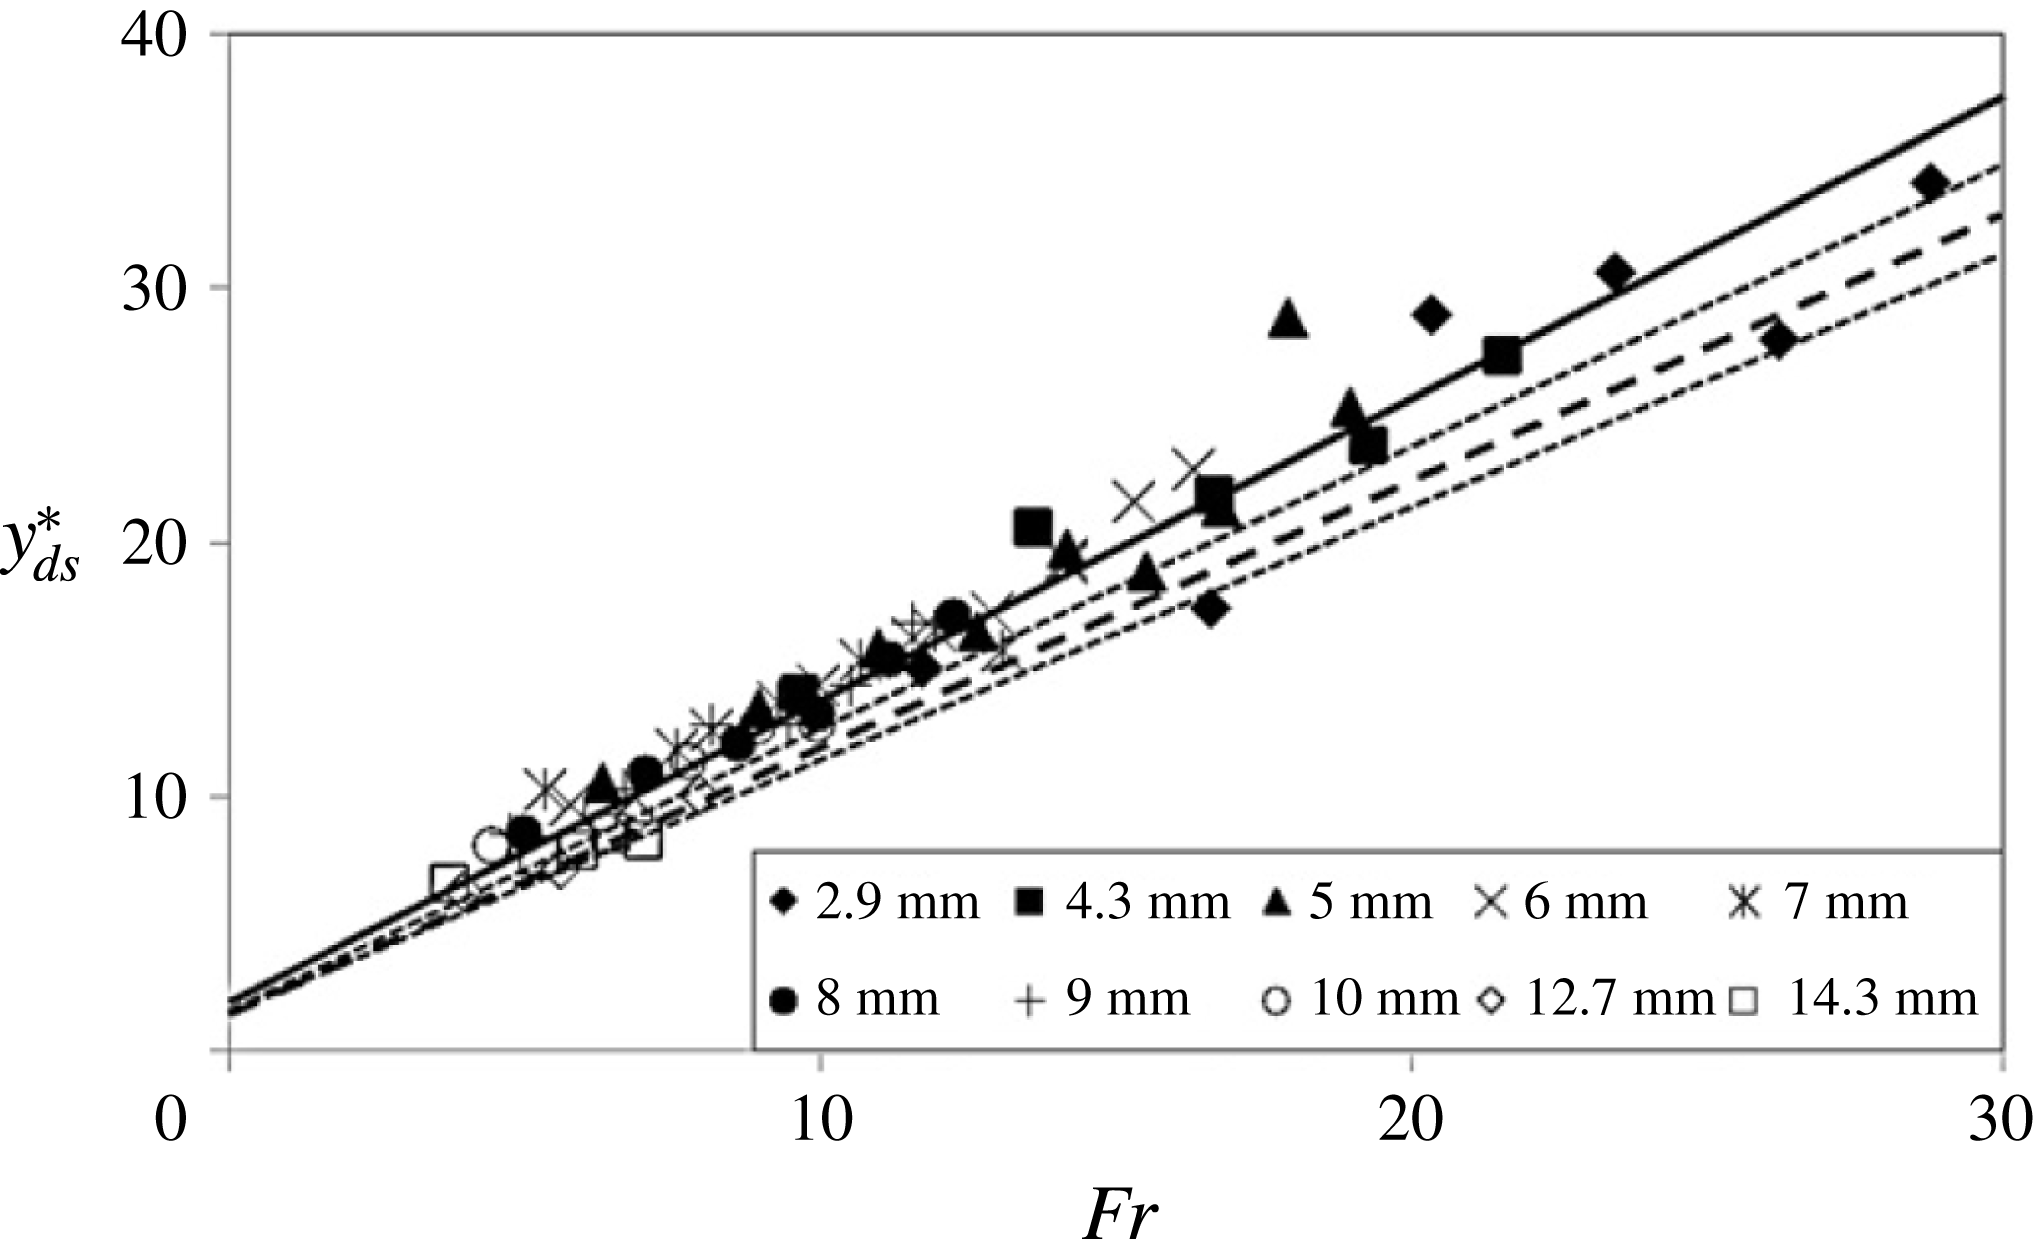
Figure 8 displays a comparison between the non-dimensional deep-seal depth
 $y_{ds}^{\ast }=y_{ds}/D$
for our two-layer oil–water system and the single-layer system of Truscott & Techet (Reference Truscott and Techet2009a
). The lines in figure 8 representing the data of Truscott & Techet were reproduced for the data points for steel spheres from figure 13(c) in their paper and the estimate for the maximum error included here reflects the approximate maximum scatter of the data points in their figure.
Figure 8 reveals that, similar to figure 7, there is a significant difference, beyond the extent of the maximum error margin, between our data for the two-layer system and the homogeneous system of Truscott & Techet (Reference Truscott and Techet2009a
) for the deep-seal depth. A linear least-squares fit
 $y_{ds}^{\ast }=c\mathit{Fr}$
revealed a gradient
 $c=1.18$
for the interpolation of the data points shown in figure 8 for our two-layer system comprising sunflower oil above water. From figure 13(d) in Truscott & Techet (Reference Truscott and Techet2009a
) one obtains a gradient of approximately
 $c=1.0$
for their single-layer water system. The fitting gradient we obtained for the data of our high-viscosity silicone oil over water is
 $c=0.9$
.
Dimensionless deep-seal depth,
 $y_{ds}^{\ast }$
, as a function of the Froude number,
 $\mathit{Fr}$
, for spheres with different diameters
 $D$
(see legend). ——: present experimental data for system with sunflower oil above water, linear least-squares fit,
 $y_{ds}^{\ast }/\mathit{Fr}\approx 1.18$
; – – –: data taken from figure 13(c) of Truscott & Techet (Reference Truscott and Techet2009a
)
 $y_{ds}^{\ast }/\mathit{Fr}\approx 1$
; - - - - - -: estimated maximum error boundaries for data from figure 13(c) of Truscott & Techet (Reference Truscott and Techet2009a
).

Using the definitions for
 $t_{ds}^{\ast }$
,
 $y_{ds}^{\ast }$
and the linear data interpolations in figures 6–8 one has
 $c/k=\overline{u}/u_{i}$
where
 $\overline{u}=y_{ds}/t_{ds}$
is the mean speed of the sphere within the liquids to the instant when deep seal occurs. For the numeric values for
 $k$
and
 $c$
from above one finds
 $\overline{u}=0.8u_{i}$
for the data for water from Truscott & Techet (Reference Truscott and Techet2009a
),
 $\overline{u}=0.76u_{i}$
for our system comprising sunflower oil over water and
 $\overline{u}=0.59u_{i}$
for our data for the high-viscosity silicone over water. These results express that the mean speed of the spheres, to the moment of deep seal, decreases with an increasing viscosity of the oil layer covering the spheres. Hence, as one might expect, the oil film acquired by the spheres increases the drag forces acting on them while descending within the pool of water. In comparison our corresponding data for spheres submerging into single-liquid sunflower oil gave
 $\overline{u}=0.49u_{i}$
, and
 $\overline{u}=0.20u_{i}$
for the high-viscosity silicone oil, which is qualitatively consistent with the values for the two-layer systems. We will briefly consider the deceleration of the spheres, and the associated drag forces acting on them, in the following section.
4.2. Sphere deceleration and drag forces
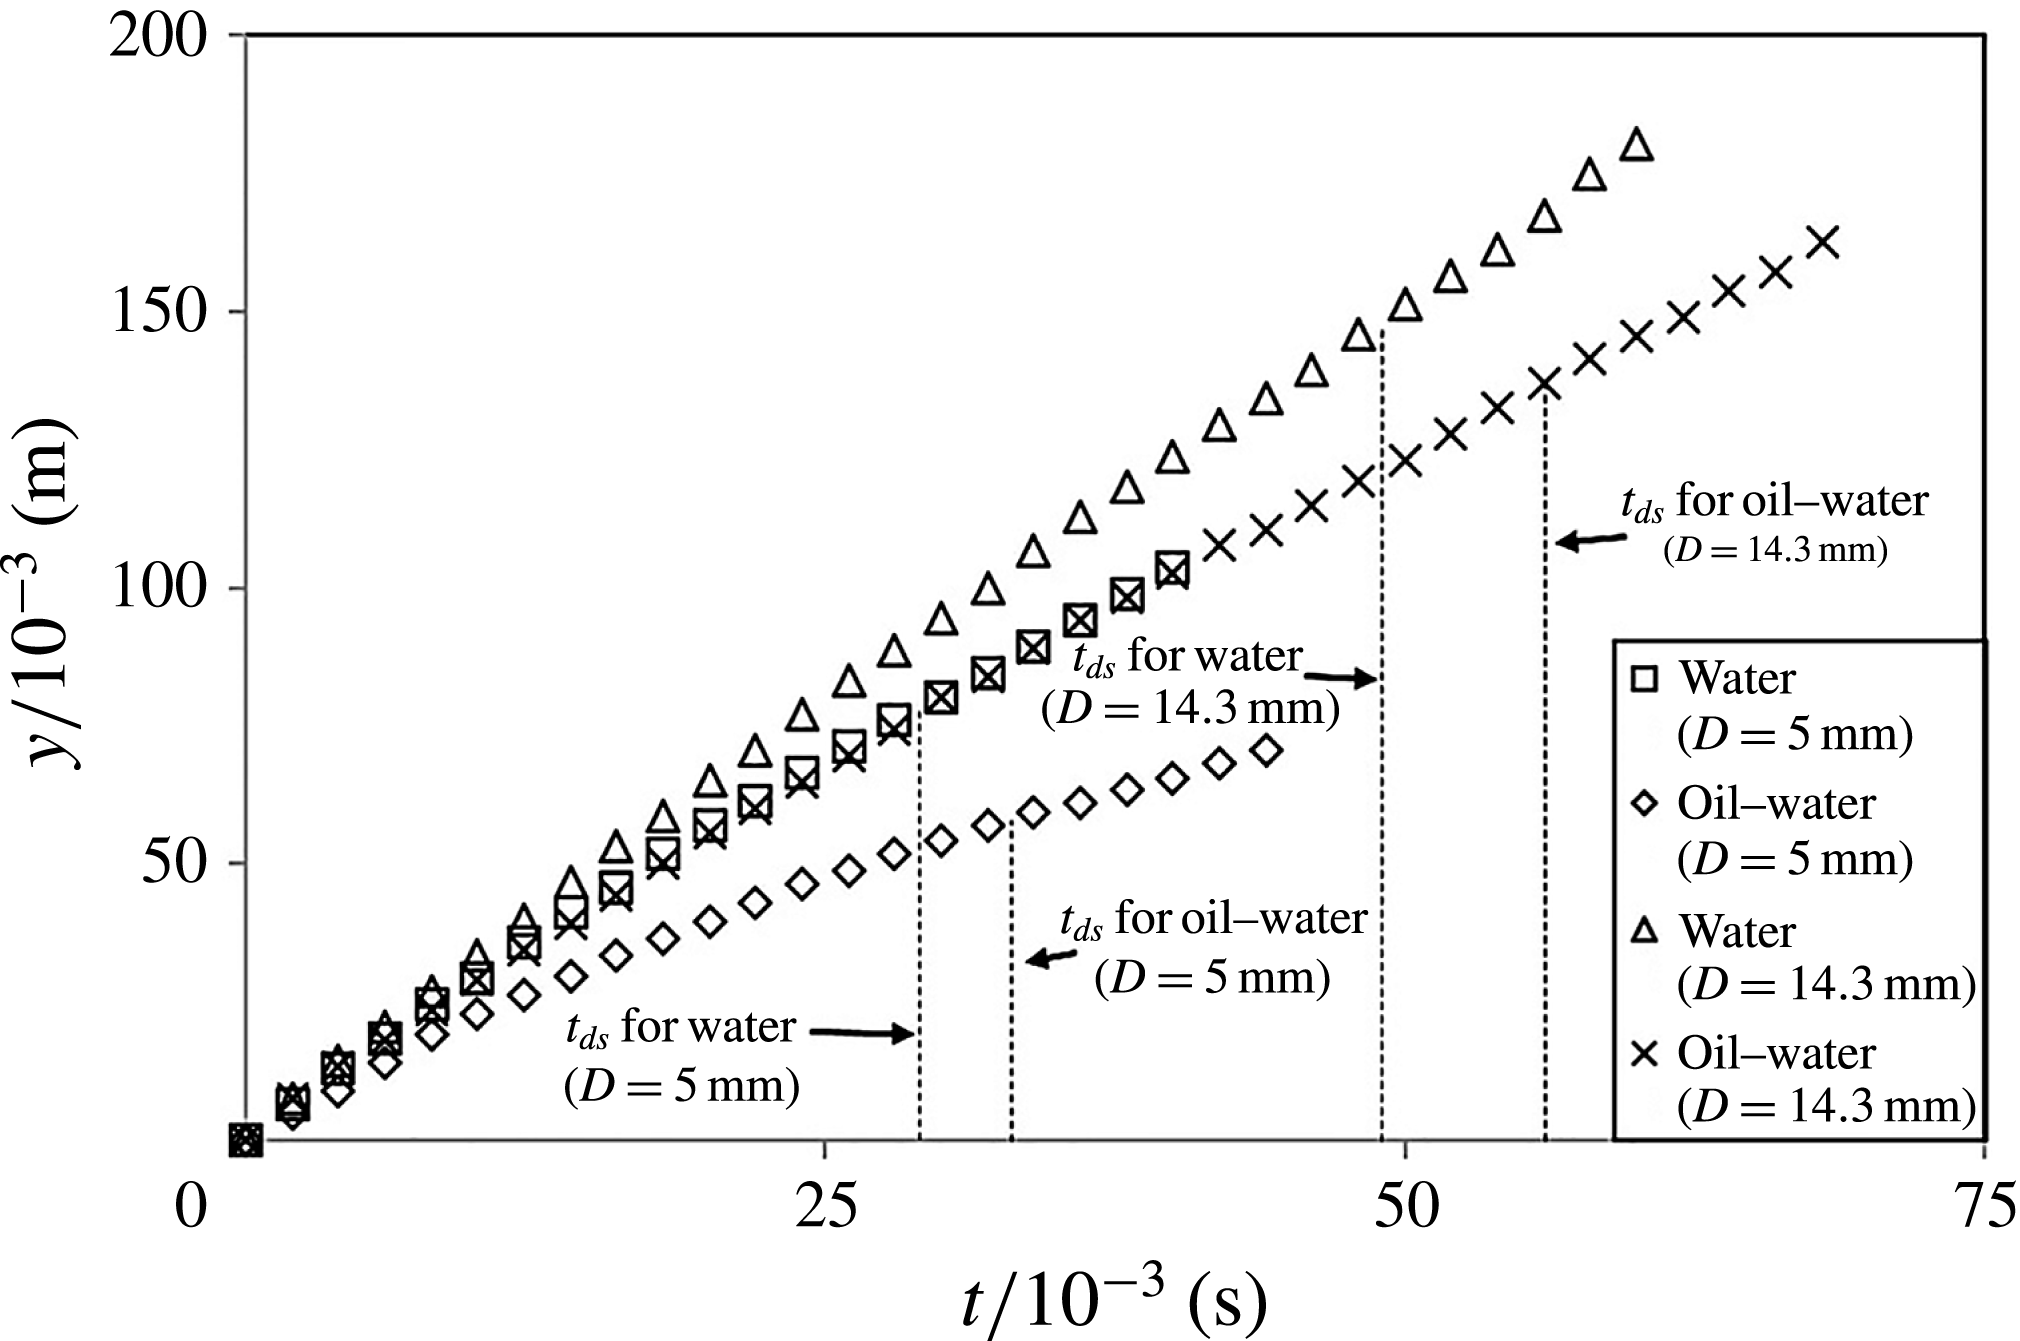
Figure 9 provides a direct verification of our above conclusion that the oil film covering the sphere must have resulted in an increased drag force. The figure compares some raw data for the sphere position,
 $y$
, underneath the water surface as a function of time,
 $t$
, for the two cases when the spheres enter a water-only system and a system where a layer of the high-viscosity silicone oil was resting above the pool of water. The displayed data are for one of the smaller (
 $D=5$
mm) spheres and for the largest (
 $D=14.3$
mm) sphere used in the experiments at equal impact velocity of
 $u_{i}=3.2$
m s
 $^{-1}$
. The associated impact Reynolds numbers, based on the kinematic viscosity of the ambient water, are 16 000 and 45 760. The data in figure 9 clearly reveal that for both spheres the acquired oil film has resulted in a substantially reduced sphere mobility. We have estimated the accelerations and the forces associated with the data in figure 9. We found that the drag coefficient associated with both the large and the small clean sphere impinging onto the water-only system, with the cavities in their wakes, is of the order of
 $C_{D}=0.25{-}0.30$
. The drag coefficient for the oil-covered 5 mm sphere is about
 $C_{D}=1$
and it is about
 $C_{D}=0.8$
for the oil-covered 14.3 mm sphere.
Raw data for the sphere position,
 $y$
, underneath the liquid surface as a function of time,
 $t$
, for two spheres with different diameters,
 $D=5$
and
 $14.3$
mm, at equal impact velocity
 $u_{i}=3.2$
m s
 $^{-1}$
. The impact Reynolds numbers, based on the kinematic viscosity of the ambient water, are 16 000 for the smaller sphere and 45 760 for the larger one. Comparison of data for spheres entering a system of water only and spheres entering a system with a layer of the high-viscosity silicone oil resting above the water. The vertical dashed lines in the figure identify the instant,
 $t_{ds}$
, of deep seal for each experiment.

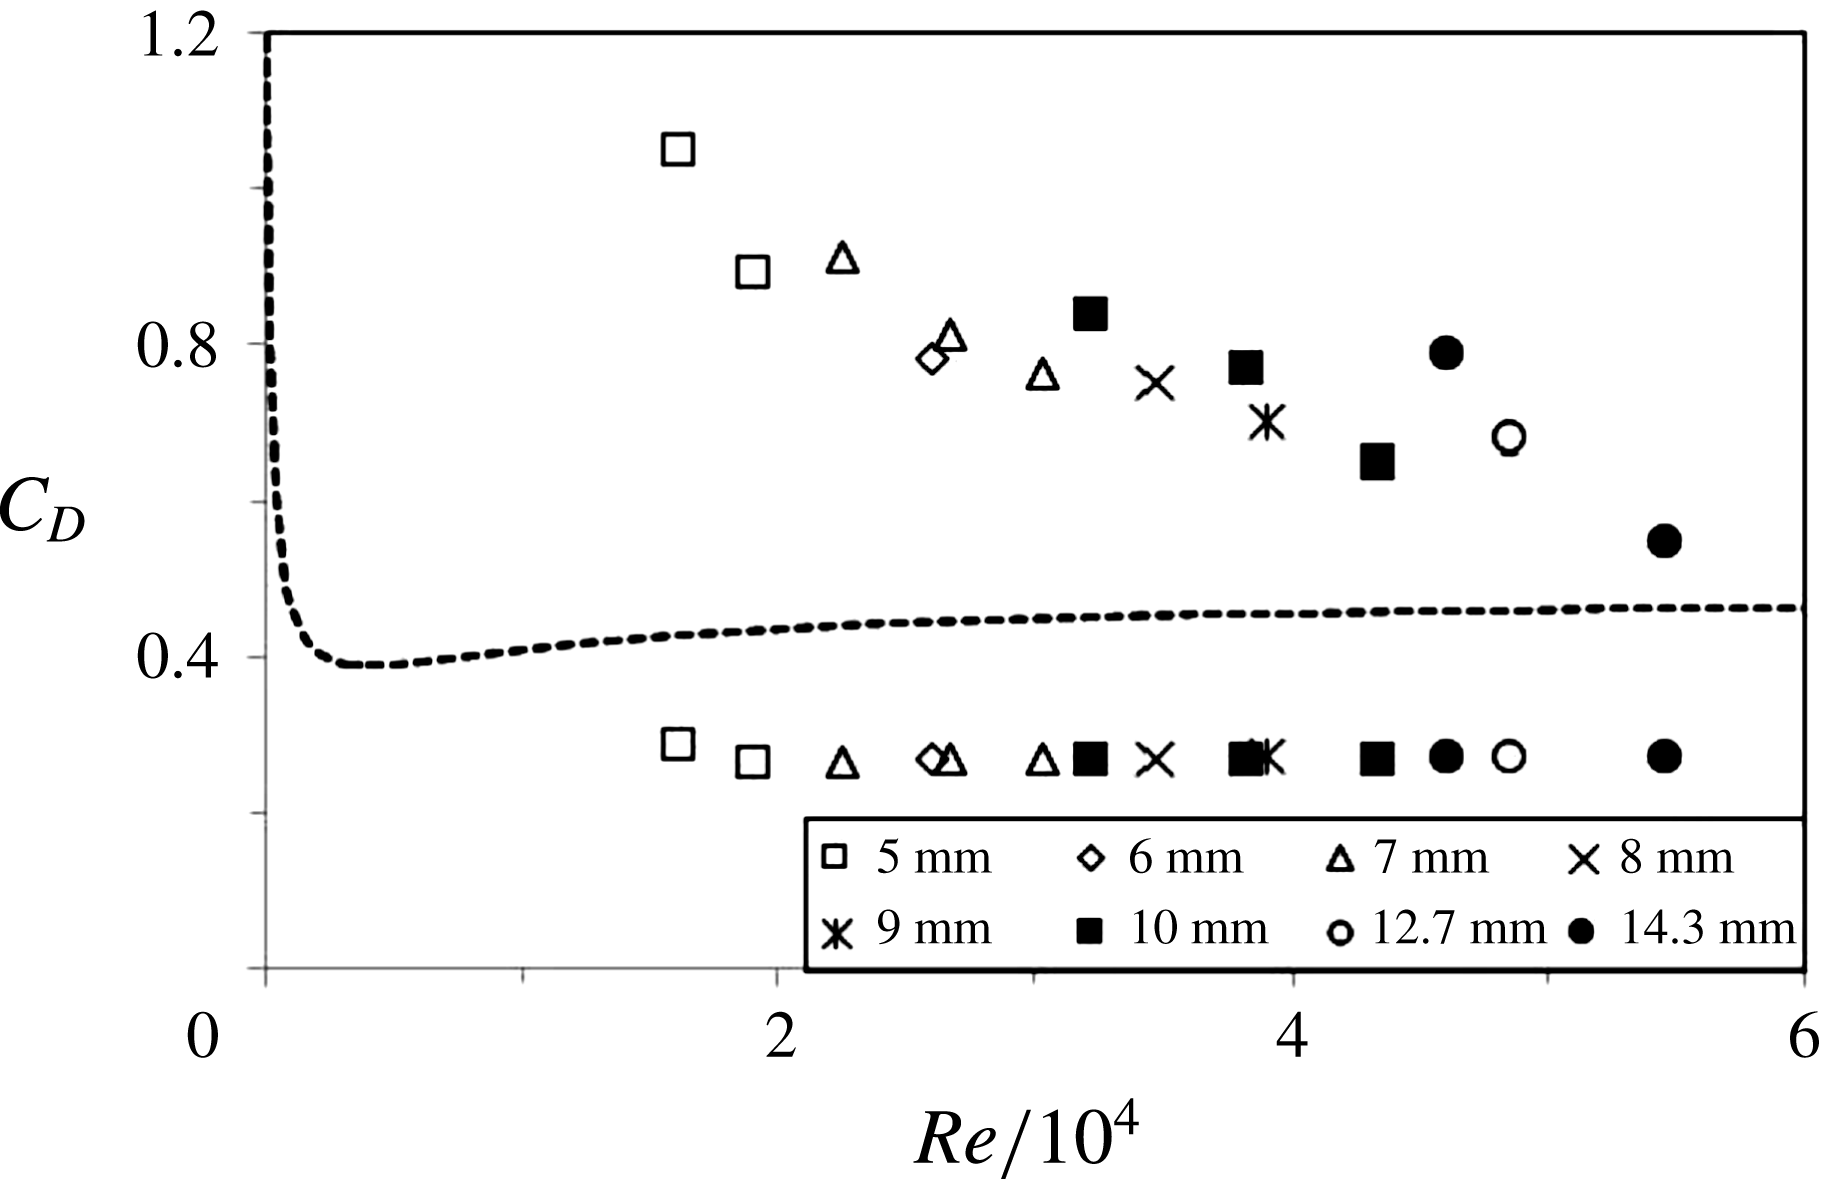
Figure 10 summarizes all our available data for the drag coefficients for experiments with clean spheres and spheres covered with a film of the high-viscosity silicone oil in comparison with the standard drag data for spheres in a homogeneous liquid. The drag data for spheres in a homogeneous liquid were calculated using equation (19) of Brown & Lawler (Reference Brown and Lawler2003). For the data points from our experiments, for which
 $15\,000\leqslant \mathit{Re}\leqslant 55\,000$
, one expects drag coefficients in the range around
 $0.4\leqslant C_{D}\leqslant 0.5$
for spheres in a homogeneous liquid. Figure 10 reveals that the drag coefficient of our impacting clean spheres with cavities in their wake (data points below dashed line) was reduced by about 30–40 % compared to these values. However, the drag coefficients for the impacting spheres which were covered with the high-viscosity silicone oil (data points above dashed line) are more than twice as high as the corresponding values of spheres in a homogeneous liquid at the lower end of the tested Reynolds-number range, but the data approach the value for spheres in a homogeneous liquid with increasing Reynolds number.
Note that the deceleration of the spheres, between their impact with the liquid surface and the instant of deep seal, implies that the data for the deep-seal time and the deep-seal depth in § 4.1 cannot scale with the Froude number,
 $\mathit{Fr}$
, alone. Due to the observed deceleration there must exist an additional scaling with the ratio of sphere density,
 ${\it\rho}_{s}$
, and liquid density,
 ${\it\rho}_{l}$
, which only vanishes in the limit
 ${\it\rho}_{s}/{\it\rho}_{l}\rightarrow \infty$
. This issue is also addressed in Bergmann et al. (Reference Bergmann, van der Meer, Gekle, van der Bos and Lohse2009) who used impactors rigidly mounted to a motor-actuated mechanism to enforce a constant, controllable speed in their experiments investigating the impact of a disk on a water surface.
Drag coefficient,
 $C_{D}$
, as a function of the impact Reynolds number,
 $\mathit{Re}=u_{i}D/{\it\nu}$
; where
 ${\it\nu}$
is the kinematic viscosity of water. The dashed line represents the standard drag coefficient of a sphere in a homogeneous liquid; data for line calculated from equation (19) in Brown & Lawler (Reference Brown and Lawler2003). The data points below the dashed line represent our data for the drag coefficient for impacting clean spheres with cavities in their wake. The data points above the dashed line represent our data for spheres covered in the high-viscosity silicone oil with cavities in their wake.

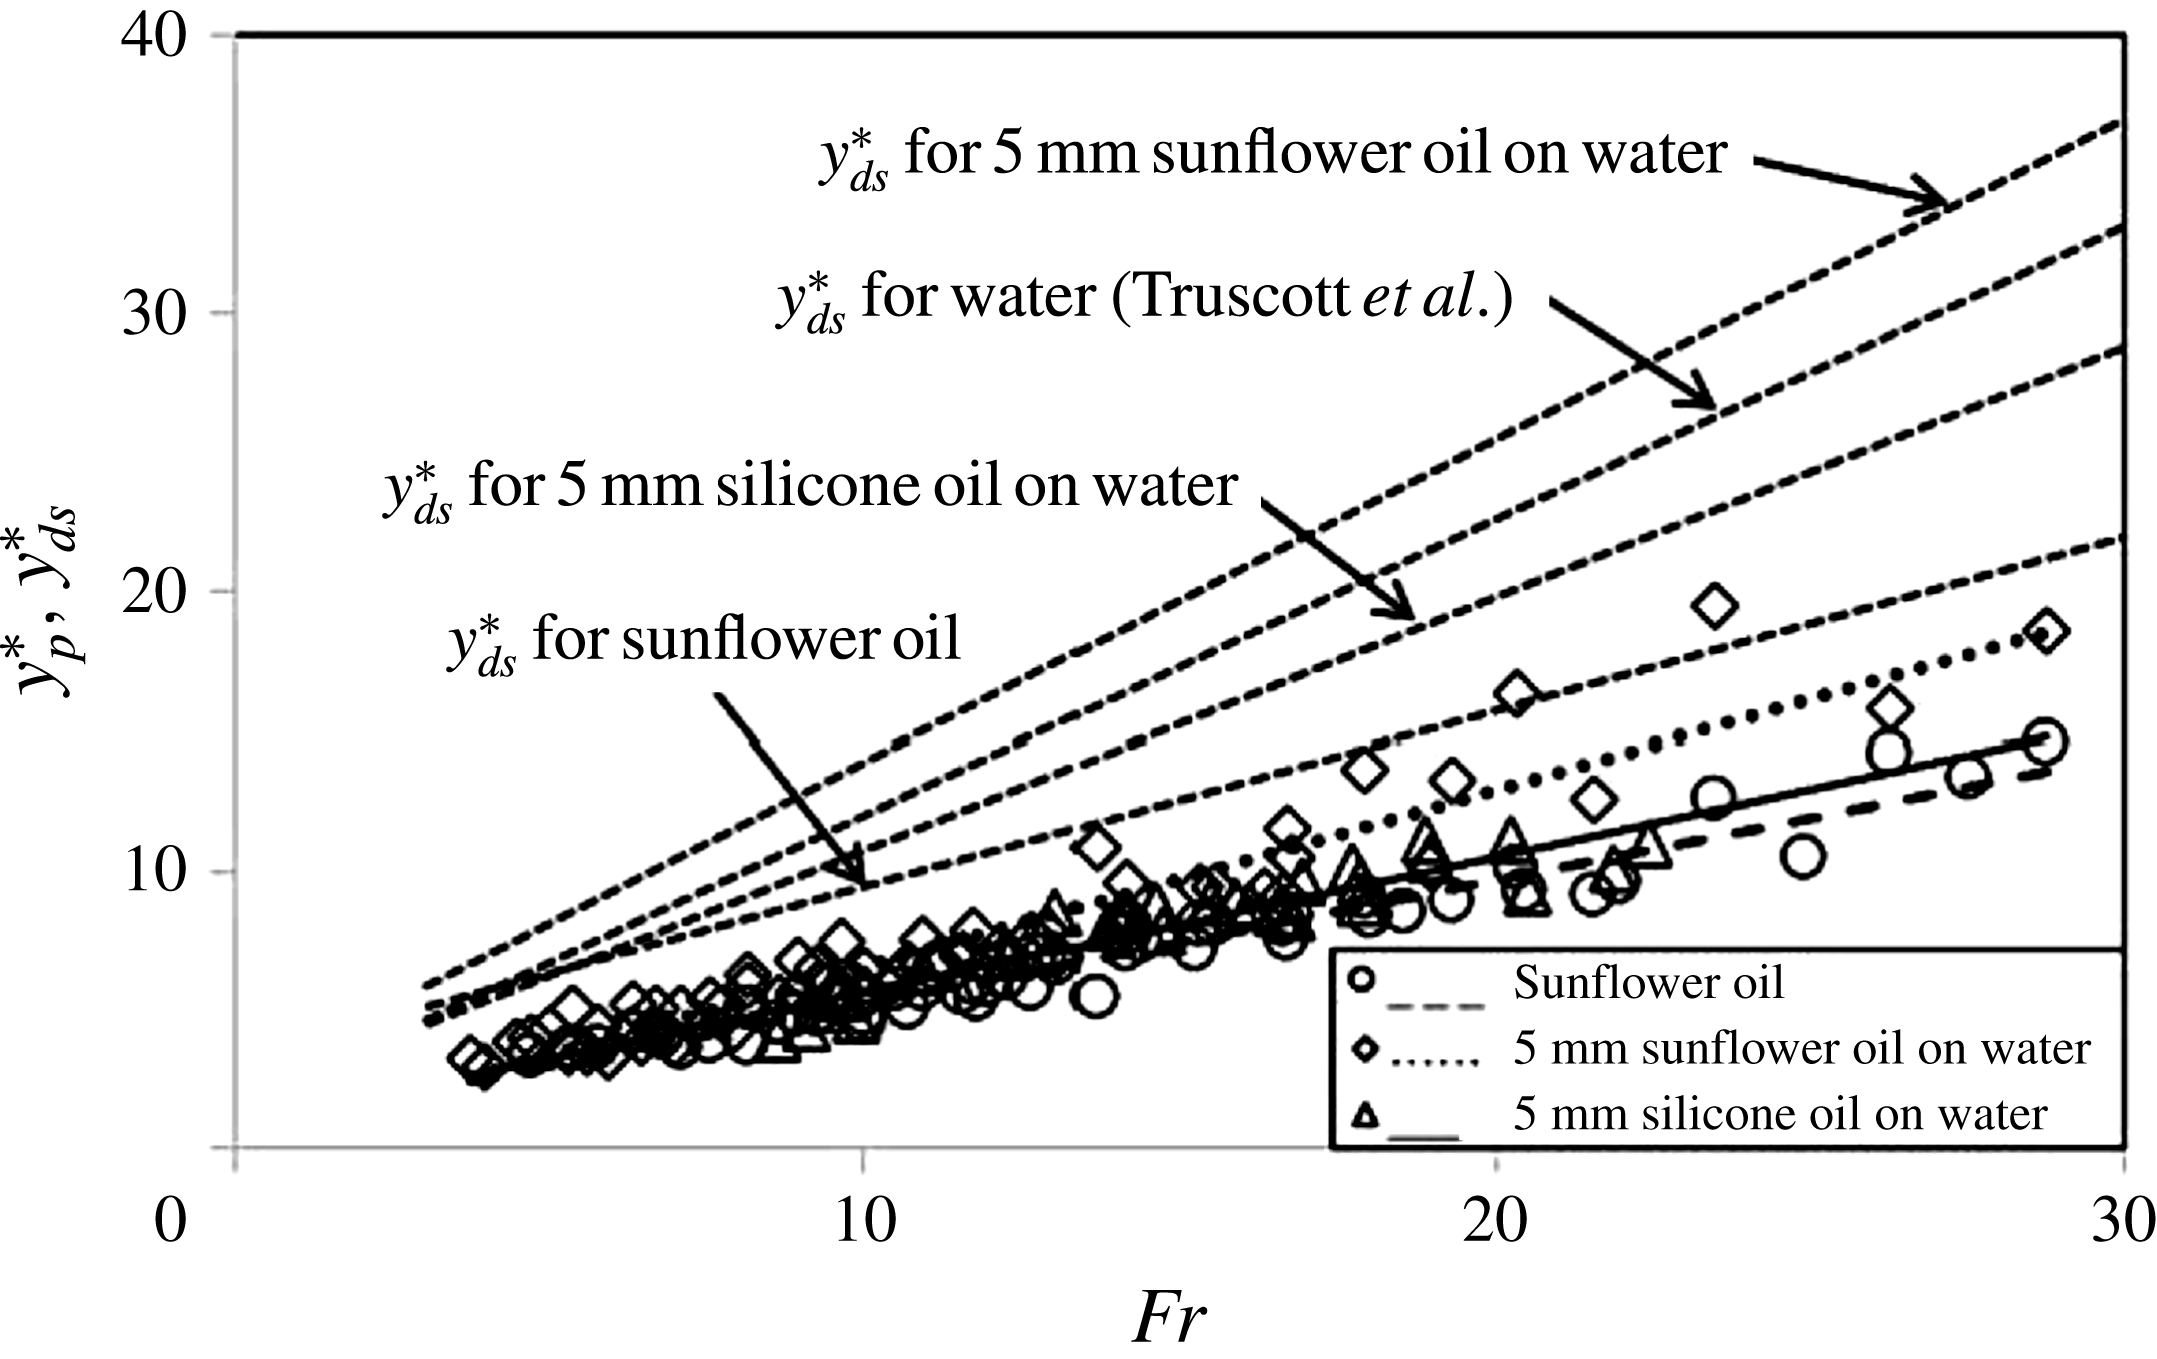
Dimensionless pinch-off depth,
 $y_{p}^{\ast }$
, as a function of the Froude number,
 $\mathit{Fr}$
, and comparison to the data interpolations for the deep-seal depth
 $y_{ds}^{\ast }$
discussed in the context of the discussion of figure 8.

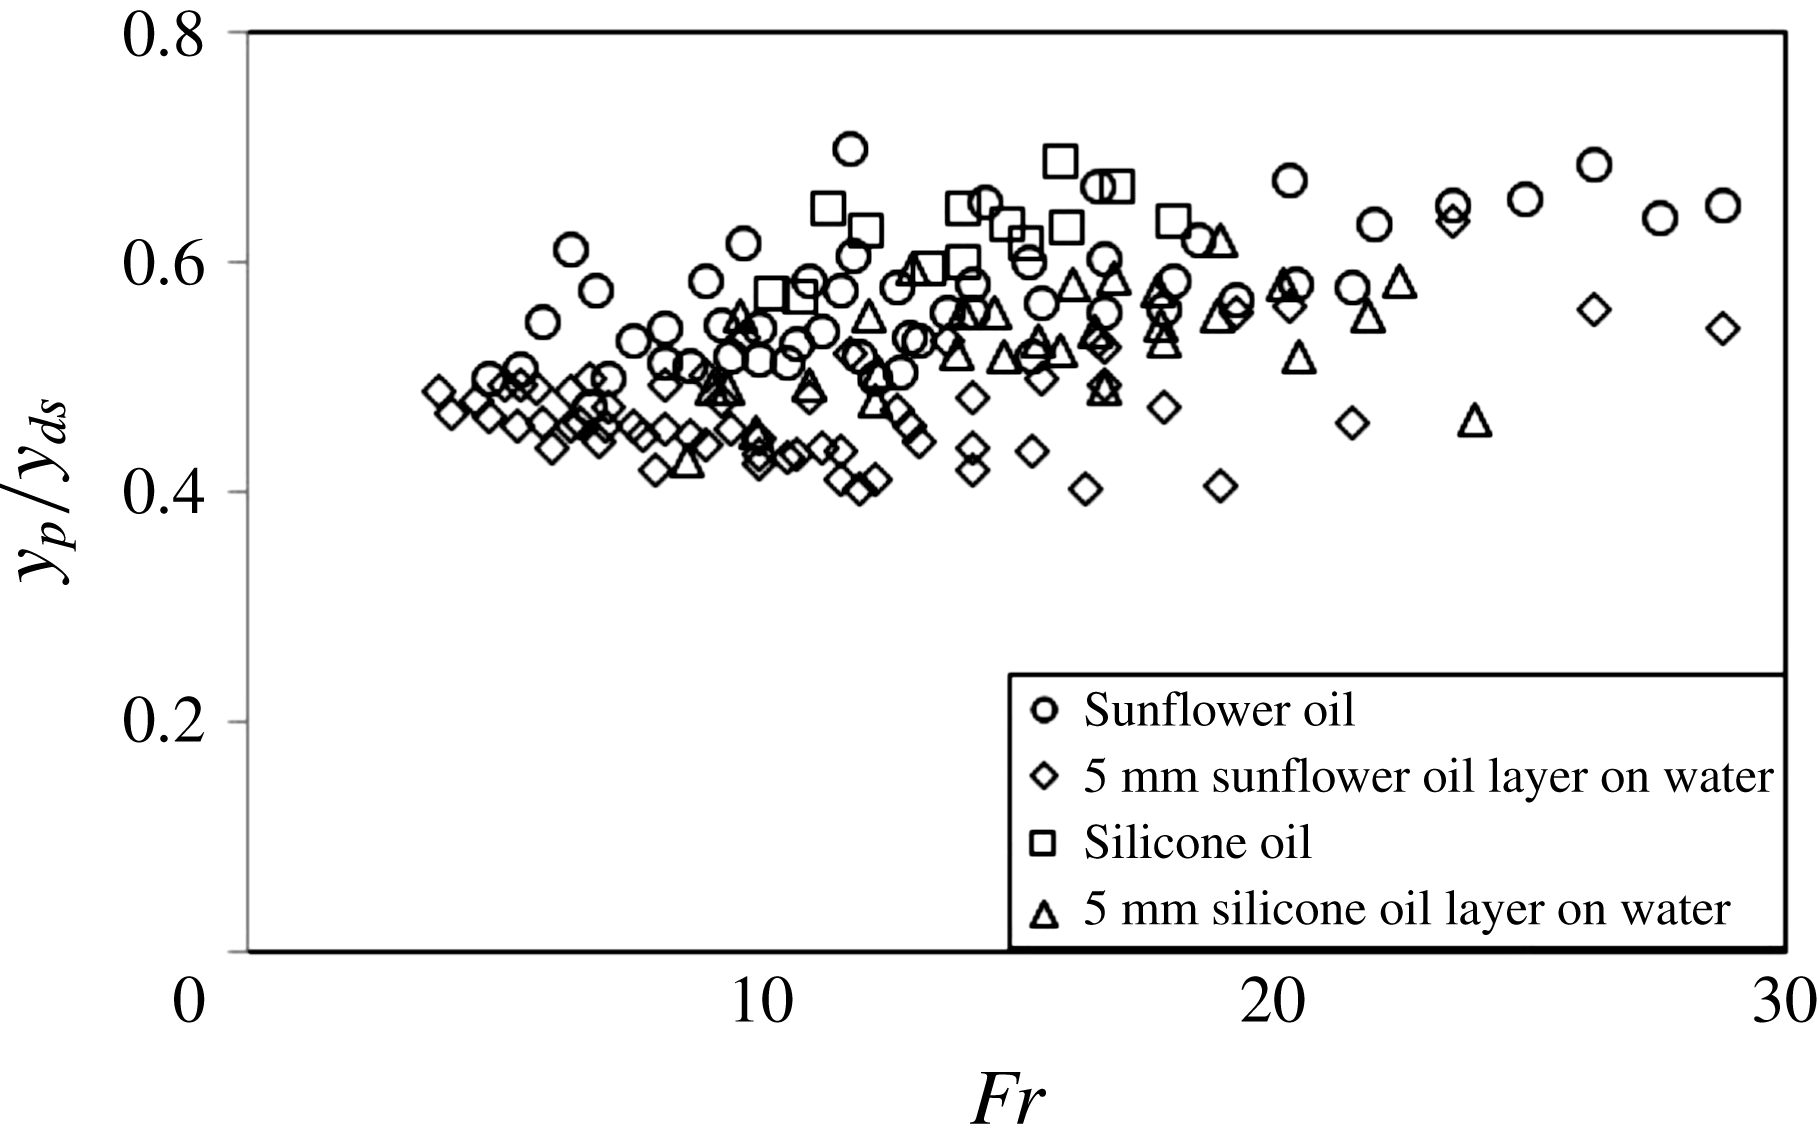
The ratio
 $y_{p}/y_{ds}$
of pinch-off depth and deep-seal depth as a function of the Froude number
 $\mathit{Fr}$
.

4.3. Pinch-off depth
The results of the previous section have shown that the surface layer of sunflower oil increases the deep-seal depth,
 $y_{ds}$
, and the deep-seal time,
 $t_{ds}$
, while it simultaneously reduces the average speed,
 $\overline{u}$
, of the sphere until the instant when deep seal occurs. This implies that the pinch-off depth,
 $y_{p}$
in figure 5, must have also been increased by adding the surface layer of oil. The pinch-off depth was not considered quantitatively in the papers relevant to our discussion above. Nevertheless, we measured
 $y_{p}$
for the purpose of a consistency check. The data for
 $y_{p}$
are shown in figure 11 in comparison to the data interpolations for the deep-seal depth
 $y_{ds}$
discussed in connection with figure 8. The data points in figure 11 are consistent with the results from the discussion of figures 7 and 8 in that they show that
 $y_{p}$
does indeed increase with
 $\mathit{Fr}$
. The data also reveal that the rate of increase of
 $y_{p}$
is comparable to the corresponding increase rates for
 $y_{ds}$
. Moreover, a comparison between the three sets of data points for
 $y_{p}$
in figure 11 shows that there is a small, albeit consistent, trend for the data for the two-layer systems to be very slightly higher than the data for the homogeneous sunflower oil.
Figure 12 displays our experimental data for the ratio
 $y_{p}/y_{ds}$
of pinch-off depth and deep-seal depth as a function of
 $\mathit{Fr}$
. The figure shows that all data lie within the range
 $0.4<y_{p}/y_{ds}<0.7$
and that the data are essentially independent of the Froude number. The values for the gradients
 $m$
for the least-squares interpolations
 $y_{p}/y_{ds}=mFr$
were 0.002, 0.006, 0.009 and 0.005 for, respectively, homogeneous sunflower oil, sunflower oil on water, homogeneous silicone oil and silicone oil on water; with a value of 0.006 when all four data sets are combined. The mean values and associated standard deviations for
 $y_{p}/y_{ds}$
are
 $0.57\pm 0.06$
for the homogeneous sunflower oil,
 $0.47\pm 0.04$
for sunflower oil on water,
 $0.64\pm 0.05$
for the homogeneous silicone oil, and
 $0.53\pm 0.05$
for silicone oil on water; the overall mean and standard deviation for the combined data sets is
 $0.53\pm 0.07$
. These values for
 $y_{p}/y_{ds}$
support the recent theoretical result
 $1/3\leqslant y_{p}/y_{ds}\leqslant 1/2$
of Duclaux et al. (Reference Duclaux, Caillé, Duez, Ybert, Bocquet and Clanet2007) and the data are also very similar to those of Marston, Vakarelski & Thoroddsen (Reference Marston, Vakarelski and Thoroddsen2012, p. 475) for their experiments with heated (Leidenfrost) spheres.
4.4. Discussion of the results for deep-seal time and deep-seal depth
Truscott & Techet (Reference Truscott and Techet2009a
, p. 156) comment that the non-dimensional deep-seal time as defined and used in their paper is ‘a less than ideal scaling parameter’ because the ‘initial impact velocity dominates for both the
 $x$
- and
 $y$
-axes’. Thereafter they relate and express their main results to the alternative non-dimensional time
 ${\it\tau}=t\sqrt{2g/D}$
as defined by Glasheen & McMahon (Reference Glasheen and McMahon1996). Here we have used the same definition,
 $t_{ds}^{\ast }=u_{i}~t_{ds}/D$
, as in Truscott & Techet (Reference Truscott and Techet2009a
) to facilitate a direct comparison of our figures 6 and 7 with the relevant parts of figure 13 in their paper and also because our overall conclusions are not affected since the associated values for
 ${\it\tau}$
are obtained from the gradients
 $k$
of all straight lines
 $t_{ds}^{\ast }=kFr$
in figures 6 and 7 by
 ${\it\tau}=k\sqrt{2}$
. However, we would like to add some further comments regarding the issue of the proper non-dimensionalization scheme for time which are neither expressed in Truscott & Techet (Reference Truscott and Techet2009a
) nor in Glasheen & McMahon (Reference Glasheen and McMahon1996).
The result
 $t_{ds}^{\ast }=1.25\mathit{Fr}$
of Truscott & Techet (Reference Truscott and Techet2009a
) (or in a more general sense the result
 $t_{ds}^{\ast }\propto \mathit{Fr}$
) in figure 6 implies
 $t_{ds}=1.25\sqrt{D/g}$
which, in turn, expresses that
 $t_{ds}$
is independent of the impact velocity
 $u_{i}$
. Hence, the timescale
 $\sqrt{D/g}$
(or
 $\sqrt{D/2g}$
as used in Glasheen & McMahon (Reference Glasheen and McMahon1996)) would naturally appear to be the more appropriate choice for non-dimensionalizing
 $t_{ds}$
rather than using
 $u_{i}/D$
. This option for non-dimensionalizing
 $t_{ds}$
can indeed also be justified on the basis of physical arguments.
It is reasonable to expect that the collapse dynamics of the cavity behind the sphere are not affected by the impact velocity
 $u_{i}$
as long as it is much higher than the typical velocity scale associated with the cavity collapse itself. This is the case for the impacts considered here and in Truscott & Techet (Reference Truscott and Techet2009a
). The typical timescale associated with the cavity collapse is
 $\sqrt{D/g}$
, which is (apart from the factor
 $\sqrt{1/2}$
) the timescale used by Glasheen & McMahon (Reference Glasheen and McMahon1996). The velocity scale associated with the cavity collapse is
 $u_{c}=D/\sqrt{D/g}=\sqrt{Dg}$
which, for our experiments, yields values of
 $u_{c}=0.3$
m s
 $^{-1}$
for spheres with diameters of the order of typically 0.01 m whereas the impact velocity of the spheres in our experiments is 1.4 m s
 $^{-1}\leqslant u_{i}\leqslant 6$
m s
 $^{-1}$
. The data of Truscott & Techet (Reference Truscott and Techet2009a
) were obtained for steel spheres with a diameter of
 $D=0.0254$
m for which
 $u_{c}=0.5$
m s
 $^{-1}$
at impact velocities 1.9 m s
 $^{-1}\leqslant u_{i}\leqslant 9.9$
m s
 $^{-1}$
. Thus, in both studies the impact velocity
 $u_{i}$
is typically an order of magnitude higher than
 $u_{c}$
supporting the option
 $\sqrt{D/g}$
as the time scale to non-dimensionalize
 $t_{ds}$
in future studies. In the opposite limit, when
 $u_{i}\ll u_{c}$
, or equivalently when the release height
 $h\rightarrow 0$
, splashing and cavity formation will evidently cease entirely. However, it is not impossible that some hitherto unobserved phenomena may exist near
 $u_{i}\approx u_{c}$
, where the Weber number is small and surface-tension effects are important, but investigating this was beyond the scope of the present study.
Replacing
 $t_{ds}^{\ast }=t_{ds}u_{i}/D$
by the alternative choice
 $t_{ds}^{\ast }=t_{ds}/\sqrt{D/g}$
would, however, also necessitate to remove the impact velocity
 $u_{i}$
from the non-dimensionalization scheme of the ordinate. The appropriate rescaling of the ordinate would be facilitated by displaying
 $\mathit{Re}_{c}=Du_{c}/{\it\nu}$
, rather than
 $\mathit{Fr}$
, representing a Reynolds number associated with the cavity collapse which has values in the range of approximately
 $400\leqslant \mathit{Re}_{c}\leqslant 5200$
for our current experiments. These moderately high values of
 $\mathit{Re}_{c}$
probably also explain why the deep-seal time,
 $t_{ds}^{\ast }$
, for the data in figure 6 for the homogeneous liquids is essentially independent of the viscosity. The deep-seal time only increases marginally with the viscosity of the liquids as is expressed by the very slightly increasing values of the fitting gradients
 $k$
discussed in connection with the figure.
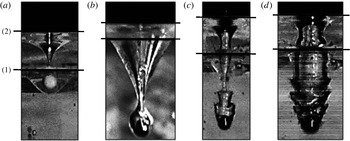
5. The different entry scenarios for spheres submerging into a two-layer system
Our observations have revealed the existence of at least four qualitatively different flow scenarios that can develop when the spheres submerge into the stratified two-layer oil–water system. Which one of the possible different entry scenarios develops must be expected to depend on the exact impact conditions defined by the impact velocity
 $u_{i}$
of the sphere, the density
 ${\it\rho}_{s}$
of the sphere material and the densities and surface tensions of the two liquids involved. The ratio
 $D/d$
of sphere diameter
 $D$
to the depth
 $d$
of the oil layer will moreover become important if
 $d$
is large enough to substantially alter
 $u_{i}$
before the sphere enters the pool of water below.
The four different entry scenarios observed in the current experiments for the entry of a spheres into a stratified two-layer oil–water system. The photographs shown are for our high-viscosity silicone oil atop water: (a) interface-trapped; (b) tailing; (c) transition; and (d) rippling. The superposed lower and upper black lines extending horizontally across each of the photos represent, respectively, the: (1) oil–water interface; and (2) air–oil interface.

The four different entry scenarios we have observed in our current study are illustrated in figure 13. We refer to these four observed scenarios, in figure 13(a–d), as interface-trapped, tailing, transition and rippling. We have observed the interface trapped state in our experiments for relatively low-density sphere materials and at lower impact velocities. Figure 13(a) shows a plastic sphere (a standard commercial airsoft BB pellet) of diameter
 $5.94\pm 0.1$
mm, and density approximately
 ${\it\rho}=1070~\text{kg}~\text{m}^{-3}$
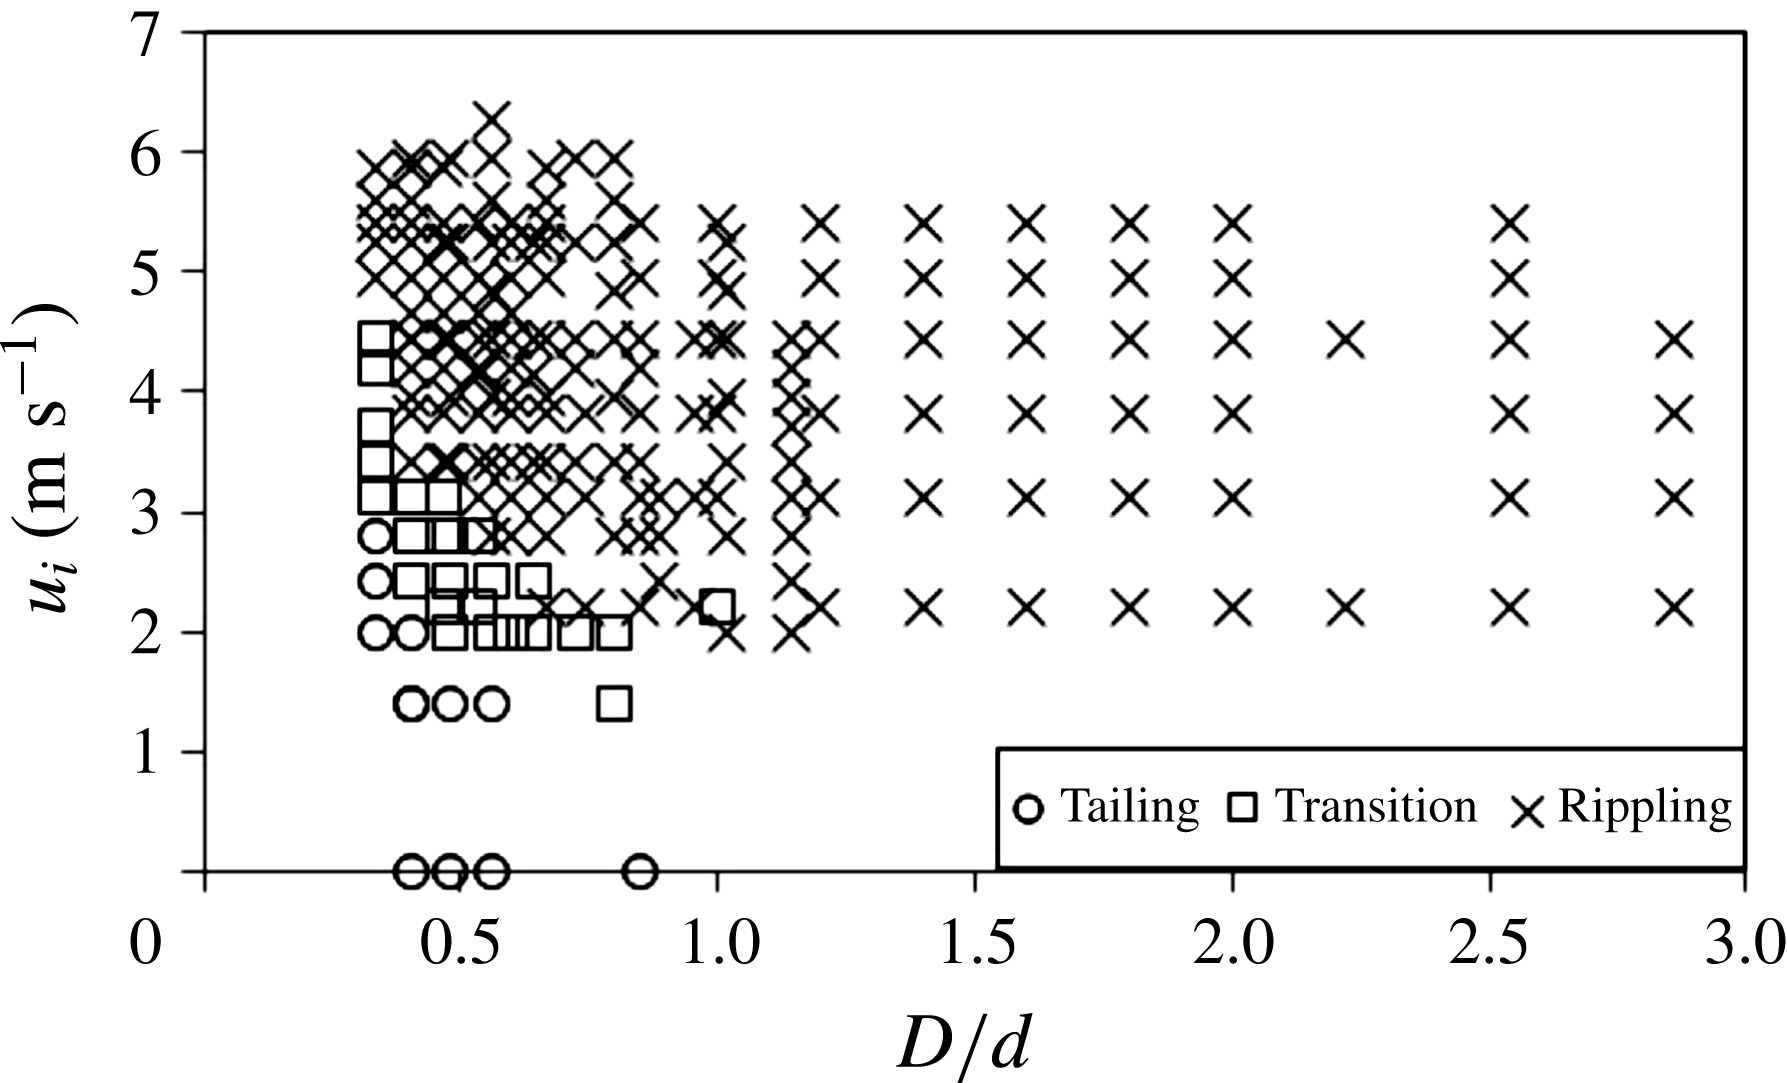
, trapped at the interface between the two liquids. Figure 13(b–d) are for our steel spheres and a phase diagram illustrating where the three different phenomena of tailing, transition and rippling for these ball bearings were observed is shown in figure 14. The tailing phenomena constitutes oil entrainment into the lower pool of water without the generation of a cavity. The four data points on the abscissa of figure 14, for which
 $u_{i}=0$
m s
 $^{-1}$
, were obtained by releasing the spheres from immediately above the liquid oil surface. The transition scenario is characterized by the simultaneous existence of dynamic features of the tailing phenomenon together with beginning ripple formation. The rippling scenario is adopted, and associated with, spheres generating a proper cavity in their wake. Hence, it occurs when the cavity-formation scenario is similar to that for the entry of spheres into homogeneous liquids, or systems of stratified miscible liquids, but with the additional feature of the distinct ripple formation on the cavity walls. Due to the high gravitational forces acting on the steel spheres and the high inertia associated with their motion, even at lower impact velocities, the interface-trapped state was not observed for the ball bearings.
Phase diagram illustrating the parameter regimes where the characteristic entry phenomena were observed, for the silicone oil over water system, for different values of the relative sphere diameter
 $D/d$
and the impact velocity
 $u_{i}$
.

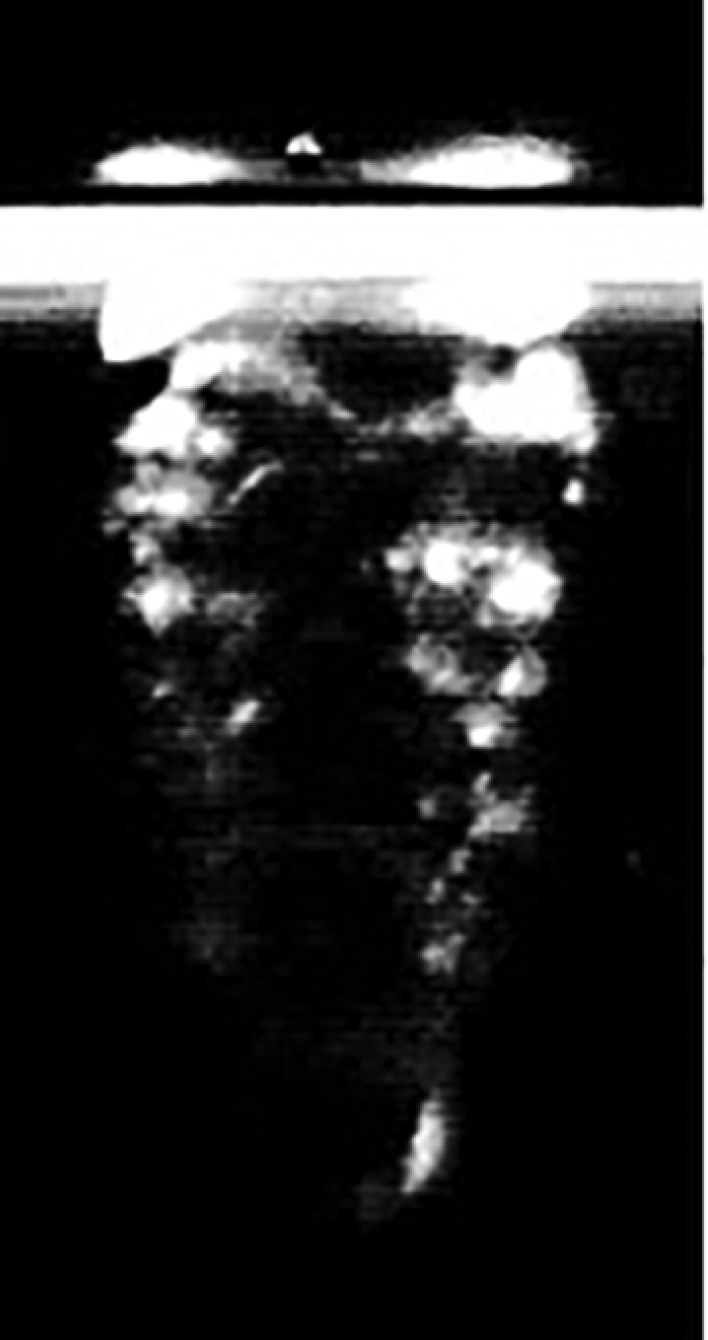
Laser-induced-fluorescence (LIF) visualization of the cavity behind a sphere. The bright illuminated areas on the cavity walls originate from entrained dyed silicone oil. The photo supports the suggestion that the ripple formation phenomenon is associated with the entrained oil.

In order to confirm that the oil layer acquired by the spheres, while passing through the oil layer atop the pool of water, is closely associated with the ripple formation we conducted some further tests. In the first instance we performed laser-induced-fluorescence (LIF) experiments for which the silicone layer atop the pool of water was dyed with a fluorescent dye. We used a vertically orientated laser-light sheet, aligned to coincide with the impact plane of the sphere, to enable the illumination of dyed oil entrained into the pool of water in the wake of the spheres. Figure 15 displays an LIF visualization revealing brightly illuminated areas on the rippled cavity walls which provides evidence for the entrainment of oil into the cavity region.
We moreover conducted two further simple tests to help confirming the origin of the rippling phenomena. For these tests we varied the surface conditions of a sphere of diameter
 $D$
and let it submerge with a constant impact velocity
 $u_{i}$
into a pool of homogeneous water with no oil layer floating on its surface. The surface conditions were modified by initially covering the surface of the sphere by immersing it into a sample of the type of silicone oil previously used to establish the oil layer above the water. After taking the sphere out of the sample of silicone oil we then performed two different types of experimental runs. In the first case we removed excess oil off the surface of the sphere by means of a clean paper tissue before dropping it into the pool of water. However, in the second case we did not remove the excess oil. Hence, in this second case the sphere was covered with a proper oil coating when impacting on the surface of the water.
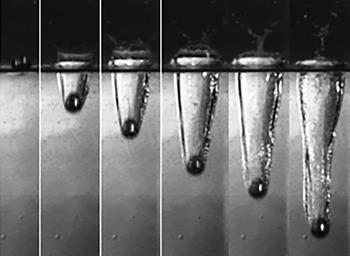
Cavity formation in the wake of a sphere (
 $D=12.7$
mm,
 $u_{i}=3.71~\text{m}~\text{s}^{-1}$
,
 $\mathit{Fr}=10.5$
,
 $Re=47\,100$
) which was only slightly wetted with a very thin oil film into water with no oil layer floating on its surface. Each successive image is separated by 5 ms. The cavity walls remained smooth, consistent with the entries of hydrophobic spheres into water.

Figures 16 and 17 show image sequences obtained from the two types of tests where the spheres were submerged into a sample of the silicone oil before being dropped into the water. Figure 16 displays typical results from a run where the excess oil was removed prior to the experiment while figure 17 shows the corresponding visualizations for the case when the excess oil was not removed. Figure 16, for the case when the excess oil was removed, reveals that the walls of the cavity remained smooth during cavity formation. This result is consistent with pictures from the existing literatures (see e.g. Aristoff & Bush Reference Aristoff and Bush2009) showing smooth cavities being generated following the entry of hydrophobic spheres into water. However, figure 17 for the case when the excess oil was not removed shows ripple structures very similar to those seen to develop in figures 2 and 3 for spheres entering the two-layer oil–water system. Note that figure 17 also displays a ripple-onset length
 $y_{r}$
(cf. figure 4) as is the case for the two-layer system. These results obtained from the two simple test experiments confirm that the ripple pattern is associated with the oil layer covering the spheres.
Cavity formation in the wake of a sphere precoated with ample excess oil into water with no oil layer floating on its surface but experimental conditions that remained otherwise unchanged from those in figure 16. Each successive image is separated by 5 ms. Ripples exist along the cavity walls, similar to the two-layer systems in figures 2 and 3, and the ripple-onset length
 $y_{r}$
is also clearly visible.

6. Quantitative analysis of the ripple instability
6.1. Ripple wavelength and ripple-onset depth
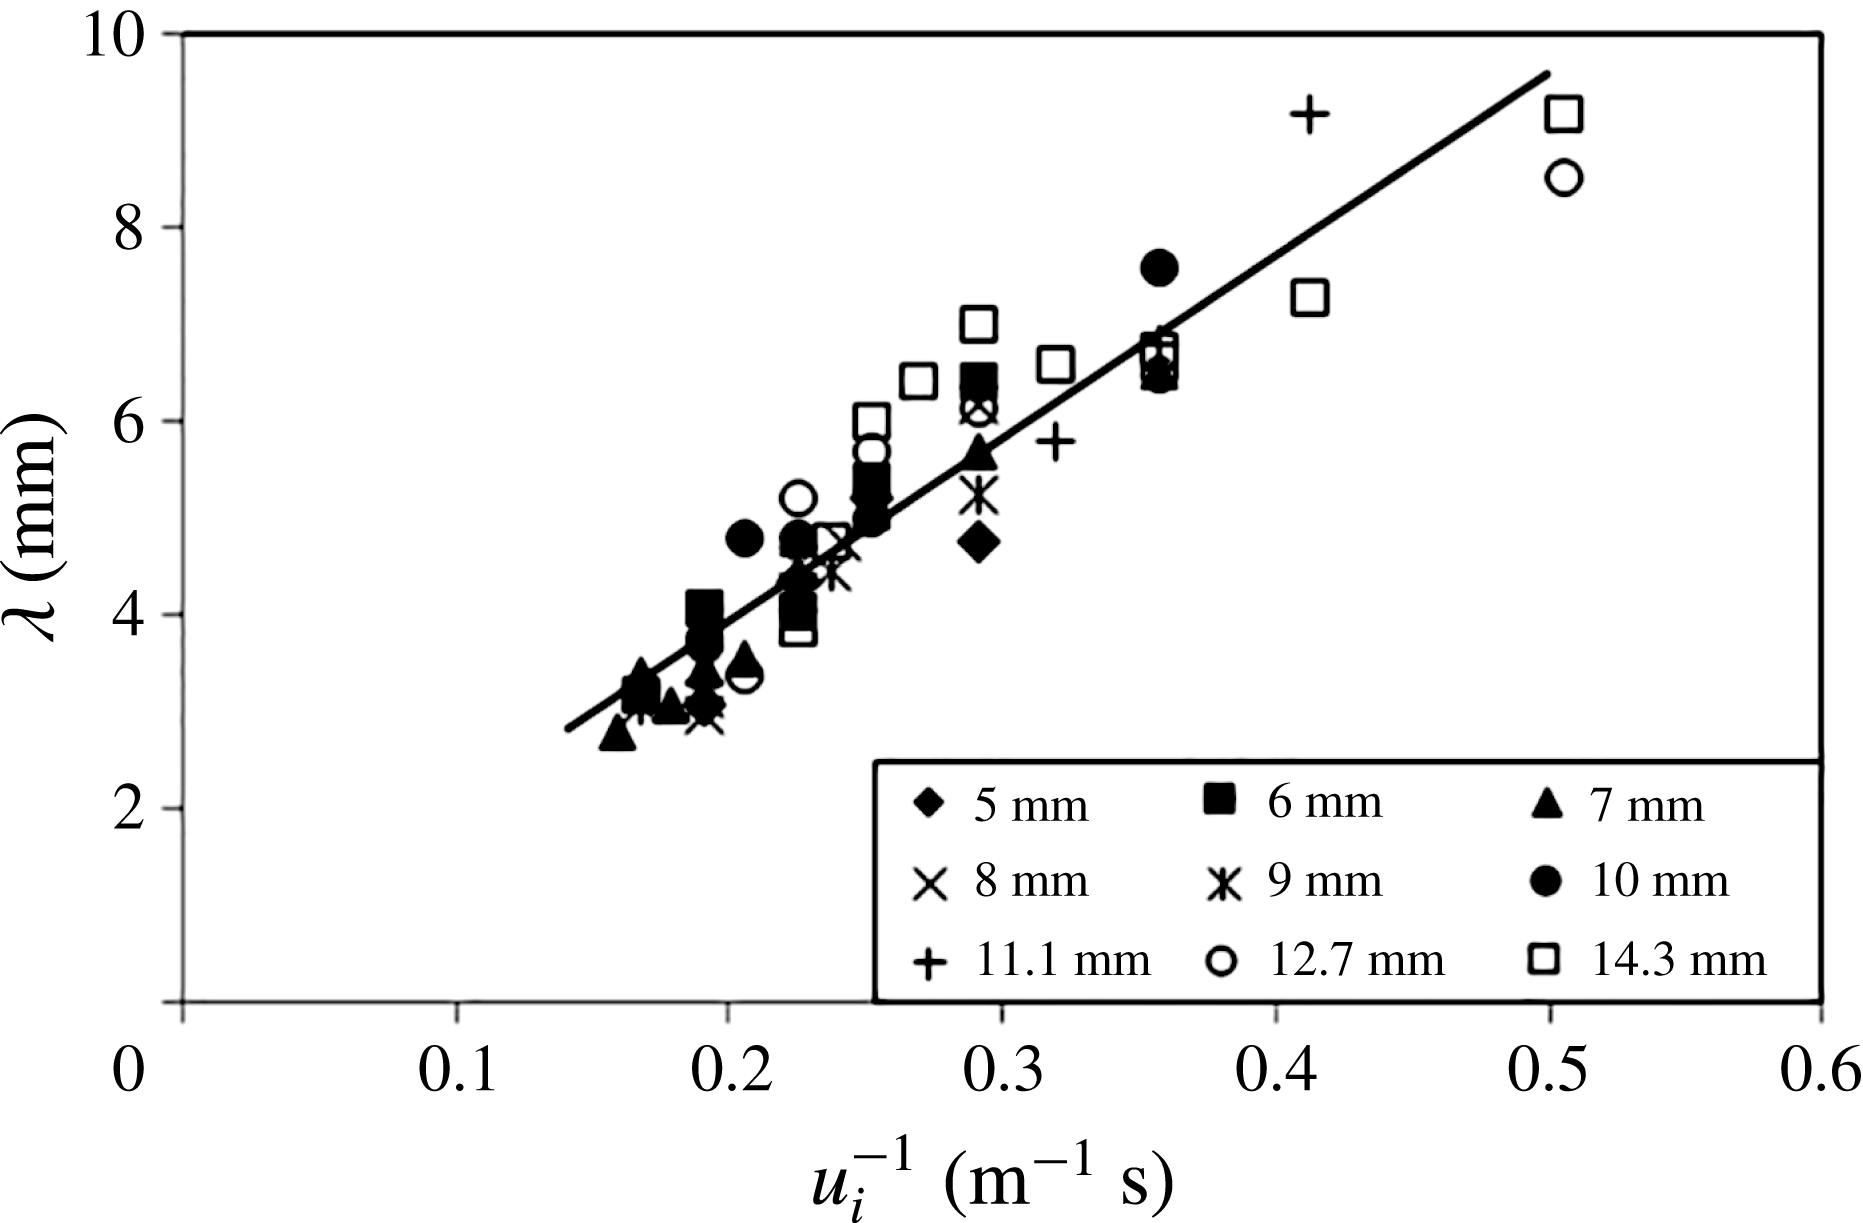
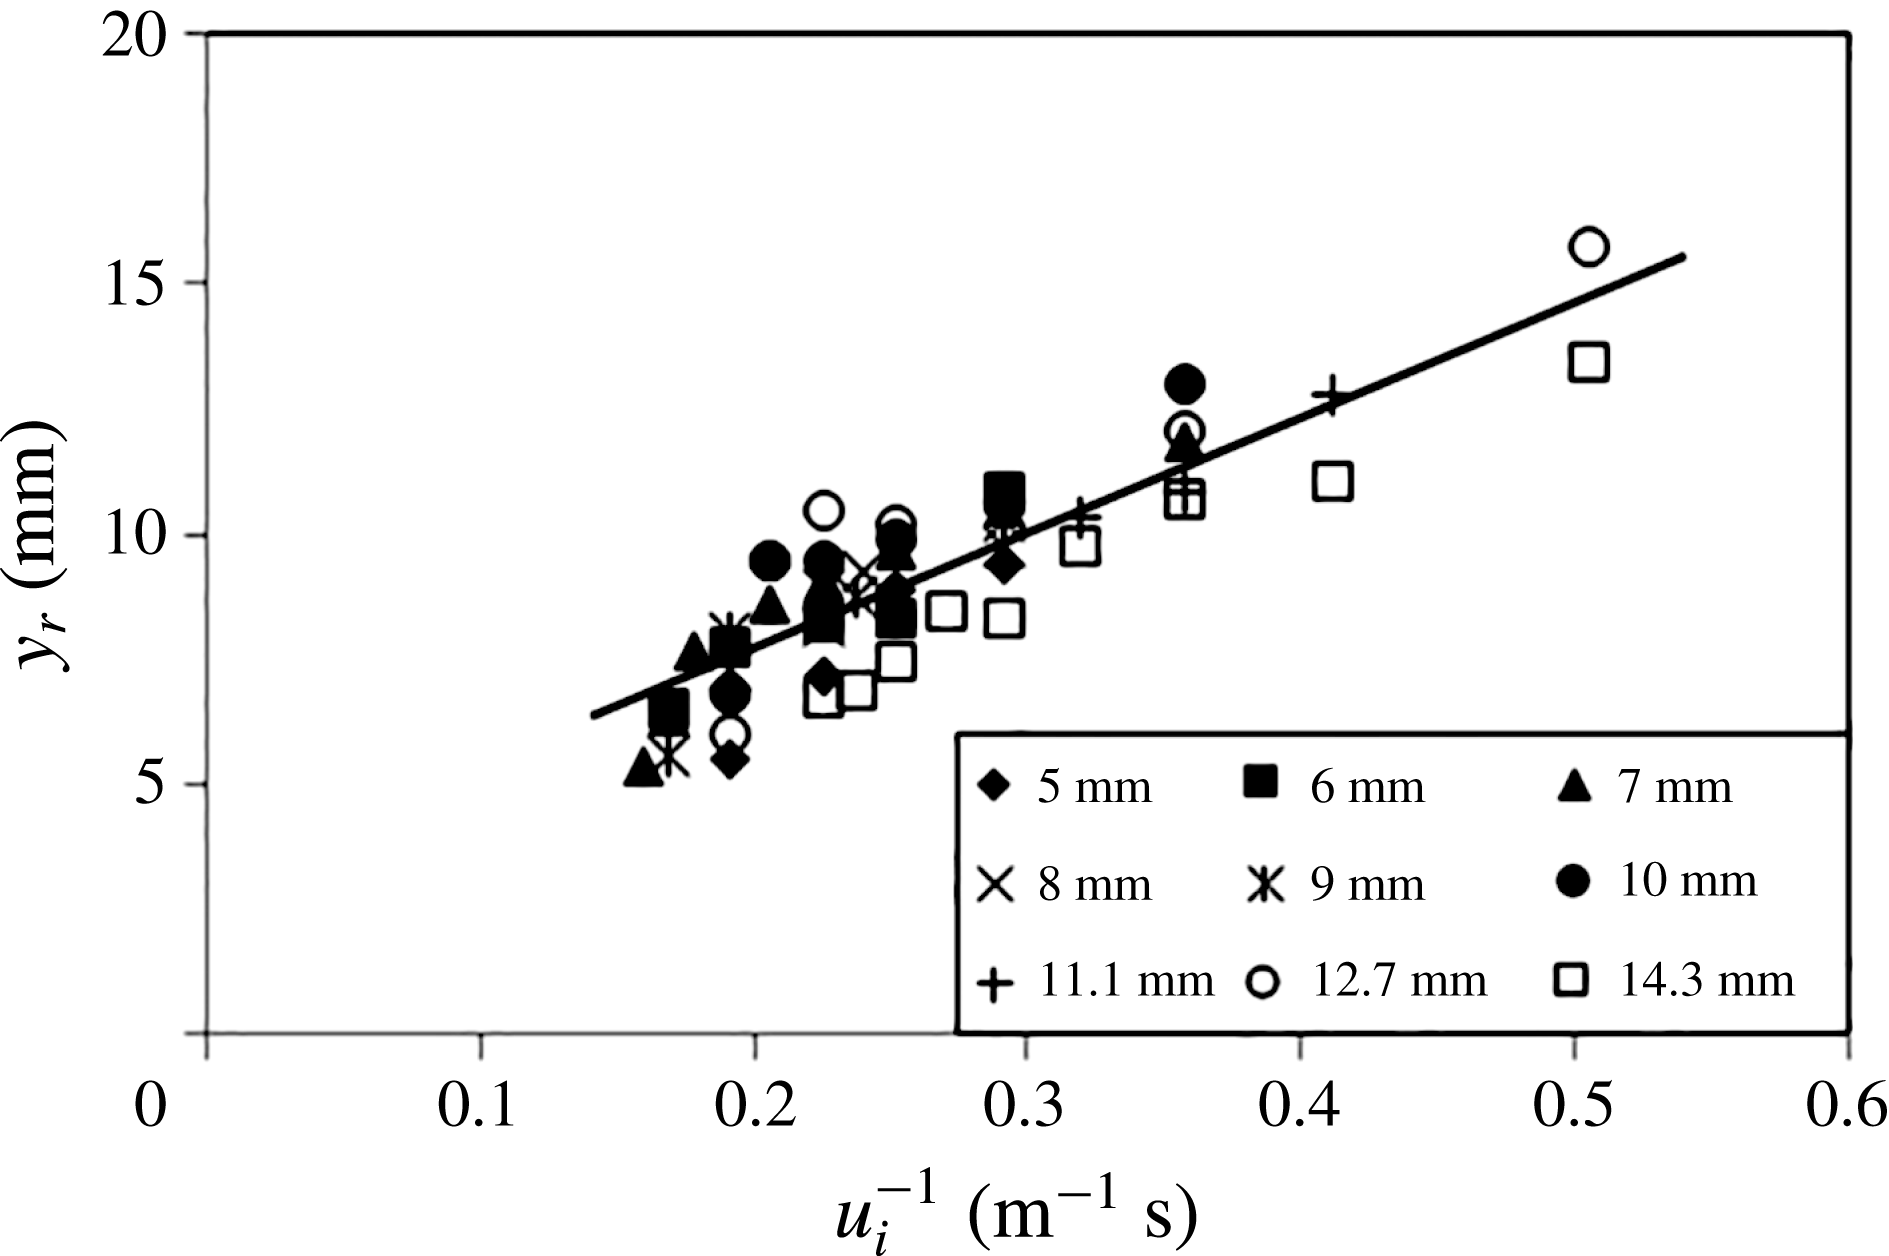
For lower impact velocities it was observed that three to five well-developed ripples were formed along the cavity walls as illustrated by figures 2–4. As the impact velocity,
 $u_{i}$
, increased the wavelength
 ${\it\lambda}$
(cf. figure 4) decreased together with the ripple-onset length
 $y_{r}$
. Figures 18 and 19 display summaries of our experimental data for the ripple wavelength
 ${\it\lambda}$
and the ripple-onset length
 $y_{r}$
, for spheres of different diameter
 $D$
, as a function of the impact velocity
 $u_{i}$
. All data in figures 18 and 19 are for impact velocities
 $u_{i}>2$
m s
 $^{-1}$
and sphere diameters
 $D\geqslant 5$
mm. Hence, for the majority of the data points the Weber number is substantially higher than
 $\mathit{We}\approx 140$
; this excludes surface tension effects. The data structures in figures 18 and 19 suggest that both
 ${\it\lambda}$
and
 $y_{r}$
are independent of the sphere diameter
 $D$
and, from figure 18, that
 ${\it\lambda}\propto u_{i}^{-1}$
.
The ripple wavelength
 ${\it\lambda}$
as a function of the impact velocity
 $u$
for spheres of different diameter
 $D$
after passing through a layer of the high-viscosity silicone oil resting above the pool of water.

The ripple-onset depth
 $y_{r}$
below the oil–water interface as a function of the impact velocity,
 $u$
for spheres of different diameter
 $D$
after passing through a layer of the high-viscosity silicone oil above the pool of water.

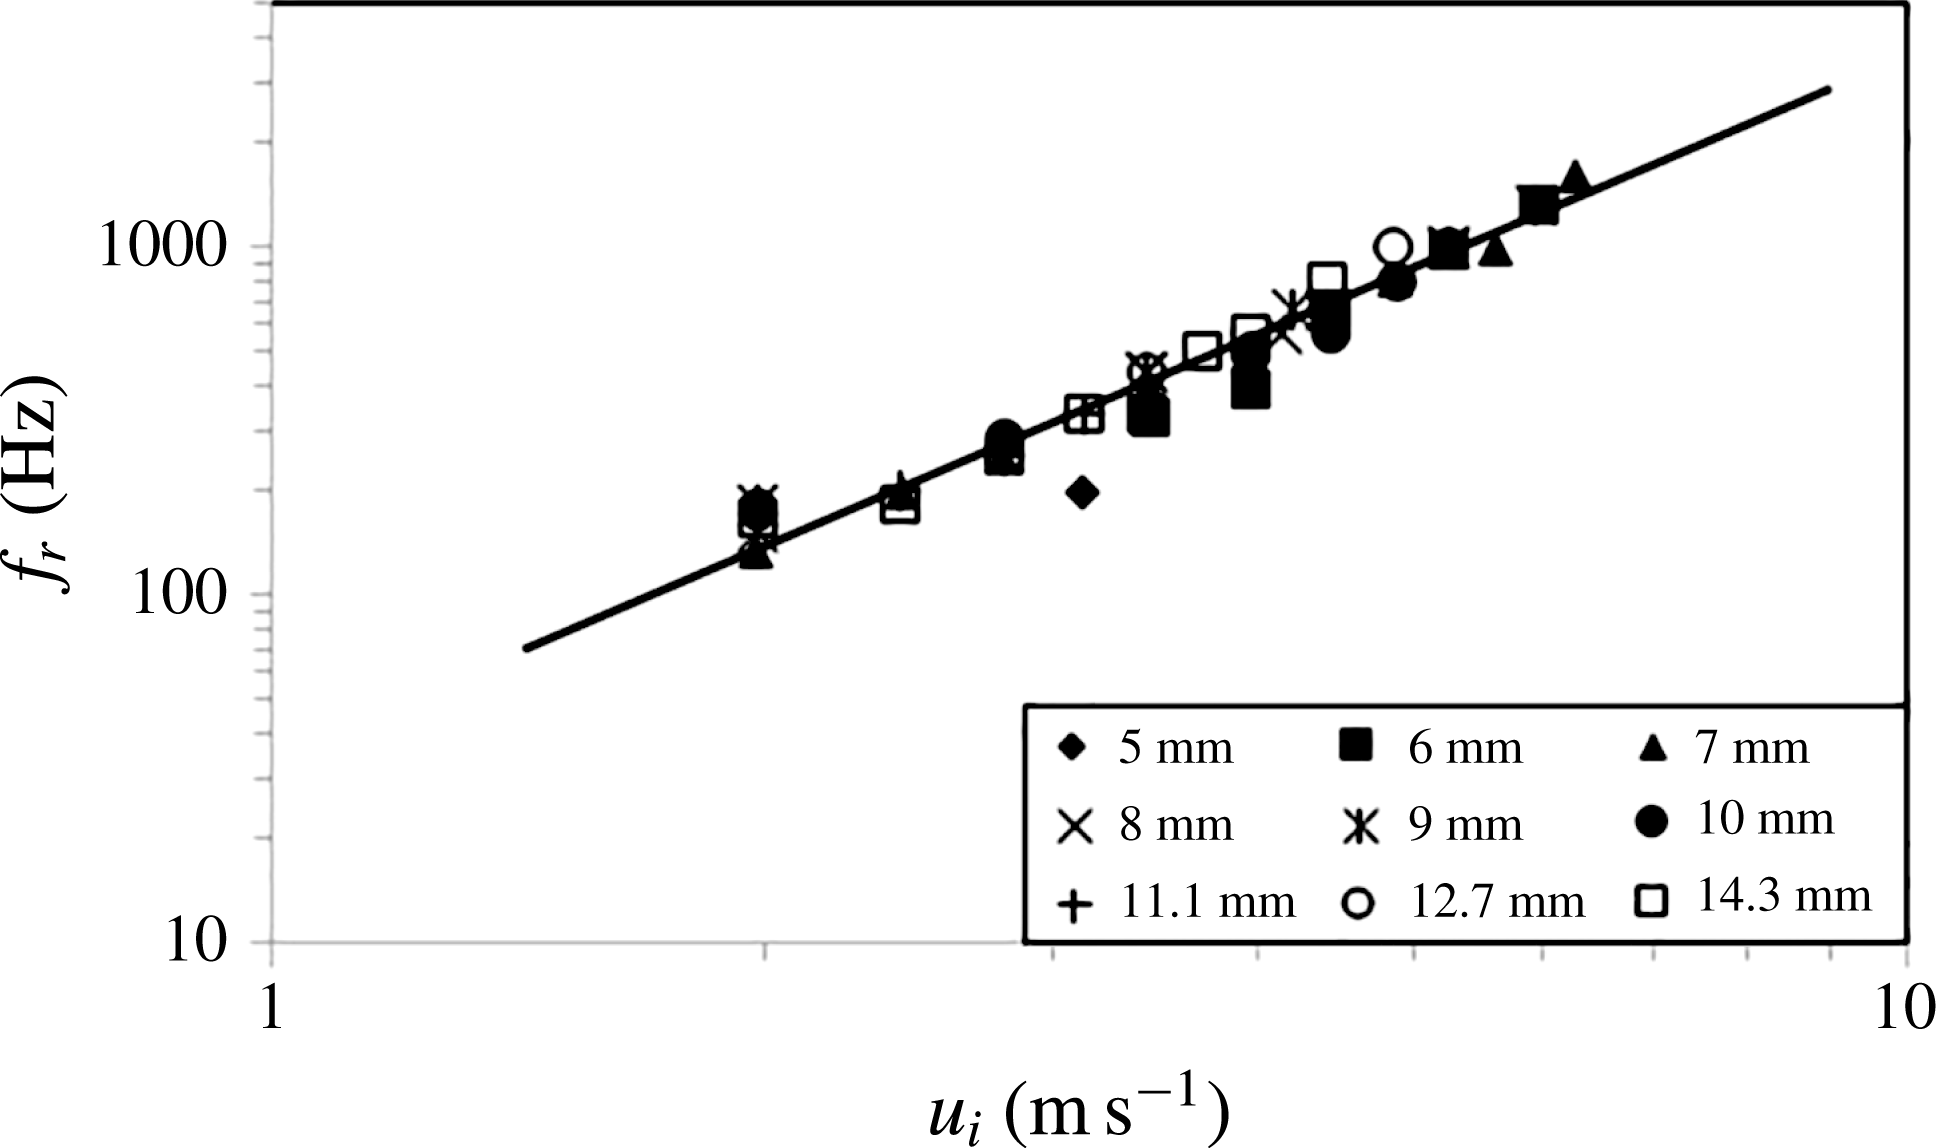
The frequency,
 $f_{r}$
, as a function of the impact velocity,
 $u_{i}$
for spheres of different diameter
 $D$
after passing through a layer of the high-viscosity silicone oil above the pool of water.

6.2. Ripple generation velocity
From the video recordings obtained with our high-speed camera it was possible to evaluate the time interval
 ${\rm\Delta}t_{r}$
between the generation of successive ripples and this yields a ripple-formation frequency
 $f_{r}=1/{\rm\Delta}t_{r}$
. Individual measurements of
 ${\rm\Delta}t_{r}$
for low values of
 $f_{r}<500$
Hz suggested that
 ${\rm\Delta}t_{r}$
was constant for the generation of the first three to five ripples that could normally be observed clearly. Figure 20 shows a summary of our data for
 $f_{r}$
as a function of the impact velocity
 $u_{i}$
in double-logarithmic representation. A least-squares data interpolation of the data in figure 20 yielded
 $f_{r}\propto u_{i}^{2.001}$
, i.e. the fitting exponent was extremely close to the value of two. Moreover, similar to figures 18 and 19, the data displayed in figure 20 are again independent of the sphere diameter
 $D$
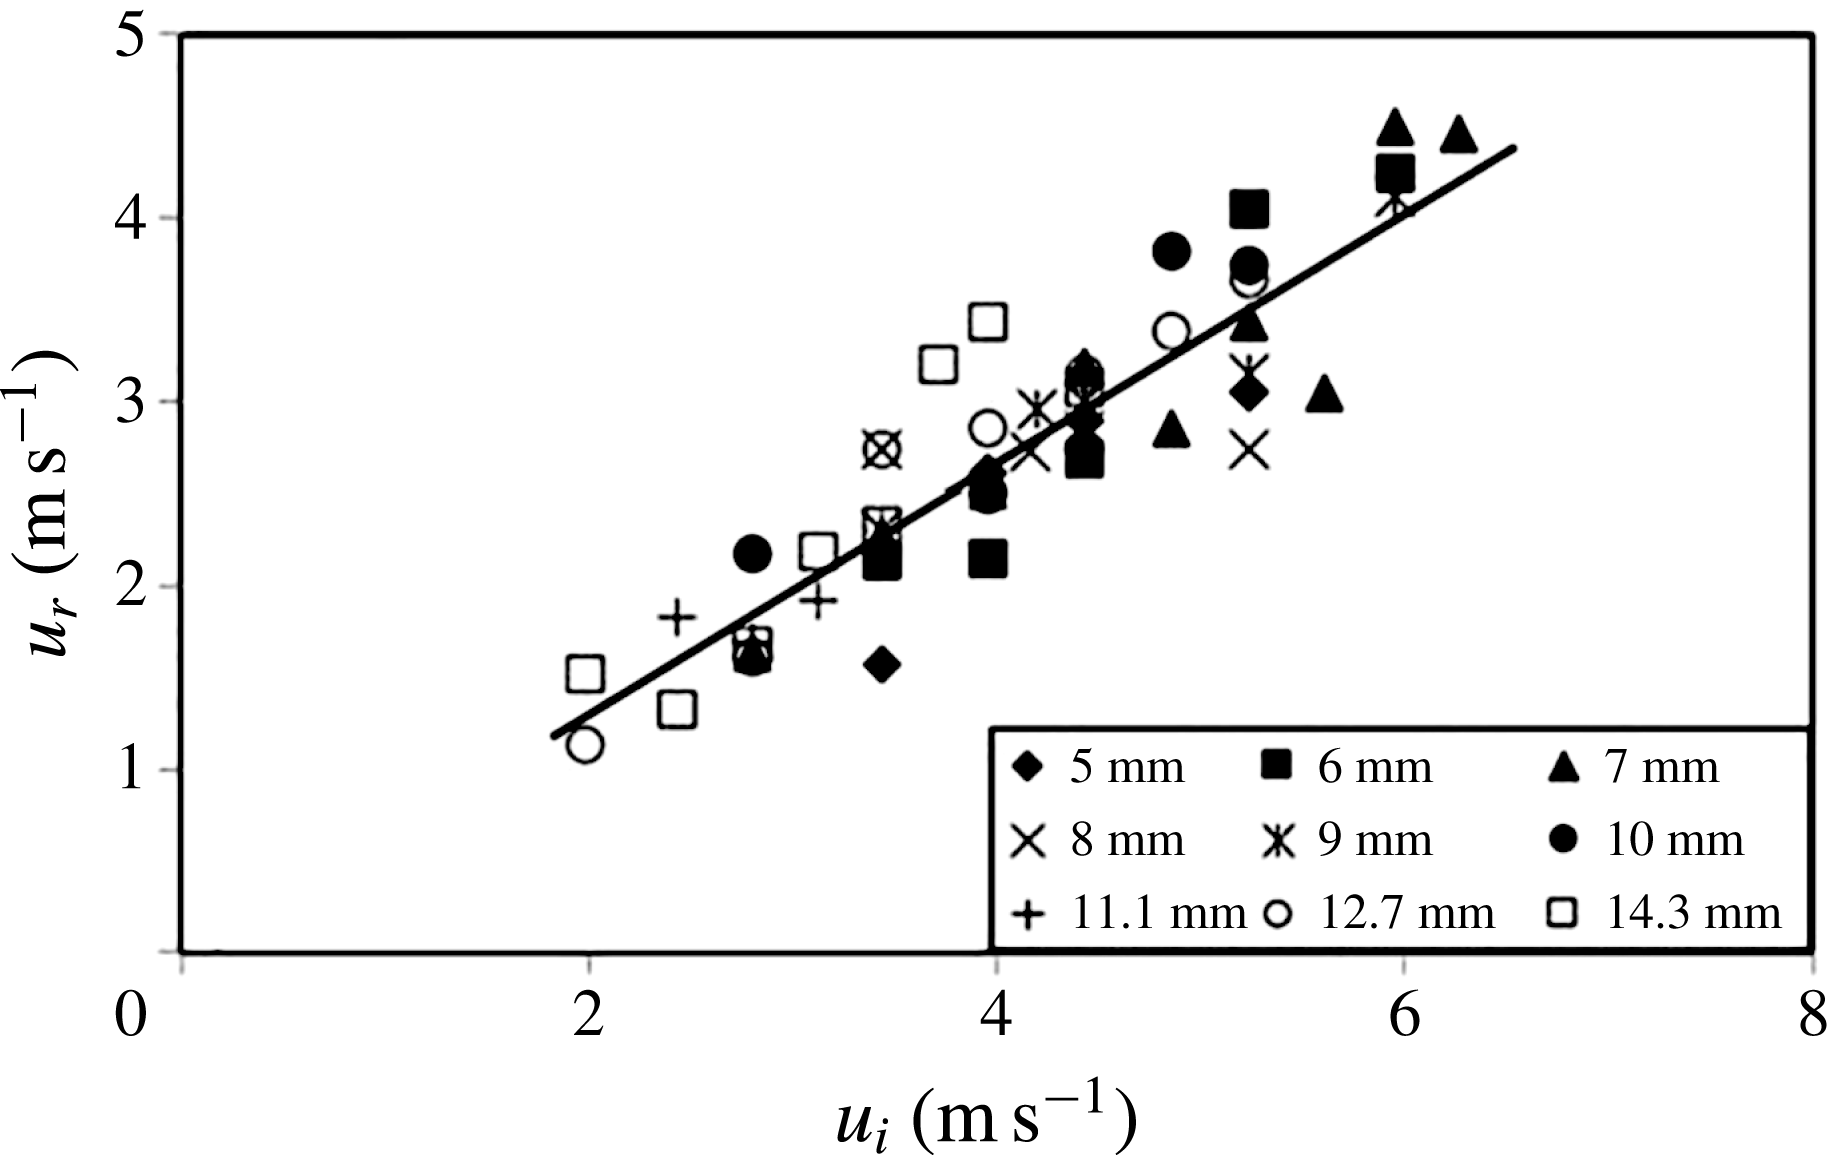
. The ripple-generation velocity,
 $u_{r}=f_{r}{\it\lambda}$
, at which the ripples appeared to be travelling relative to the moving sphere is displayed in figure 21 as a function of the impact velocity
 $u_{i}$
. Since
 ${\it\lambda}\propto u_{i}^{-1}$
and
 $f_{r}\propto u_{i}^{2}$
one expects
 $u_{r}\propto u_{i}$
and a linear least squares interpolation of the data in figure 21 yielded
 $u_{r}=0.67u_{i}$
.
The ripple-generation velocity,
 $u_{r}$
, as a function of the impact velocity,
 $u_{i}$
for spheres of different diameter
 $D$
after passing through a layer of the high-viscosity silicone oil above the pool of water.

Recall that our independently obtained result from above for the mean speed of the spheres to the instant of deep seal had yielded
 $\overline{u}=0.59u_{i}$
for the case with a layer of the high-viscosity silicone oil over water for which we obtained the ripple speed here as
 $u_{r}=0.67u_{i}$
. Since
 $0.59u_{i}\approx 0.67u_{i}$
, and since the ripple speed is measured relative to the downward-propagating sphere, this implies that both speeds cancel each other out such that the ripples are almost stationary within the reference frame of the laboratory displaying a very slight upward drift only. This conclusion can be confirmed by a close inspection and comparison of the ripples in successive photos in the sequence shown in figure 3; which reveals that the ripples do not noticeably change their position between successive frames.
6.3. Ripple growth rate
We finally consider the growth of the ripple amplitude
 ${\it\gamma}=(D_{r}-D_{c})/2$
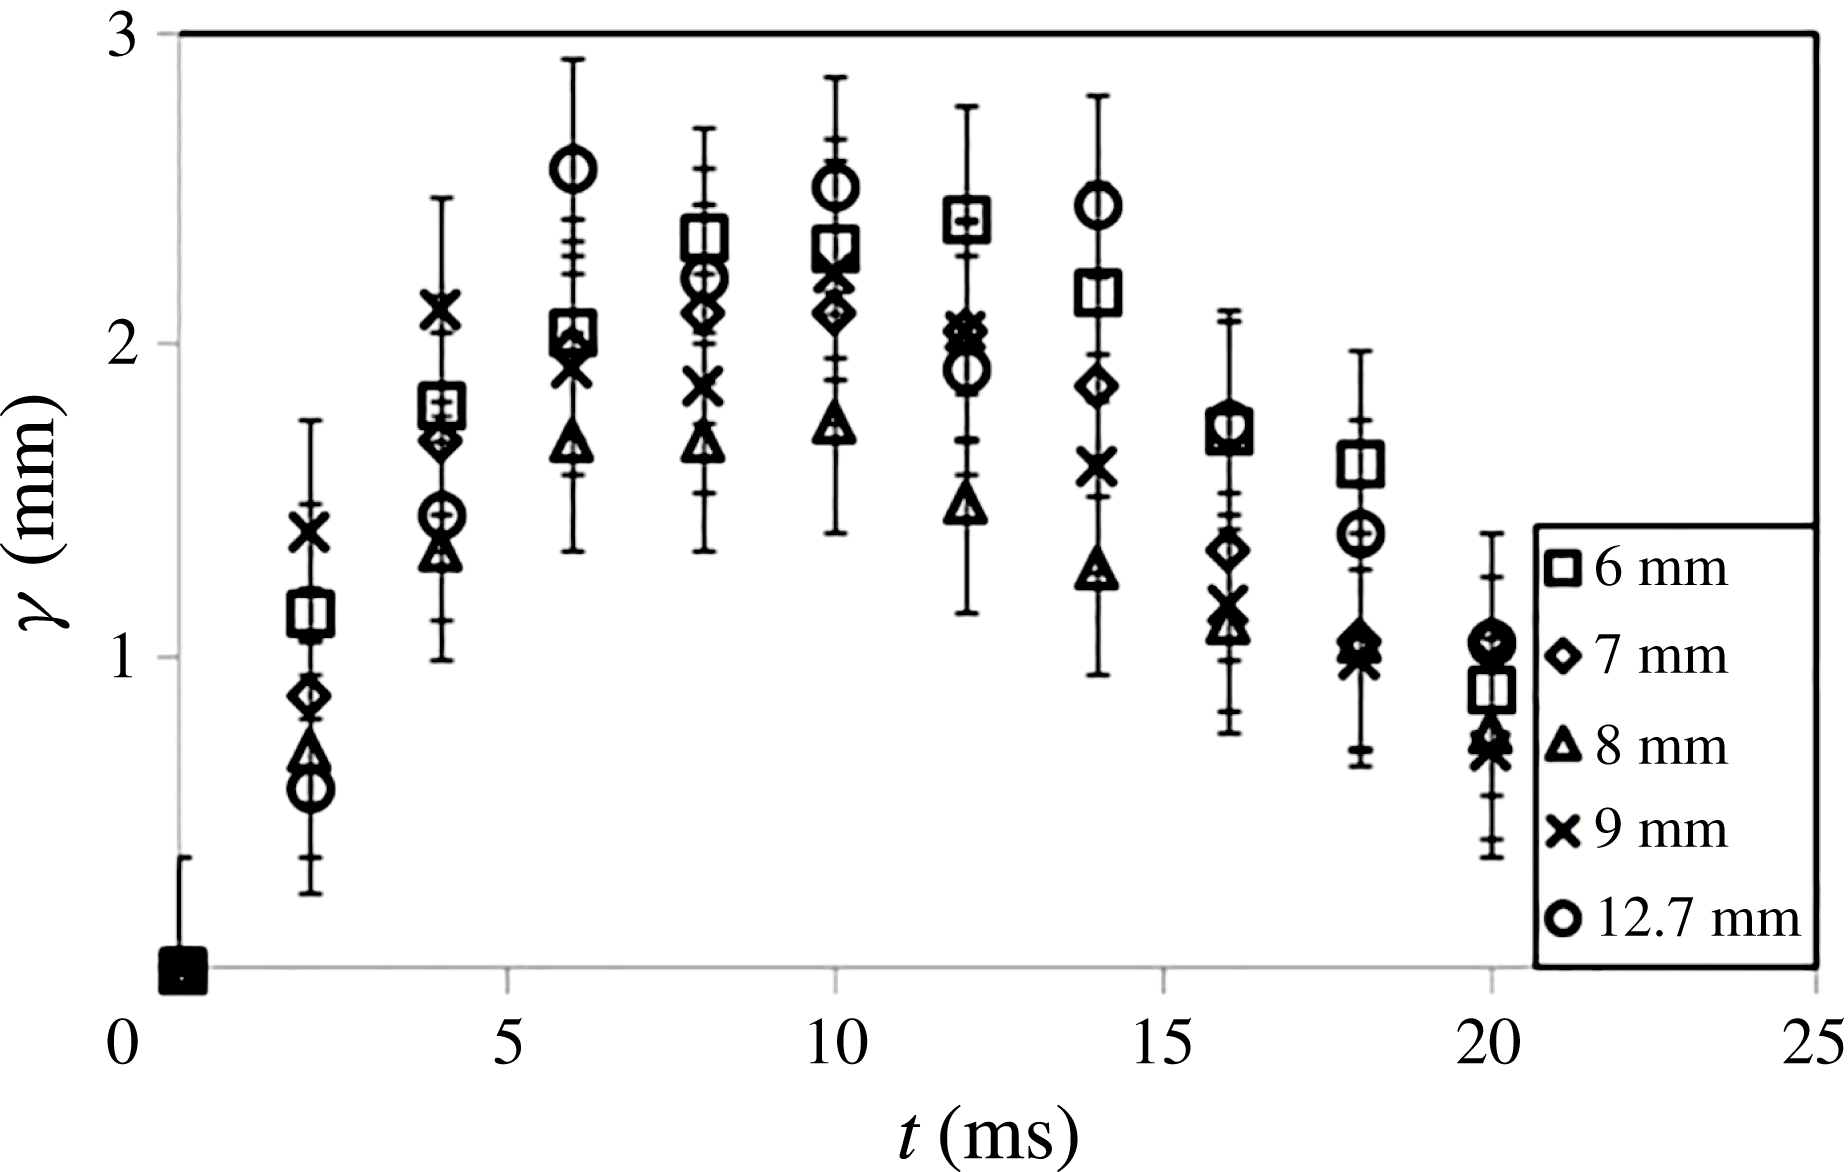
(cf. figure 4). Figure 22 displays
 ${\it\gamma}$
as a function of time,
 $t$
, where
 $t=0$
corresponds to the instant when the ripples first became apparent in the video recordings. The figure shows data sets for six different spheres with diameters
 $6$
mm
 ${\leqslant}D\leqslant 12.7$
mm and equal impact velocity
 $u_{i}=3.43$
m s
 $^{-1}$
. It can be seen that the ripples reach their maximum amplitude of about 2 mm after approximately 8–10 ms and they have disappeared again by about
 $t=25$
ms. The estimated maximum error for
 ${\it\gamma}$
associated with determining the amplitude from the video recordings is
 $E_{{\it\gamma}}=\pm 0.35$
mm corresponding to roughly
 $\pm$
17.5 %. An inspection of the data in figure 22 reveals that, within this error margin, the data do not show a dependence on the sphere diameter.
The ripple amplitude,
 ${\it\gamma}$
, as a function of time,
 $t$
, for spheres of different diameter
 $D$
but equal impact velocity
 $u_{i}=3.43$
m s
 $^{-1}$
. All data for spheres after passing through a layer of the high-viscosity silicone oil above the pool of water.

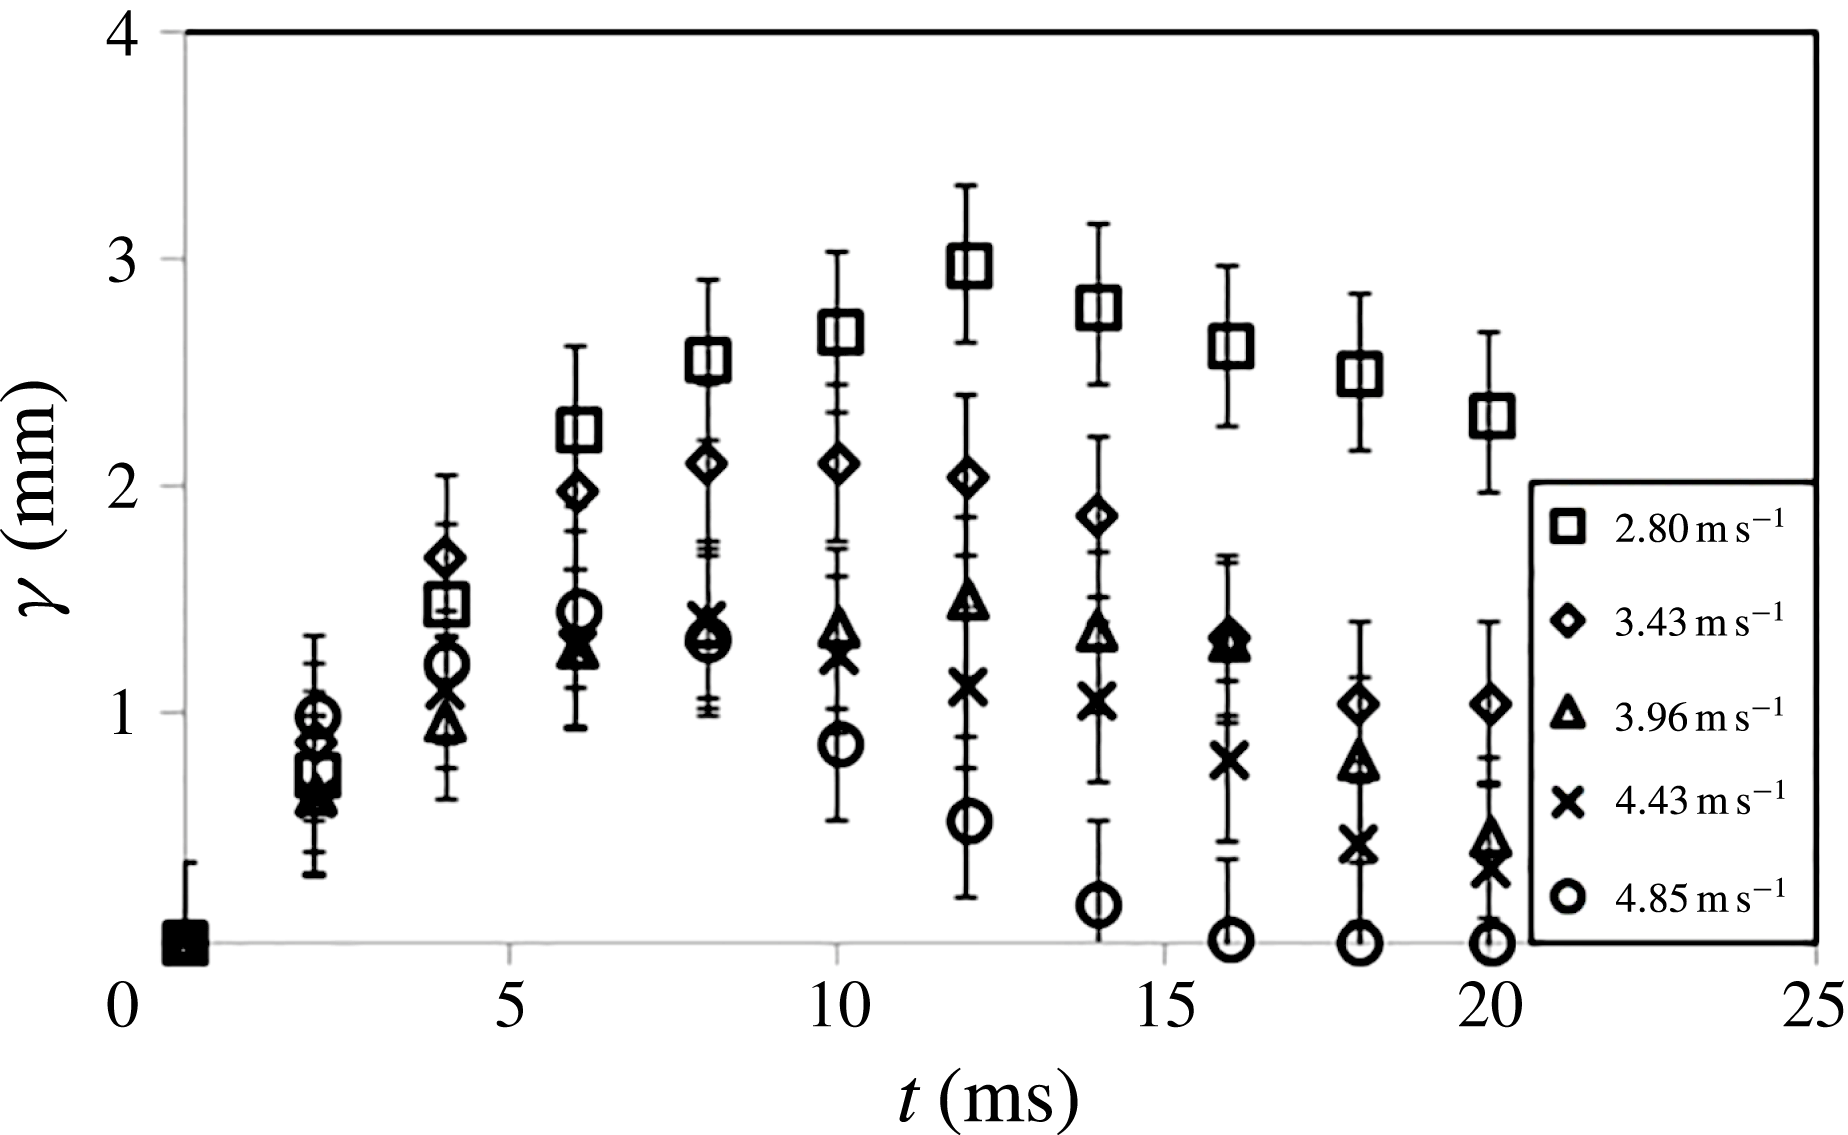
The ripple amplitude,
 ${\it\gamma}$
, as a function of time,
 $t$
, for spheres of different impact velocity
 $u_{i}$
but equal diameter
 $D=7$
mm. All data for spheres after passing through a layer of the high-viscosity silicone oil above the pool of water.

Figure 23 shows
 ${\it\gamma}$
for a sphere of diameter of
 $D=7$
mm as a function of
 $t$
but, this time, for five different impact velocities
 $u_{i}$
. The data sets reveal a clear dependence of the ripple amplitude on the impact velocity that is beyond the margin of error.
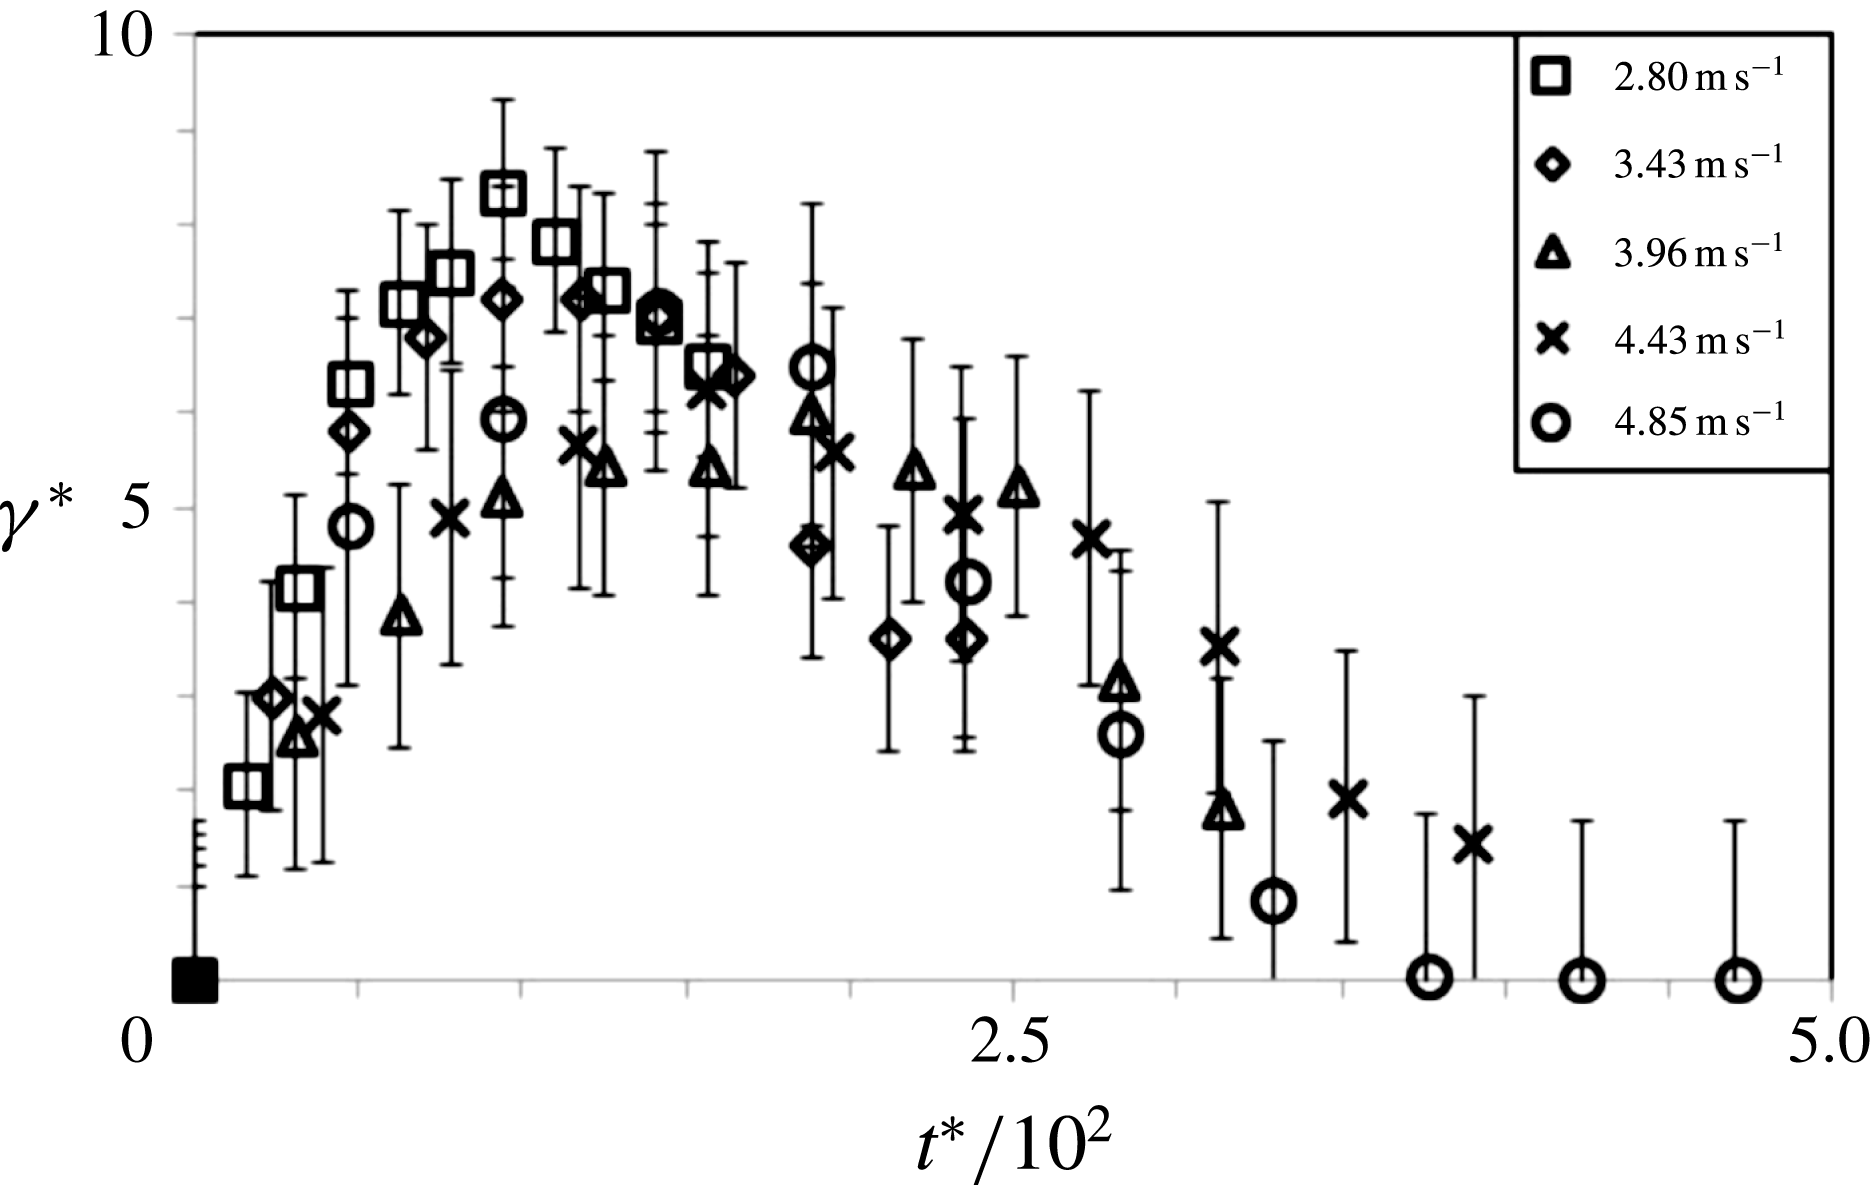
Figure 24 redisplays the data of figure 23 but here in non-dimensional form. We have non-dimensionalized the ripple amplitude as
 ${\it\gamma}^{\ast }={\it\gamma}u_{i}/{\it\nu}$
while the non-dimensional time is
 $t^{\ast }=tu_{i}^{2}/{\it\nu}$
and the extent of the error bars is
 $E_{{\it\gamma}}^{\ast }=\pm E_{{\it\gamma}}u_{i}/{\it\nu}$
. The kinematic viscosity of the liquids for these experiments was not varied and, hence, the choice whether to use the viscosity value of the water or that of the silicone oil for non-dimensionalizing the three quantities is arbitrary. We have used the kinematic viscosity of the high-viscosity silicone oil,
 ${\it\nu}=1000$
mm
 $^{2}$
s
 $^{-1}$
, since this yields numeric values of order unity for
 ${\it\gamma}^{\ast }$
. As figure 24 reveals the applied non-dimensionalization scheme results in a reasonable collapse of the experimental data within the error margins.
The non-dimensional ripple amplitude,
 ${\it\gamma}^{\ast }={\it\gamma}u_{i}/{\it\nu}$
, as a function of the non-dimensional time,
 $t^{\ast }=t{u_{i}}^{2}/{\it\nu}$
, where
 ${\it\nu}=1000$
mm
 $^{2}$
s
 $^{-1}$
is the kinematic viscosity of the high-viscosity silicone oil. Data for spheres of different impact velocity,
 $u_{i}$
, but equal diameter
 $D=7$
mm. All data for spheres after passing through a layer of the high-viscosity silicone oil above the pool of water.

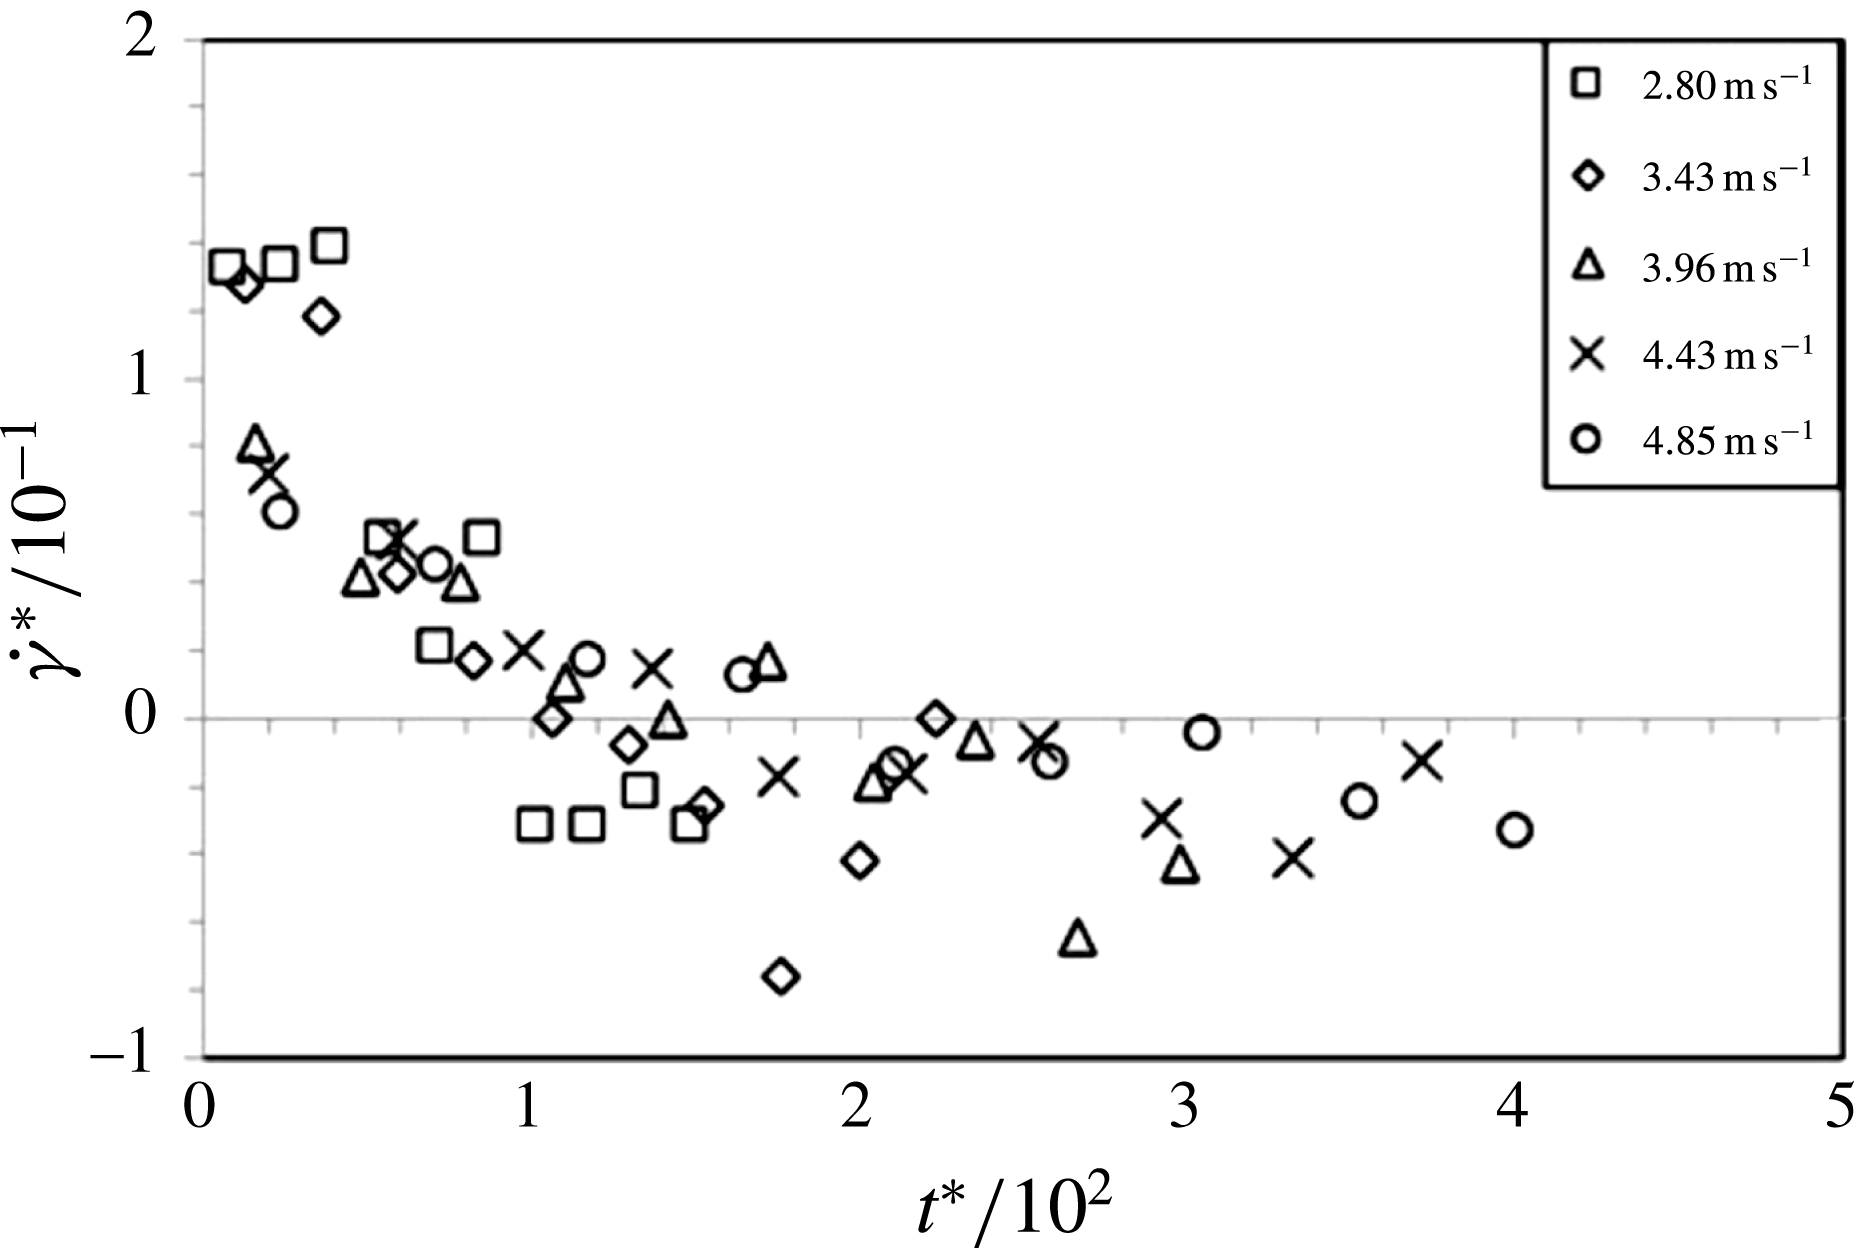
Figure 25 finally displays the non-dimensional ripple growth rate
 $\dot{{\it\gamma}}^{\ast }$
as a function of the non-dimensional time
 $t^{\ast }$
. The values for
 $\dot{{\it\gamma}}^{\ast }$
represent finite-difference approximations obtained for pairs of consecutive data points
 $i$
and
 $j$
, with
 $i<j$
, as
 $\dot{{\it\gamma}}_{j,i}^{\ast }=({\it\gamma}_{j}^{\ast }-{\it\gamma}_{i}^{\ast })/(t_{j}^{\ast }-t_{i}^{\ast })$
which we then associated with time
 $1/2(t_{j}^{\ast }+t_{i}^{\ast })$
. The figure reveals that the non-dimensional growth rate at the onset of the ripple formation is of the order of
 $\dot{{\it\gamma}}^{\ast }=0.1$
. This implies
 $\dot{{\it\gamma}}=0.1u_{i}$
, i.e. the speed of growth of the ripple amplitude, at the onset of the ripple formation, is approximately equal to
 $1/10$
th of the impact velocity
 $u_{i}$
.
The non-dimensional ripple growth rate,
 $\dot{{\it\gamma}}^{\ast }$
, as a function of the non-dimensional time,
 $t^{\ast }$
, for spheres of different impact velocity,
 $u_{i}$
, but equal diameter
 $D=7$
mm. All data for spheres after passing through a layer of the high-viscosity silicone oil above the pool of water.

6.4. Discussion of the results for the ripple instability
The ripple patterns shown here in figure 4 bear a remarkable resemblance with the ripple patterns documented in figure 3 in Grumstrup, Keller & Belmonte (Reference Grumstrup, Keller and Belmonte2007) in the photograph for the Teflon sphere shown there. Grumstrup et al. (Reference Grumstrup, Keller and Belmonte2007) comment that, to the best of their knowledge, the ripples patterns in the photograph in their figure 3 had only been mentioned twice in the literature (Worthington Reference Worthington1908; Mallock Reference Mallock1918) preceding to their own study. However, there exist some fundamental differences between the observations for the ripple patterns documented here in figure 4 and those of Grumstrup et al. (Reference Grumstrup, Keller and Belmonte2007) which essentially render it impossible that both are of the same origin.
First, unlike ourselves, Grumstrup et al. (Reference Grumstrup, Keller and Belmonte2007) investigated objects entering water with no oil layer resting above it. Moreover, they reported that their ‘large-amplitude oscillations begin at the moment of deep seal’ (cf. the paragraph above figure 3 in their paper). Here the ripples develop at the relatively shallow depth
 $y_{r}$
below the interface between the oil layer and the bottom pool of water. Finally, Grumstrup et al. (Reference Grumstrup, Keller and Belmonte2007) stated, in the same paragraph, that there exists a linear dependence of the wavelength
 ${\it\lambda}$
on the sphere diameter
 $D$
for their ripples. Nevertheless, here, in figure 18, the wavelength was independent of the sphere diameter or, if a dependence existed, it was very weak. Hence, it is essentially impossible that the ripples in Grumstrup et al. (Reference Grumstrup, Keller and Belmonte2007) are of the same origin as those observed here, despite their close resemblance.
Some of the photographs in Aristoff & Bush (Reference Aristoff and Bush2009) and in Mansoor et al. (Reference Mansoor, Marston, Vakarelski and Thoroddsen2014) also display some ripple-like deformations. However, a reference to the relevant figures in these two publications reveals that the appearance of the deformations is sufficiently different from the ripples in our figure 4 to suggest that they are not of the same origin. Moreover, similar to Grumstrup et al. (Reference Grumstrup, Keller and Belmonte2007), Aristoff & Bush (Reference Aristoff and Bush2009) and Mansoor et al. (Reference Mansoor, Marston, Vakarelski and Thoroddsen2014) did not study two-layer systems but the ripples in our figure 4 were only observed when the spheres entered such a two-layer system.
In the context of the comparison with Aristoff & Bush (Reference Aristoff and Bush2009) and Mansoor et al. (Reference Mansoor, Marston, Vakarelski and Thoroddsen2014) we moreover briefly comment on the overall effects of surface tension addressed there. The values calculated in § 2 for the Weber number,
 $\mathit{We}$
, and the Bond number,
 $\mathit{Bo}$
, which are most likely underestimates, suggest that surface tension probably does not play a major role in the onset and the development of the ripples in figure 4.
Since the appearance of the ripples in the photograph in our figure 4 suggests that the developing patterns might be associated with vortex structures shed from the sphere we have investigated this option. Our data analysis for the ripple generation velocity in § 6.2 has shown that
 $u_{r}=0.67u_{i}$
. The value
 $u_{r}/u_{i}=f_{r}{\it\lambda}/u_{i}=0.67$
represents the Strouhal number,
 $\mathit{St}$
, commonly used in the context of vortex shedding from bodies. A summary of some classic experimental data for the dependence of the Strouhal number on the Reynolds number for spheres is shown in figure 3 of Sakamoto & Haniu (Reference Sakamoto and Haniu1990).
We calculated the Reynolds numbers associated with those data in the phase diagram in figure 14 for which rippling occurred. For these experiments, involving the high-viscosity silicone oil as the top-layer fluid, we found
 $16\,000\leqslant \mathit{Re}\leqslant 67\,000$
, when
 $\mathit{Re}$
is based on the kinematic viscosity of the ambient water, or
 $16\leqslant \mathit{Re}\leqslant 67$
when based on the kinematic viscosity of the silicone oil coating the sphere. Reference to figure 3 in Sakamoto & Haniu (Reference Sakamoto and Haniu1990) reveals that
 $\mathit{Re}<67$
is too low for vortex shedding to occur. The other case, where
 $\mathit{Re}>16\,000$
, is above the critical value
 $\mathit{Re}\approx 10\,000$
for which data points on the high-mode branch exist and where
 $\mathit{St}\approx 0.2$
on the low mode-branch. The displayed data extrapolation shown for the high-mode branch at
 $16\,000\leqslant \mathit{Re}\leqslant 67\,000$
would suggest approximately
 $3<\mathit{St}<8$
in this region. Since we found
 $\mathit{St}=0.67$
for our ripples it is consequently highly unlikely that vortex shedding is an option to explain their origin. According to the data in figure 3 in Sakamoto & Haniu (Reference Sakamoto and Haniu1990) vortex shedding would only represent a realistic option for about
 $1000<\mathit{Re}<4000$
where one would, however, indeed expect approximate values
 $0.3<\mathit{St}<1$
.
Note that Grumstrup et al. (Reference Grumstrup, Keller and Belmonte2007) found (cf. their figure 4 and comment in paragraph above their figure 3), similar to the present study, that the Strouhal number,
 ${\it\lambda}f/u_{i}$
for their ripple patterns was also independent of the Reynolds number (
 $\mathit{Re}\sim 6\times 10^{4}$
) and that they obtained
 $\mathit{St}=1.0$
, compared with
 $\mathit{St}=0.67$
in our present experiments at similar Reynolds numbers. Moreover note that the conclusion reached here that the patterns in our figure 3 are not related to vortex shedding is consistent with Truscott et al. (Reference Truscott, Epps and Techet2012, p. 194) who comment on their particle image velocimetry measurements, and cite supporting results by Bergmann et al. (Reference Bergmann, van der Meer, Gekle, van der Bos and Lohse2009), by stating that their cavity-forming cases exhibited very little vorticity in general and no organized vortical structures in the wakes.
Since the ripple patterns on the cavity walls observed here cannot be of the same acoustic origin as those in Grumstrup et al. (Reference Grumstrup, Keller and Belmonte2007) and since they can neither be due to vortex shedding we suspect that they arise as a consequence of the shear forces established between the oil film coating the sphere and the ambient water. This is supported by the collapse of the data for different impact velocities
 $u_{i}$
for the non-dimensional ripple growth and growth rate in figures 24 and 25, respectively. Moreover, since the data for the ripple growth
 ${\it\gamma}$
were found to be independent of the sphere diameter
 $D$
in figure 22 the nature of the developing instability appears to be two-dimensional; in the sense that it only depends on the local flow characteristics at the location where ripples develop but not on the global flow structure and geometry surrounding the sphere. This is also consistent the ripple wavelength,
 ${\it\lambda}$
, the ripple-onset length,
 $y_{r}$
, the ripple frequency,
 $f_{r}$
, and the ripple-generation velocity,
 $u_{r}$
, in figures 18–21 all scaling linearly with the impact velocity and all four quantities being independent of the sphere diameter. The ripple origin being the shear between the ambient water and the oil film on the sphere would furthermore explain why the ripples become most prominent shortly after the entry of the spheres into the pool of water, when there is ample oil present on the sphere and in its vicinity, and why the ripples become less prominent at later stages of the sphere motion when the bulk of the entrained oil has been shed from the sphere and left behind in its wake.
7. Conclusion
We have summarized results from an experimental study investigating cavity formation in the wake of free-falling spheres submerging into a stratified two-layer system of immiscible liquids. The results presented and discussed have shown that the dynamics associated with cavity formation behind spheres impinging on, and entering, the type of two-layer system studied here differ significantly from the corresponding dynamics for a single-fluid system. We have described that the structure of the enclosing liquid boundary of the cavity is modified in that it develops ripple-like instability structures whereas the boundary is smooth for the well-studied corresponding case of single-layer (homogeneous) systems. The discussion of the data presented has suggested that the ripple instabilities are associated with the spheres acquiring an oil coating while passing through the oil layer and that it is highly likely that they arise as a consequence associated with the shear forces acting between the oil film covering the surface of the spheres and the ambient water. Additional support for this conclusion was provided by flow visualizations from test runs whereby spheres were pre-coated with oil prior to dropping them into a pool of homogeneous water with no oil layer resting at its surface.
The data analysis has revealed that the ripple wavelength,
 ${\it\lambda}$
, the ripple-onset length,
 $y_{r}$
, for which the ripples first form, the relative velocity,
 $u_{r}$
, between the spheres and the ripples on the cavity wall in their wake as well as the speed of growth of the ripple amplitude are all independent of the sphere diameter but that all scale linearly with the spheres’ impact velocity,
 $u_{i}$
. In particular, the speed of growth of the ripple amplitude, at the onset of the ripple formation, was found to be equal to approximately one tenth of the impact velocity. It was argued that the insensitivity of these four quantities to the sphere diameter suggests that the initiation of the ripple growth depends on the local flow conditions at the location of the ripple onset only and that the instability is not affected by the overall, global three-dimensional flow field surrounding the sphere. Hence, it was concluded that the nature of the instability is two-dimensional. The ripple patterns from our current study were briefly compared to remarkably similar patterns observed in a study by Grumstrup et al. (Reference Grumstrup, Keller and Belmonte2007) but it was discussed that it is impossible that both structures have the same origin if the interpretations and conclusions in Grumstrup et al. (Reference Grumstrup, Keller and Belmonte2007) are correct.
Our study furthermore revealed that the process of deep seal, which was previously investigated by Truscott & Techet (Reference Truscott and Techet2009a ) for spheres entering into a pool of homogeneous water with no oil layer resting above it, occurs in a qualitatively similar way for our current stratified two-layer system of immiscible liquids. The deep-seal depth and the deep-seal time, as defined in Truscott & Techet (Reference Truscott and Techet2009a ), was investigated for two-layer oil–water systems and for single-liquid systems of sunflower oil and the twenty-fold more viscous silicone oil. From these measurements we initially found that our data for the deep-seal time for single-liquid sunflower oil and silicone oil is in good quantitative agreement with the data of Truscott & Techet (Reference Truscott and Techet2009a ) for water. However, our results also revealed that for our two-layer systems of sunflower oil above water and silicone oil above water both the deep-seal depth and the deep-seal time are modified in comparison to Truscott & Techet’s (Reference Truscott and Techet2009a ) results for the single-liquid water system. The comparison and discussion of our results suggested that the differences arise in connection with increased drag forces acting on our spheres that have acquired an oil coating while propagating through the top layer of oil and before entering the pool of water underneath.
Supplementary movies
Supplementary movies are available at http://dx.doi.org/10.1017/jfm.2016.10.