
Introduction
Ten valid species of the genus Metagonimus (Trematoda: Heterophyidae) live in East Asia (Chai et al., Reference Chai, Murrell and Lymbery2005; Tatonova et al., Reference Tatonova, Shumenko and Besprozvannykh2018a). At least five of them have been reported as human parasites: Metagonimus yokogawai (M. yokogawai), Metagonimus takahashii, Metagonimus miyatai, Metagonimus minutus, and Metagonimus katsuradai (Chai and Jang, Reference Chai and Jang2017). The worms inhabiting the Russian Southern Far East and previously belonging to M. yokogawai according to morphological characters were described as an independent species of Metagonimus suifunensis (M. suifunensis) based on molecular data (Shumenko et al., Reference Shumenko, Tatonova and Besprozvannykh2017). It is important that these worms formerly known as M. yokogawai in the Russian Far East were included in the list of epidemiologically significant trematodes which are transmitted by food (Miropolskaya and Molochny, Reference Miropolskaya and Molochny2014; Solovyeva et al., Reference Solovyeva, Chertov and Podol'ko2015). Previous and current studies of Metagonimus representatives using molecular data did not reveal the presence of M. yokogawai at the investigated territories: in the Khabarovsk Region (Tatonova et al., Reference Tatonova, Solodovnik and Nguyen2018b), as well as in the Jewish Autonomous Region and earlier in the Primorsky Region (Shumenko et al., Reference Shumenko, Tatonova and Besprozvannykh2017).
At present, for worms of the genus Metagonimus, there are a limited number of publications concerning the analysis of their genetic diversity. Such data have only been obtained for M. suifunensis. It was established for this species that the nucleotide variability is absent, based on the use of the ITS region of nuclear DNA (Shumenko et al., Reference Shumenko, Tatonova and Besprozvannykh2017) and furthermore the level of variability is extremely low in the full-length nucleotide sequences of the cox1 mtDNA gene (Tatonova et al., Reference Tatonova, Besprozvannykh, Shumenko, Nguyen and Solodovnik2019). Based on the analysis of the latter marker, the authors proposed the hypothesis that the colonization of the studied territory by M. suifunensis occurred from the northern boundaries of its area through the Amur basin (the middle and lower Amur) to the southern parts of the Russian Far East (basins of the Ussuri, Razdolnaya Rivers and Lake Khanka).
In order to confirm or disprove the hypothesis of the distribution vector for the population of M. suifunensis in the Russian Southern Far East, we carried out additional molecular studies with two markers: the full-length sequences of сох1 and cytb genes, which were the most conservative in the analysis of the complete mitochondrial genomes for trematodes belonging to the same family or genus (Liu et al., Reference Liu, Gasser, Young, Song, Ai and Zhu2014; Na et al., Reference Na, Gao, Liu, Fu, Su, Yue, Gao, Zhang and Wang2016), which, apparently, is due to the fact that these markers have a more uniform evolutionary rate. The second marker was also used to confirm that the previously detected level of variability precisely revealed microevolutionary processes in the population of M. suifunensis, but not the evolutionary peculiarities of the cox1 mtDNA gene for this species.
Materials and methods
Sample collection
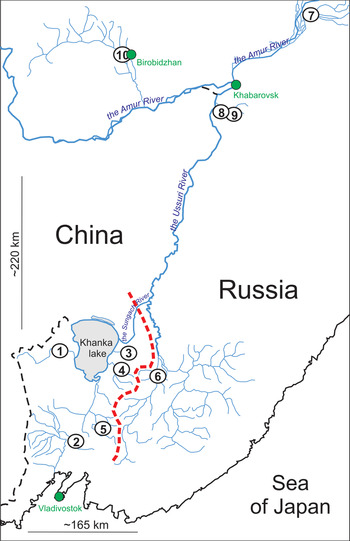
Adult worms of M. suifunensis from ten localities in the Russian Southern Far East were used in this study. They were obtained by feeding naturally infected cyprinid fish to laboratory rats (males, independent experiments for each locality) (Shumenko et al., Reference Shumenko, Tatonova and Besprozvannykh2017; Tatonova et al., Reference Tatonova, Besprozvannykh, Shumenko, Nguyen and Solodovnik2019). In addition to samples from previous studies, specimens of this species were derived from the same experiments with parasites from an additional locality in the Khabarovsk Region and one locality in the Jewish Autonomous Region. The map of sampling locations is shown in Fig. 1. The worms were stored in 96% ethanol.
Sampling locations of Metagonimus suifensis. 1 – Komissarovka, 2 – Komarovka, 3 – Sorochevka, 4 – Odarka, 5 – Ilystaya, 6 – Arsenjevka, 7 – Anuj, 8 – Odyr, 9 – Belaya, 10 – Bira. The dashed line marks the watershed between northern and southern populations.

All procedures contributing to this work comply with the ethical standards of the relevant national and institutional guides on the care and use of laboratory animals, including the National Institutes of Health guide for the care and use of Laboratory Animals (NIH Publications No. 8023, revised 1978) and the Ethics of Animal Experiments of the Federal Scientific Center of the East Asia Terrestrial Biodiversity, Russia (Permit No.: 3 on 02.06.2011).
DNA extraction, amplification and sequencing
Genomic DNA was extracted from whole 91 individual flukes of M. suifunenis using the HotSHOT method (Truett et al., Reference Truett, Heeger, Mynatt, Truett, Walker and Warman2000). The complete mitochondrial cytb gene of M. suifunenis was amplified by polymerase chain reaction (PCR) using the following primers: forward cyt1F1 (5′-GCC-TCT-CTC-CTG-TAA-GTT-AT-3′), and reverse cyt2R4 (5′-AGA-ACC-TAA-ACA-GAA-TCA-CA-3′), designed with online software OligoAnalyzer version 3.1 (https://eu.idtdna.com/calc/analyzer), and based on the sequence of M. yokogawai (KC330755). PCR was performed in a total volume of 10 μL and contained 0.5 mm of each primer, 5 μL GoTaq® Master Mix (Promega, USA), and 3 μL DNA. PCR was performed in a GeneAmp 2720 Thermal Cycler (Applied Biosystems, USA) using the following cycling conditions: an initial denaturation step of 1 min at 95 °С; 35 cycles of 30 s at 94 °С, 1 min at 51 °С, and 2 min at 72 °С; and a final extension of 7 min at 72 °С. A negative control with both primers was included. The following newly designed primers (external and internal) were used for sequencing: cyt1F1, cyt2R4, ciF1 (5′-TCA-GGG-TGA-TTC-ATC-TTT-TT-3′), and ciR3 (5′-GGG-GCA-AAC-AAA-GGA-TTA-TTA-3′). PCR products were sequenced with the ABI 3130 Genetic Analyzer (Applied Biosystems, USA) at the Federal Scientific Center of the East Asia Terrestrial Biodiversity FEB RAS using the ABI BigDye Terminator v3.1 Cycle Sequencing Kit (Applied Biosystems). In addition, the complete mitochondrial cox1 gene was amplified for samples of M. suifunenis from two localities (the Belaya and Bira Rivers). The primers for amplification and sequencing, the composition of the reaction mixture, and PCR cycling conditions are reported in Tatonova et al. (Reference Tatonova, Besprozvannykh, Shumenko, Nguyen and Solodovnik2019).
Analysis of genetic data
The obtained sequences were visualized in FinchTV version 1.4.0, and were assembled and aligned in the MEGA version 5.03 (Tamura et al., Reference Tamura, Peterson, Peterson, Stecher, Nei and Kumar2011). The GenBank accession numbers of the sequences used in this study are listed in Table 1. The relevant sequence of M. yokogawai (KC330755) from the Republic of Korea was downloaded from GenBank to compare with the closest Metagonimus species. In addition, we used 53 cox1 sequences of M. suifunenis from Russia, which were analysed by Tatonova et al. (Reference Tatonova, Besprozvannykh, Shumenko, Nguyen and Solodovnik2019) and added 28 new cox1 gene sequences to the analysis. In total, 87 and 81 full-length sequences were analysed for the cytb and cox1 mtDNA genes with lengths of 1128 and 1539 bp, respectively. Sequence polymorphisms, amino acid variability and genetic distances (P) between samples were estimated using the MEGA program. The number of haplotypes (H) and segregating sites (S), and the level of nucleotide (π) and haplotype (Hd) diversity were detected using DnaSP version 5.10 (Librado and Rozas, Reference Librado and Rozas2009). The coalescence process for estimating the confidence intervals of the values of haplotype and nucleotide diversity was modelled in the same program (Hudson, Reference Hudson1990), along with nucleotide distribution (Rogers and Harpending, Reference Rogers and Harpending1992) and mismatch distribution graphs. For estimations of the differentiation values between geographical populations, Fst was calculated in Arlequin version 3.11 (Slatkin, Reference Slatkin1991). Minimum spanning trees (MSTs) (Rohlf, Reference Rohlf1973) generated in Arlequin were used for the reconstruction of intraspecific phylogeny for the total dataset of M. suifunensis for both markers.
Complete sequences of cytb and cox1 mitochondrial genes for Metagonimus suifunensis

Accession numbers in bold are newly determined sequences.
Results
The length of the complete nucleotide sequences of the cytb gene of the M. suifunensis was similar to that of the M. yokogawai complete sequence (KC330755). The stop-codons were TAA and TAG for M. suifunensis and M. yokogawai, respectively. The P-distance based on this marker was 0.1601 (±0.0117): 161 fixed nucleotide substitutions and 23 fixed non-synonymous substitutions were found between the species.
A low level of nucleotide diversity was obtained for the total M. suifunensis population (π = 0.0016 ± 0.0005); 36 transitions and 6 transversions (1C → G, 2 G → C, 1 C → A and 2 T → G) were observed; 10 of those were parsimony informative. There were 14 non-synonymous substitutions within the total population (P = 0.0028 ± 0.0004), but only 4 of them were parsimony informative. The haplotype diversity within the total population of M. suifunensis showed a high level (Hd = 0.810 ± 0.001).
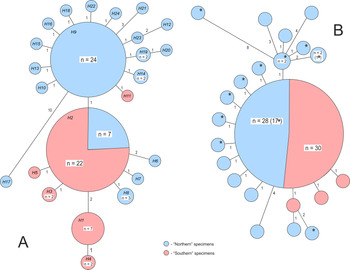
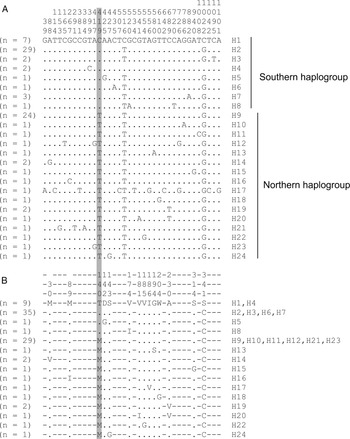
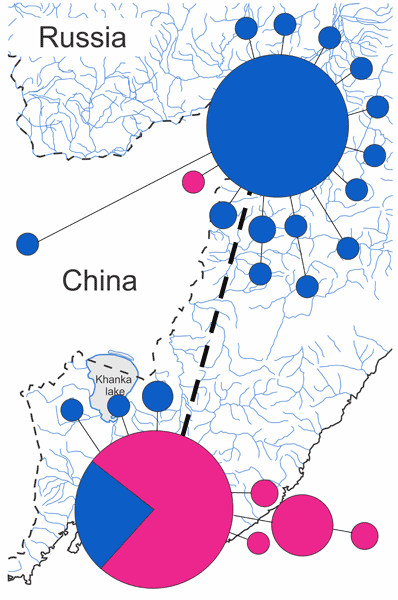
The MST for M. suifunensis based on complete nucleotide sequences of the cytb gene distinguished two groups of haplotypes, the distribution of which correlates with the geographical division of samples into northern and southern populations (Fig. 2A). The sizes of both obtained populations were similar: 41 and 46 sequences, respectively. The northern group of haplotypes included 1 sample from the south (the Odarka River), accounting for 2.4% of this group, while 12 samples from all localities of the North were found in the southern haplogroup, comprising 26% of the group. Both groups differed by one fixed substitution at position 419 bp, which results in an amino acid substitution (T → M), and consist of ancestral haplotypes, which include 24 and 29 sequences, respectively. The remaining haplotypes differed from the main haplotypes by 1–3 mutational steps (with the exception of one sample, which had 11 differences from the ancestral haplotype of the northern population) and included between one and seven samples. The Fst value between these haplogroups was 0.46 and was statistically significant (significance level = 0.05). Within the haplogroups, the value of nucleotide variability was 0.0013 ± 0.0003 and 0.0010 ± 0.0005 for the northern and southern groups, respectively, while the level of differences was higher between groups (P = 0.0021 ± 0.0009). In specimens from the northern sample, nucleotide substitutions are evenly distributed along the gene sequence. At the same time, substitutions in the sample of southern populations are absent from the 5′-end of a gene (Fig. 3). The number of haplotypes was 16 (Hd = 0.661 ± 0.086) and 8 (Hd = 0.583 ± 0.078) within the northern and southern groups, respectively (Fig. 4).
Minimum spanning trees for the cytb (A) and cox1 (B) haplotypes of Metagonimus suifunensis. n, number of specimens in haplotype; H, haplotypes for the cytb gene corresponding to Fig. 4; the number of substitutions is shown on the branches; the asterisks denote the sequences of the cox1 gene obtained in this study.

Distribution of nucleotide substitutions for the complete cytb gene sequences for northern (A) and southern (B) haplogroups of Metagonimus suifunensis. Pi, nucleotide diversity.

Variable sites of nucleotide (A) and amino acid (B) sequences of the complete cytb gene for Metagonimus suifunensis. H, haplotypes for the cytb gene corresponding to Fig. 2A; n, number of sequences in the haplotype; grey rectangle shows the nonsynonymous substitution, which divides all specimens into two haplogroups.

When analysing the extended dataset for the full-length sequences of the cox1 gene for M. suifunensis, the results did not change significantly compared to the data presented in Tatonova et al. (Reference Tatonova, Besprozvannykh, Shumenko, Nguyen and Solodovnik2019); a new cluster was formed on the MST (Fig. 2B), including five and four sequences from new localities and previously published data, respectively. All of these specimens were from the northern part of the Russian southern Far East, and this cluster did not correspond to any formation on the MST based on the sequences of the cytb gene. Nevertheless, most of the newly obtained sequences entered the ancestral haplotype, increasing the number of sequences in it from 41 (Tatonova et al., Reference Tatonova, Besprozvannykh, Shumenko, Nguyen and Solodovnik2019) to 58 (current study). The values of nucleotide and haplotype variability were 0.0008 ± 0.0002 and 0.489 ± 0.070 for this marker. It is worth noting that the identification of northern and southern haplotypes according to data on the cytb gene made it possible to reveal that, on the MST built using the cox1 gene, almost all sequences of southern populations (91%, 30 out of 33) entered the main haplotype. Thus, most of the second and third order haplotypes are formed by representatives of the northern populations (20 specimens).
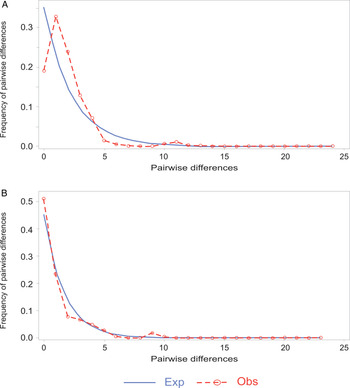
For the total population of M. suifunensis, the peak of the observed pairwise differences was in the range from 1–2 and 0–1 on the mismatch distribution graph constructed based on the cytb and cox1 genes, respectively (Fig. 5).
Mismatch distribution of the complete sequences of the cytb (A) and cox1 (B) genes of Metagonimus suifunensis. Exp and Obs, the expected and observed frequencies, respectively.

Discussion
The effectiveness of the cox1 gene sequences in the analysis of genetic diversity was previously shown for Clonorchis sinensis, the representative of family Opisthorchiidae (a sister group to Heterophyidae), which are distributed in the same geographic region (Chelomina et al., Reference Chelomina, Tatonova, Hung and Ngo2014). In comparison with a Chinese liver fluke, the level of variability in this mitochondrial marker was lower for M. suifunensis (Tatonova et al., Reference Tatonova, Besprozvannykh, Shumenko, Nguyen and Solodovnik2019). Even an increase in the sample of M. suifunensis in the present study did not provide a basis for identifying any specific patterns associated with the distribution of the parasite in the investigated area.
Analysis of the cytb gene indicated the low variability, which had analogous levels to the cox1 gene. However, values of nucleotide and haplotype variability of this marker were 2 and 1.6 times higher than for the cox1 gene. A low level of nucleotide diversity is characteristic of populations experiencing a decline, which could occur either at the edge of the population range, or as a result of the ‘bottleneck effect’ previously obtained by Tatonova et al. (Reference Tatonova, Besprozvannykh, Shumenko, Nguyen and Solodovnik2019) in the population of M. suifunensis, based on the sequences of the cox1 gene. The decrease in the population of M. suifunensis is also indicated by the high haplotype diversity and the radial structure of each haplogroup. At the same time, the mismatch distribution graphs, together with the indicators of diversity, are evidence of the introduction of a small number of individuals of the ancestral population into the study area (founder effect), as well as, probably, an insignificant age of the population. The data also indicate a rapid increase in the population at present (Nei et al., Reference Nei, Maruyama and Chakraborty1975; Slatkin and Hudson, Reference Slatkin and Hudson1991).
Despite low genetic diversity, the cytb gene revealed two haplogroups, northern and southern, that are associated with the spatial distribution of M. suifunensis in the Russian Far East. The geographical border between these groups is located between the Arsenjevka and Sorochevka rivers (Fig. 1). On the map, the collection point in the Arsenyevka river is located lower than the Sorochevka and Odarka rivers, but this locality was attributed to the northern populations, since this river flows downstream (more north) into the Ussuri River, a tributary of the Amur. Most of the southern haplotypes are represented by samples from rivers entering the Khanka Lake basin. This haplogroup also included samples from the Komarovka River, which is a tributary of the Razdolnaya River. The basin of this river is not currently connected to Lake Khanka, however, until the Middle Pleistocene, it was part of the paleo-Amur River (Belyanina et al., Reference Belyanina, Belyanin and Mityureva2009). Apparently, the ancestral haplotype of the southern haplogroup has been formed before the reorientation of the flow of the Razdolnaya River to the south. Unfortunately, it is impossible to compare geological processes with molecular data, which could more accurately date the time of population divergence, due to the low rates of variability, as was the case with the previously analysed cox1 gene (Tatonova et al., Reference Tatonova, Besprozvannykh, Shumenko, Nguyen and Solodovnik2019).
The only watercourse connecting the southern and northern populations is the rather shallow Sungach River, through which the migration of intermediate hosts is limited in both ways – this perhaps caused the differences between haplogroups, namely a fixed non-synonymous substitution. It is noteworthy that this substitution was found in the conserved region of the protein Q 0 redox centre located on the extramembrane domain of cytochrome b. Moreover, it was detected at a distance of one amino acid from the functional centre responsible for electron transport. The latter is included in the conservative area found in various animals, plants, fungi, and bacteria (Howell and Gilbert, Reference Howell and Gilbert1988; Howell, Reference Howell1989). This location, close to the functional centre, may indicate the presence of selection within the population of M. suifunensis, aimed at maintaining the two amino acid variants in the same proportion, since both variants apparently affect the adaptation abilities of the parasite in different environmental conditions of the northern and southern parts of Russian Far East.
In addition to the identified isolation between the two haplogroups, in the northern populations of M. suifunensis, samples were also found that belong to the southern haplogroup and make up a quarter of latter haplogroup. That is, the migration of the parasite in the south–north direction currently occurs. In the opposite direction, the gene flow is apparently less intense, since only one sample from the most southern locality was identified in the northern haplogroup. It is rather difficult to explain the reasons for this distribution of haplotypes within the population. First, the influence of intermediate and definitive hosts on the pattern formation is possible within the population of M. suifunensis. This assumption requires additional research on the variability of the parasite obtained from different naturally infected hosts. On the other hand, this may be due to the fact that worms from the southern haplogroup are highly resistant to various biotic and abiotic conditions, which allowed them to successfully exist in both the south and north of the Far East. The adaptive characteristics of the parasite from the southern parts of the range may also be evidenced by the formation of a conservative region in the 5′-end of the gene.
At the same time, based on the nucleotide sequences of the cytb gene, the northern populations of M. suifunensis had higher values of variability compared with southern populations and the number of haplotypes was two times greater than in the sample of southern populations (Table 2). In addition, the extrapolation of the results on the second mitochondrial marker (the cox1 gene), showed that almost all of the second and third order haplotypes in the total population are also concentrated in the northern localities, as in the analysis of the previous marker (Fig. 2B). The results obtained for both markers confirm the previously stated hypothesis regarding the spread of the parasite from the north to the south during the formation of the modern range of the parasite (Tatonova et al., Reference Tatonova, Besprozvannykh, Shumenko, Nguyen and Solodovnik2019). This is backed up by the fact that typically, a constant concentration of genetic diversity persists in the central part of the species range, while a decrease in the number of allele variants tends to characterize the species in the periphery of the territory (Lesica and Allendorf, Reference Lesica and Allendorf1995; Bunnell et al., Reference Bunnell, Campbell and Squires2004).
Descriptive statistics for genetic diversity in cytb sequences of Metagonimus suifunensis

n, number of sequences; H, number of haplotypes; S, number of polymorphic (segregating) sites; π, nucleotide diversity (±s.d.); Hd, haplotype diversity (±s.d.).
Thus, these results for an endemic Far Eastern species obtained from a wide area have made it possible to determine the vectors of its distribution and also give an insight into possible ways for further migration. These data are important for predicting the emergence of new foci of metagonimosis in the region and adjacent territories, including other countries of East and Southeast Asia, and can provide a basis for studying the variability of other equally important representatives of the genus Metagonimus, for which no information on the population structure is currently available.
Acknowledgements
We thank Dr Vladimir V. Besprozvannykh for providing parasitological material and greatly appreciate the Federal Budget Institution ‘Zapovednoye Priamurye’ for support and assistance in collecting parasitological material.
Financial support
This work was supported by RFBR, project no. 19-34-90126.
Conflict of interest
The authors declare no conflict of interest.
Ethical standards
The authors assert that all procedures contributing to this work comply with the ethical standards of the relevant national and institutional guides on the care and use of laboratory animals including fish and rats.