





1. Introduction
Massive stars are key elements to understand the current content of the Galactic Disk. They trace the recent history of star formation, govern the evolution of the interstellar medium through process of feedback and ultimately determine the chemical content of stellar populations through the enrichment of gas. Spectroscopy is, arguably, the most important technique for the study of massive and intermediate mass stars: the complex processes present in their rapidly evolving atmospheres are very diverse, and only through some specific spectroscopic features it is possible to attempt at making a proper classification. Quantitative spectroscopy is also essential for constraining models, for the study of the effects of massive stars on their environment, for a precise analysis of their kinematics and for the proper characterization of chemical tracers. Massive stars are thus the beacons that guide our understanding of the evolution of our Galaxy and other galaxies. Currently, large scale spectroscopic surveys are increasingly changing our ways to understand the universe. On one hand, they provide very robust samples that allow the increase of precision in the determination of physical parameters. On the other hand, they eventually make data available to the entire community, allowing to explore data in a wider scope, for multiple goals. Data science techniques have rapidly adapted to the large data volumes and nowadays, with the aid of machine learning and advanced statistical computations, we now have impressively large data collections at different resolutions and spectral ranges.
2. The SDSS Milky Way Mapper
The Fifth phase of the Sloan Digital Sky Survey (SDSS-V; Kollmeier et al. Reference Kollmeier, Rix and Aerts2025, in rev.) started in 2021, aiming to redefine the study of our galaxy, nearby galaxies and the large scale structure of the Universe by means of an ambitious spectroscopic program, reaching from nearby stars to far away quasars. The SDSS-V Milky Way Mapper (MWM) program is a synoptic and panoptic exploration of our Galaxy, covering both sky hemispheres with an spatially continuous sampling that explores the entire HR diagram space. It builts around the Galactic Archaeology backbone started with the SDSS-IV APOGEE-2 survey (Beaton et al. Reference Beaton, Oelkers and Hayes2021), but now it aims to explore the whole ecosystem of the galaxy. The MWM makes use of a complex fiber spectroscopy infrastructure and a robotic fiber positioning system (FPS) that is able to work simultaneously in optical (BOSS, 3600–10400 Å, R $\sim$2000) and near-IR (APOGEE, 1.5–1.7
 $\mu$m, R
 $\sim$22500). The FPS FOV is about 7 sq. deg. per field and allocates up to 500 targets per pointing. In terms of scientific output, APOGEE is able to provide precise chemical abundances (
 $\sigma\lt$0.15 dex at SNR
 $\gt$30 for 23 chemical elements) and radial velocities (
 $\sigma\lt$0.3 km/s for cool sources), and to extract spectra even from deeply embedded sources in dusty regions. BOSS provides precise stellar classification, data for dozens of well-known diagnostic lines and less precise (
 $\sigma\sim$1 km/s), but reliable radial velocities.
The MWM processes all spectra with a general pipeline, Astra, but the analysis of spectroscopic properties depends strongly on the type of star and the features present in either the optical or the near-IR range. Currently, more than a dozen spectral analysis pipelines are used for MWM. Two of them have been particularly dedicated to younger populations, including the OBA population: BOSS Net (Sizemore et al. Reference Sizemore, Llanes and Kounkel2024) and APOGEE Net (Sprague et al. Reference Sprague, Culhane and Kounkel2022), both based on convolutional neural networks, trained with thousands of spectroscopic labels from both the SDSS surveys and available literature.
The MWM selects targets from a series of pre-defined criteria or ‘cartons’ that define cuts on optical/near-IR Gaia-2MASS color-magnitude and color-color diagrams (CMd and CCd, respectively), to enclose distinct types of sources across the evolutive diagram. For OBA stars, the MWM carton is based on the selection criteria of Zari et al. (Reference Zari, Rix and Frankel2021). First, a luminous star locus is defined in the  $G_{Bp}-G_{Rp}$ vs
 $(J-K_s)_0$ CCd; second, the OBA source “core” is defined as a paralell locus in the
 $J-H$ vs
 $G-K_s$ CCd; finally, a cut is applied in the G vs
 $G-K_s$ CMd. The MWM OBA carton accounts for the expected volume increase as a function of distance up to 5 kpc, and traces most well known OB associations in both the Solar neighborhood and nearby MW spiral arms.
A recent paper by Zari et al. (Reference Zari, Villaseñor and Kounkel2025) analyzes the spatial distribution of the BOSS Net processed OBA sample, containing over 5 $\times 10^4$ sources with
 $T_{eff}\gt10$ kK. The analysis also includes age estimates from isochrone models (
 $\tau\lt300$ Myr for over 85% of the sample). They produced spatial density and galactocentric mean RV spatial distributions, comparing the youngest (
 $\tau\lt30$ Myr) population with the rest, showing that the first agrees well with known density enhancements (clusters, arms), while the second is widely distributed. The radial velocity maps show significant asymmetries with poor agreement to density enhancements (Fig. 1). Asymmetries for the OBA sample are larger than those observed in giants, and may be due to various dynamical processes in the Galactic spiral arms.
Left: density distribution of OB stars in the BOSS Net MWM sample. Center, Right: Comparison of observed RV asymmetries in the sample, with the density distribution and the location of local spiral arms, respectively.

Figure 1 Long description
Panel A: A contour plot shows the density distribution of OB stars in the BOSS Net MWM sample. The X and Y axes represent spatial coordinates in kiloparsecs (kpc). The contour lines indicate varying densities of OB stars, with denser regions shown in darker shades. Panel B: A contour plot compares observed radial velocity (RV) asymmetries in the sample. The X and Y axes are the same as in Panel A. The color scale ranges from blue to red, indicating different velocity values in kilometers per second (km/s). Panel C: Another contour plot shows the density distribution and the location of local spiral arms. The X and Y axes are the same as in the previous panels. The color scale is similar to Panel B, with blue indicating lower velocities and red indicating higher velocities. The contour lines and color gradients highlight the spatial distribution and velocity patterns of OB stars in relation to the Milky Way's spiral arms.
Another study by J. Villaseñor et al. (in prep) consists on carefully selecting the OB samples from MWM, taking advantage of multiepoch observations to measure significant peak-to-peak RV differences ( $\gt$20 km/s) in search for spectroscopic binaries (SB). Their models can predict the SB fraction with proven accuracy, as shown for a sample of 309 SMC B-type stars selected from the BLOeM campaign with VLT/Flames (
 $f_{bin}\sim0.8$, in close agreement with observations; Villaseñor et al. Reference Villaseñor, Sana and Mahy2025). This is crucial for determining how valid is the hypothesis that the SB fraction in OB stars varies in low metallicity environments as it does for solar type stars.
2.1. APOGEE near-IR spectra
The narrow APOGEE spectral window (1.5-1.7  $\mu$m) implies relying on two He II lines and a few Brackett (Br) series (11,13,15[,17]) lines for spectral classification of O [and B] stars. Synthetic atmosphere models (e.g. FASTWIND, CMFGEN) of near-IR lines have been succesfully tested against observed spectra (e.g. Repolust et al. Reference Repolust, Puls and Hanson2005; Najarro et al. Reference Najarro, Figer and Hillier2009) but models are not publicly available for testing and the literature is scarce on these specific Br lines. We made tests against a few publicly accessible CMFGEN model grids (e.g. Zsargó et al. Reference Zsargó, Rosa Fierro-Santillán and Klapp2021) but those models fail to reproduce the observed H band spectral lines of APOGEE spectra. For this reason we used, instead, the EW and FWHM of the Br lines to develop a SpT/Luminosity class classification scheme (Roman-Lopes et al. Reference Roman-Lopes, Román-Zúñiga and Tapia2018; Ram rez-Preciado et al. 2020) that provided good results (Borissova et al. Reference Borissova, Roman-Lopes and Covey2019; Roman-Lopes et al. 2020a; Roman-Lopes et al. 2020b).
APOGEE Net neural network approach takes advantage of thousands of currently available spectral labels from literature but a relative smaller proportion of direct determinations for APOGEE spectra. In most cases,  $(T_{eff}, \log{g})$ labels are inferred from
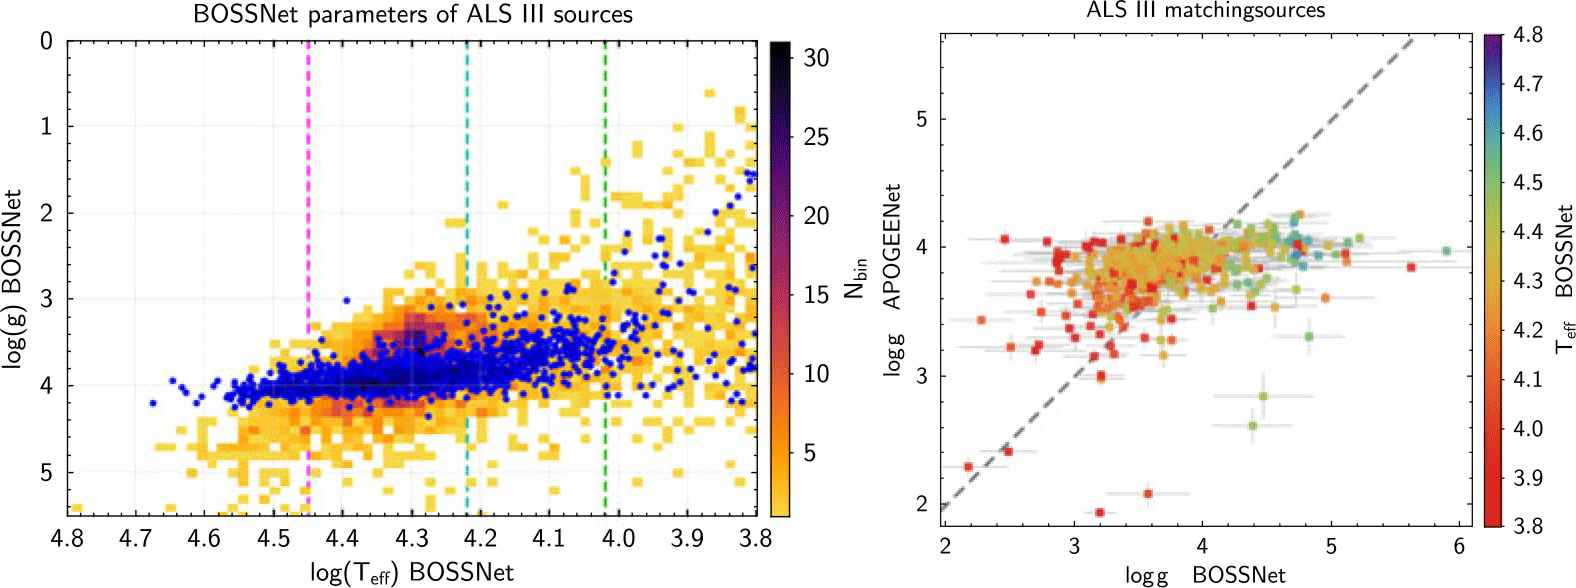
 $(L/L_\odot , \mathrm{SpT})$ in previous works. In a simple experiment, we crossmatch BOSSNet and APOGEENet catalogs against ALS III (Pantaleoni González et al. Reference Pantaleoni González, Maz Apellániz and Barbá2025). BOSSNet Logg values are consistent with expected distributions. APOGEENet
 $T_{eff}$ values appear to have an acceptable agreement with BOSSNet above
 $\log{T_{eff}}\approx4.2$, but once we directly compare
 $\log{g}$, the agreement blurs, showing a distribution of
 $\log{g}$ values that appears to be too narrow in comparison with optical determinations (Fig. 2).
Left: Kiel diagram for BOSS Net and APOGEE Net OBA sample. Right: Comparison of  $\log{g}$ values in BOSS Net and APOGEE Net

3. The SDSS Local Volume Mapper
Another very impressive program in SDSS-V is the Local Volume Mapper (LVM), a large area optical IFU survey covering HII regions from the solar neighborhood to the Local Group (Drory et al. Reference Drory, Blanc and Kreckel2024). The main goal of LVM is to resolve the physics of ionization by massive stars at scales from 0.1 to 100 pc. See also contributions by A. Lugo-Aranda, M. Villa-Durango and O. Aranguré in this volume. The LVM instrument consists of four dedicated 16 cm diameter telescopes at Las Campanas Observatory, Chile, fitted with lenslet-coupled fiber systems, and spectrographs that cover the 3600–9800 Å range at a resolution R $\approx$4000. Three of the four telescopes are used for observing sky spectra and spectrophotometric standard stars, while the science telescope is fitted with a hexagonal IFU that has a
 $\sim$0.5 degrees diameter field of view. The IFU is sampled by 1801 fibers, each with an angular diameter of 35.3 arcsec on the sky.
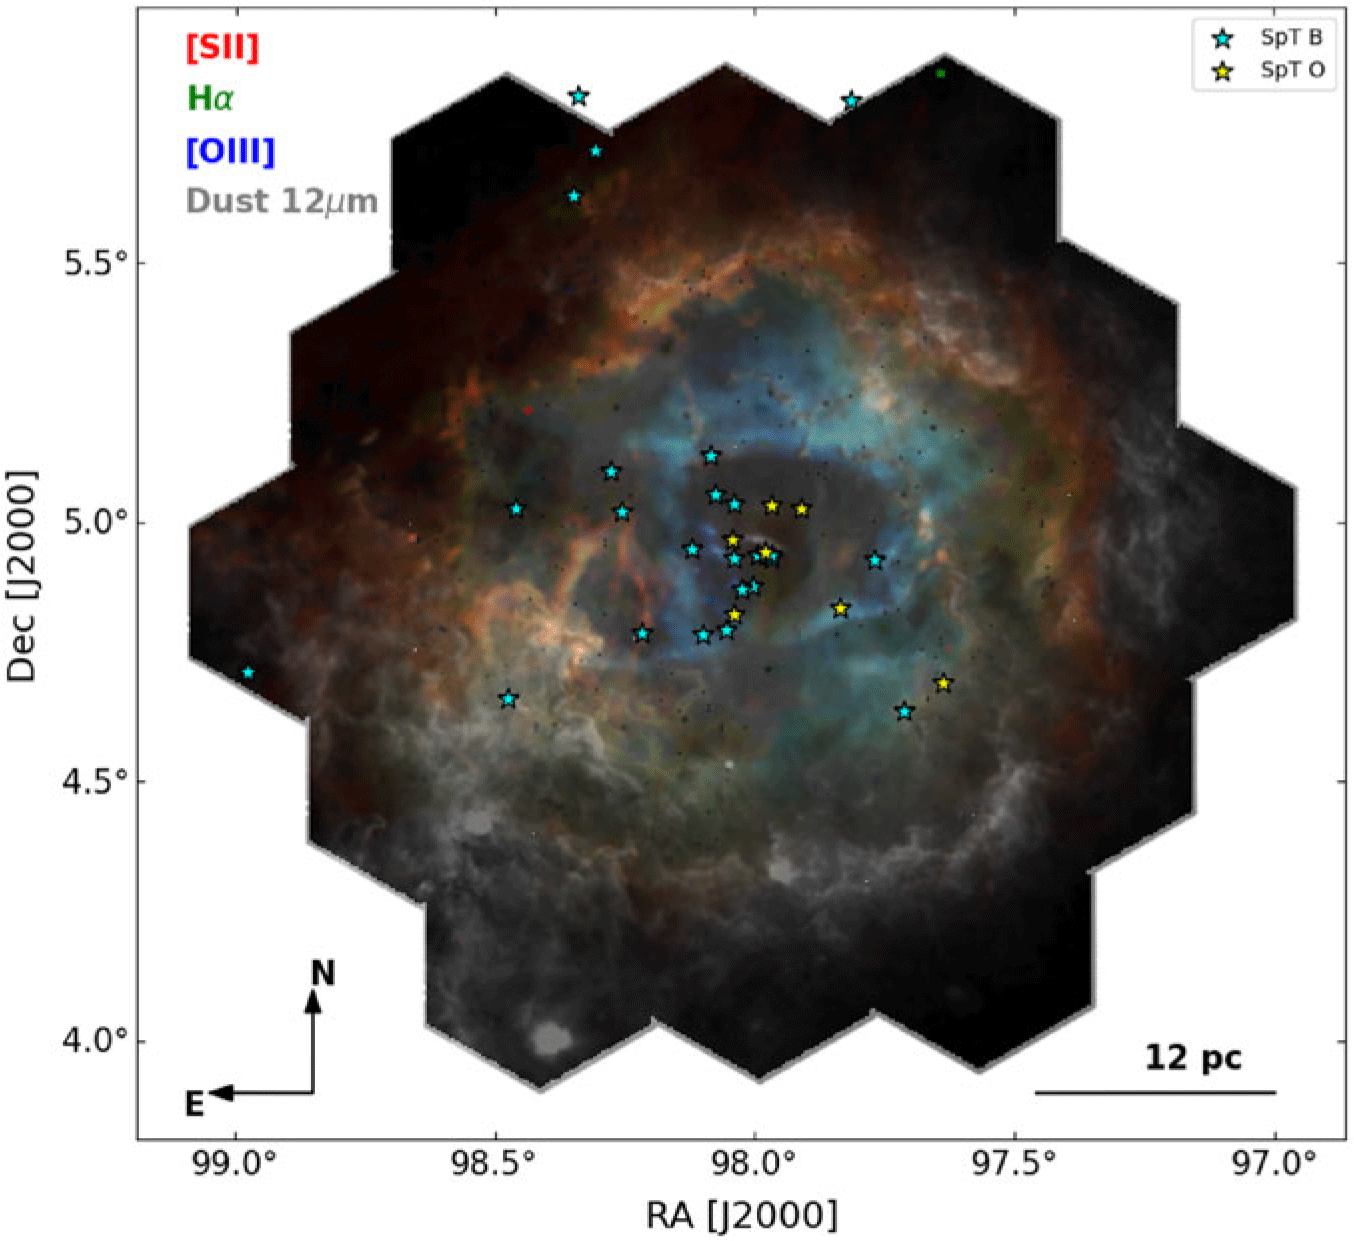
The interaction between massive stars and their local environment is now observed in exquisite detail with LVM, and the survey will allow to determine spatially resolved physical properties (temperatures, densities, kinematics) and chemical abundances of HII regions at distances from 0.5 to 50 kpc. The comissioning data allowed the construction of emission line maps and diagnostic diagrams in regions like the Orion Belt (Kreckel et al. Reference Kreckel, Egorov and Egorova2024) and the Rosette Nebula (Villa-Durango et al. Reference Villa-Durango, Barrera-Ballesteros and Román-Zúñiga2025, see Fig. 3). Near goals include comparisons of structure and kinematics with those of the local stellar population and the other phases of the ISM ( $H_2$ clouds). One important aspect of LVM will be the characterization of the stellar population in survey areas. A MWM-LVM sinergy project proposed to include all possible targets from the ALS catalogs in the MWM coverage. This will provide a robust sample of targets to characterize the massive ionizing members in the surveyed HII regions. This project also effectively expands the MWM young star science case to the Magellanic Clouds. The LVM has enormous potential for the study of the environments of massive stars, population synthesis of resolved young stellar populations and resolved physical properties in the ISM of the Milky Way, the Magellanic Clouds and other nearby galaxies.
The Rosette Nebula rendered from LVM data and WISE ([OIII] (blue), H $\alpha$ (green), and [SII] (red), WISE 12
 $\mu$m (gray)). The image reveals many ionized gas structures and the surrounding dust distribution. O- and B-type stars are marked with star symbols, in yellow and cyan, respectively.

Acknowledgements
C. G. R-Z acknowledges support from project UNAM-DGAPA-PAPIIT IG101723

 logg
 α
 μ

 Open access

