Introduction
Securing adequate food and nutrition is essential, not merely for our survival but also for the maintenance of our health and function. In modern societies we have looked to the market to manage the risks associated with food supply, yet food security is increasingly discussed as a matter of concern in many economically developed countries, including the UK (DEFRA, 2006). Food insecurity exists when people do not have the physical or economic access to obtain sufficient quantities of nutritious food (FAO, 1996). Nutrition insecurity is more specific and can be defined by the failure to meet recommended dietary guidelines.
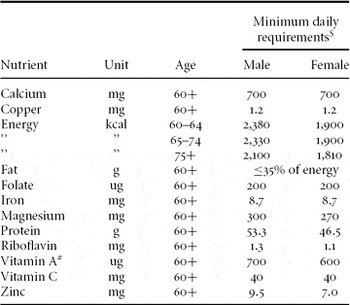
This article seeks to shed new light on some of the issues by considering the household characteristics associated with food and nutrition insecurity in the older UK population: defined at age 60 or over according to the UN (2002) standard definition of older age. Data are taken from the UK's Expenditure and Food Survey (EFS). Estimates of household nutrition, which have been calculated for this inquiry, are compared against the relevant age- and sex-specific Dietary Reference Values (DRVs) recommended by the Department of Health (DoH, 1991, 1992). Reference Nutrient Intakes (RNIs) for protein, vitamins and minerals are used alongside Estimated Average Requirements (EAR) for energy in the study calculations. The national dietary recommendations for older people are set out in Table 1 later in the paper. The analysis by household characteristics is relatively novel here, as the British government usually reports on the average family diet when examining to see whether dietary requirements are being met in the general population (e.g. Gibbins and Georgina, Reference Gibbins and Georgina2006). Officials have yet to undertake a more detailed assessment of diet at the household level using the EFS data. In this inquiry, we evaluate diet by considering the energy requirements of each household, and by making adjustments for the age and sex of each person within the household (Table 1). We also include other parameters of nutritional quality in the evaluation, such as the vitamins and mineral requirements for good health. Before describing the study methods and results and discussing their implications, we consider what is known about the nutritional status of the older population in the UK.

Food and nutrition status of the elderly population
There is a vast body of knowledge and public health potential to reduce the level of exposure to the major health risks that result from poor diet, particularly in older age (Rosenberg, Reference Rosenberg, Garrow, James and Ralph2000). Although there is growing recognition of the need to increase the quality of diets among older people in general (WHO/TUFTS, 2002), further work is required to identify the socio-demographic and household characteristics of those who are most at risk of food poverty in the UK. Insufficient purchasing power at the household level helps to define food poverty, while food deprivation is synonymous with individual undernutrition as the deficiency of one or more nutrients (Svedberg, Reference Svedberg2000). Since Boyd Orr's (Reference Boyd Orr1936) pioneering work in the 1930s, there have been few investigations into food poverty, except for a few small-scale studies carried out by independent researchers during the 1970s and 1980s (Dowler et al., Reference Dowler, Turner and Dobson2001). Insights into such issues are mainly provided by the national dietary surveys.
The National Diet and Nutrition Survey (NDNS), for example, uses a weighed intake method to estimate nutrition levels in the population (here survey respondents were asked to weigh food consumed during a four-day reference period). Energy and nutrient intakes can vary by socio-economic status in the older population: e.g. age, sex, social class, receipt of state benefits (an indication of low income) and geographical region (Finch et al., Reference Finch, Doyle, Lowe, Bates, Prentice, Smithers and Clarke1998). The recent Low Income Diet and Nutrition Survey (LIDNS), reported as a supplement to the NDNS, also helps to shed further light on socio-demographic factors influencing diet and nutrition (Nelson et al., Reference Nelson, Erens, Bates, Church and Boshier2007c). Here, retrospective methods were used to assess nutrition levels in the population (survey respondents were asked to recall the food they had eaten over a 24-hour reference period). The LIDNS identified that those living alone, and men and women with a lower level of educational achievement, tended to have a less healthy diet. Significant variations in diet were also observed between men and women from different ethnic groups. In general, most people were not eating healthily; however, the dietary pattern of those on low income was not dissimilar to that observed in the general population. A press release on the findings of the report by the UK's Food Standards Agency (FSA), an independent government department, concluded that personal choice was a major factor influencing diet (FSA, 2007b). Physical access to food and cooking skills were not considered to be major barriers to healthy eating and neither was household income. This conclusion may seem surprising since many small-scale inquiries have previously reported that families living on low incomes often have difficulty securing a healthy diet (Dowler et al., Reference Dowler, Turner and Dobson2001 provides a review). For low-income households, paying the rent and utility bills usually takes first priority. Subsequently, food choices can easily be constrained by pressures on the family budget. The debate about how best to explain poor diet among the working-class population is an old one, which can be traced back at least to the very beginning of the twentieth century. Two opposing arguments dominate; one ascribes nutritional shortcomings to economic limitations, the other blames the poor for their behaviour (Smith and Nicolson, Reference Smith, Nicolson, Kamminga and Cunningham1995).
The sample for this inquiry is taken from the EFS (this household survey is described in the Appendix), which provides another source of detailed information on family diet. The EFS is primarily a survey of family expenditure, which, among other things, the UK government uses to help monitor the national diet (e.g. Gibbins and Georgina, Reference Gibbins and Georgina2006). Such surveys of family expenditure are increasingly being used by researchers to provide insights into issues of food security (e.g. Smith and Subandoro, Reference Smith and Subandoro2007). Actual food consumption is not recorded in the EFS in the same way as in the weighed intake surveys. Instead, respondents record all of the food acquired – including any home-grown food – during a two-week reference period. The EFS, therefore, provides a relatively complete record of food entering the household and may be less susceptible to under-reporting compared with other types of dietary survey (Chesher, Reference Chesher1998). That said, poor memory and recall is an issue in older age, and food consumption may be under-reported by older respondents in social surveys (Holmes and Nelson, Reference Holmes and Nelson2009). With expenditure surveys like the EFS, it is not really possible to make any detailed assessment of individual food consumption. There is no way of knowing how household food is shared; there is no record kept of the numbers present at meal times, nor is there any way of knowing if any food is brought in or consumed by visiting friends or relatives. Even in single-person households, there may be problems interpreting food purchased as consumption; food may be stored rather than consumed, for example. In this inquiry, however, issues to do with actual food consumption should not overly concern us. For the purposes of assessing the risk of food and nutrition insecurity within the household unit, it is only necessary to consider the quantity and quality of food available in the household.
The origins of the EFS can be traced back to the early 1940s. The British government established a wartime food survey in 1940 in order to monitor the quality of urban working-class diets at a time when food was rationed (MAFF, 1991a). Food composition tables were devised to evaluate the nutritional content of household food (Hollingsworth, Reference Hollingsworth and Slater1990). Government officials estimated average levels of nutrient intake for defined family units and also compared these results against the recommendations given in national dietary guidelines of the day. If we examine the results of the family food survey for 1951 (Ministry of Food, 1953), for example, we find comparisons with British Medical Association nutrition standards which had just been published (BMA, 1950). Survey data tabulated to describe the typical family diet, however, fail to tell the whole story. Average figures may mask ‘peculiar cases’, as John Charles, the government's Chief Medical Officer, observed in his review of the family food survey results from 1956 (Ministry of Health, 1957). Over the years, a number of social scientists have also echoed such criticisms (e.g. Townsend, Reference Townsend1962; Lambert, Reference Lambert1964; McKenzie, Reference McKenzie and Townsend1971; Shaw, Reference Shaw, Dorling and Simpson1999). They argue that it is as equally important to know which households achieve a decent standard of nutrition as it is to know what nutrition levels are like in the general population on average. Although their arguments are persuasive, officials have thus far resisted going down this road in their annual reports on family food and diet. Meanwhile, social researchers have found it difficult to hold up their ideas to critical scrutiny because of the limitations associated with the food survey data. Recently, however, the Family Expenditure Survey (FES) and the National Food Survey (NFS) have merged to form the EFS; new forms of analysis into social inequality and exclusion are now made possible with this merger, of the sort that could not be attempted previously.Footnote 1
Methods
In this inquiry, national Dietary Reference Values (DRVs) for older people are used to assess the nutritional adequacy of household diet (DoH, 1991, 1992).Footnote 2 DRVs comprise a series of estimates of the amount of energy and nutrients needed by different groups of people. Reference Nutrient Intakes (RNIs), shown in Table 1, for protein, vitamins and minerals are used alongside EAR for energy. The RNIs are designed to meet the nutritional needs of almost all healthy persons in the population (97.5 per cent). Where two people are living together, the nutritional needs of the household unit are calculated by summing the nutritional needs for each person, and observing age- and sex-specific recommendations. All standards are treated equally (unweighted) in the study calculations since the national guidance gives no explicit priority to its recommendations. Due care has been taken not to use recommendations and standards where nutrient levels in the older population are known to be low across all socio-economic groups (Calman, Reference Calman1998; WHO/TUFTS, 2002; EVM, 2003; BNF, 2007). This effectively ruled out recommendations for vitamins B12 and D, and there are also no reference values for vitamin E in the official UK guidance (DoH, 1991, 1992). Recommendations regarding sodium (salt) in the diet have also been excluded because current levels of salt intake in the population are considerably higher than requirements. Most salt intake derives from processed foods, which suggests that the responsibility for salt reduction lies as much with food manufacturers as it does with individuals (SCAN, 2003).
UK data on household food consumption come from the EFS (see Appendix). Although the nutritional status of older people in care homes is a major concern in the UK, the non-household population cannot be considered using EFS data (Leslie et al., Reference Leslie, Lean, Woodward, Wallace and Hankey2006). Three years of EFS data (2002–05) provided a total of 5,625 households, comprising 3,069 single persons and 2,556 couples (male and female), all aged 60 or over (ONS/DEFRA, 2006a, 2006b, Reference ONS/DEFRA2006c). Combining the datasets increased the sample size threefold. A large sample will allow small but statistically significant differences in the data to be detected compared with using data for a single year. All cases were weighted in the analysis to correct for non-response and to ensure study estimates relate to the national population (Crockett, Reference Crockett2006). The weights for 2002–05 can be accessed online at the UK Data Archive (www.data-archive.ac.uk), along with the EFS data.
During the two-week survey reference period, diaries are used to record all of the food and drink purchased for consumption inside and outside of the home. Not only will this include all food purchases but also includes all home-grown food acquired. For each food product the weight is recorded in grams or, for other items such as eggs, the actual number is recorded. For drinks and other liquids, including oils and ice cream, volume is recorded in millilitres. In order to assess the nutritional value of household food purchases, it was necessary to apply conversion factors. The nutrient profiles cover some 500 food types and are kept up to date by the UK's Food Standards Agency (FSA) on a rolling basis in order to keep them consistent with new or reformulated products. The nutrient density of food is subject to change; this is partly due to new methods of food production, handling and fortification. The conversion factors may be accessed online at the UK Data Archive, but interested readers can also refer to FSA (2002) for the last major revision in the series on the composition of UK foods. Here we use conversion factors for the years 2002–05. In the study calculations, estimated daily household nutrient intakes were obtained by taking the mean of the 14-day survey reference period, in order to compare against the dietary guideline requirements.
The procedures reported here for evaluating the nutritional value of food items and products are fairly standard and are used by UK government officials to monitor diet in the annual Family Food report (e.g. Gibbins and Georgina, Reference Gibbins and Georgina2006). Other countries have their own food composition tables; there has been a considerable amount of coordination by international agencies such as INFOODS to ensure the production of good-quality data (Southgate, Reference Southgate, Garrow, James and Ralph2000). FSA conversion factors did not cover all aspects of nutrition when applied to the EFS data; standards for vitamin K, chromium and selenium are not included in the analysis. Allowances are made in the study calculations for waste and for the loss of nutrients during the cooking process; there are also allowances for the seasonal variations in the nutrient content of fruit and vegetables (MAFF, 1991b).
Logistic regression, in SPSS (version 17.0), was used to examine the risk of food insecurity by using a range of economic and demographic factors. This statistical technique belongs to the theoretical framework of the General Linear Models (GLM), which is ideally suited to situations where a continuous response variable, such as nutrient intake, has been categorised as a dichotomy (Hosmer and Lemeshow, Reference Hosmer and Lemeshow2000). Binary coding was used to help determine the minimum dietary standard. A household was coded one (1), for example, if it met a dietary standard and zero (0) if it did not. This was done for each of the standards to provide a composite measure of dietary sufficiency at the household level. Logistic regression models are then able to calculate the relative odds of being food and nutrition secure by a range of socio-demographic factors available in the EFS (Table 2).
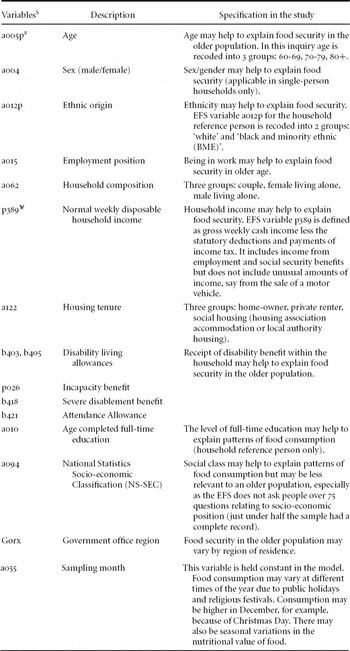
EFS variables in the model

Notes: $Certain variables within the EFS are suffixed with the letter ‘p’ which means that they are anonymised proxy variables.
#The variable for age (a005p) has been top-coded by the national statistical office to 80; this means that anyone in the survey aged 80 or over has been coded as being aged 80 in order to protect the anonymity of respondents’.
¥Income data for 2002/3 and 2003/4 were adjusted to be in line with the 2004/5 data using the UK's Retail Price Index (RPI), the index for pensioner households called CZIF includes all items except housing costs (National Statistics, Reference National Statistics2006).
Results
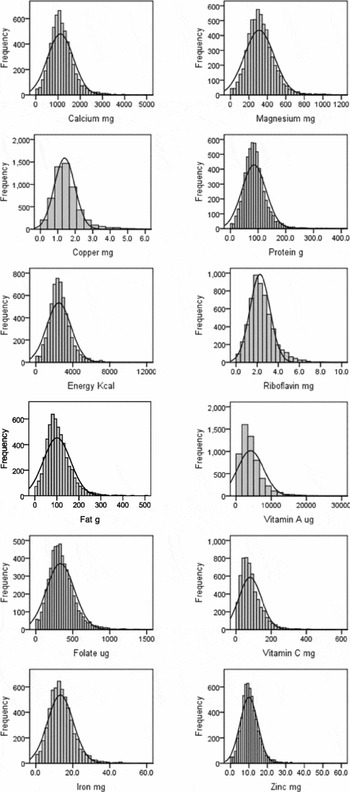
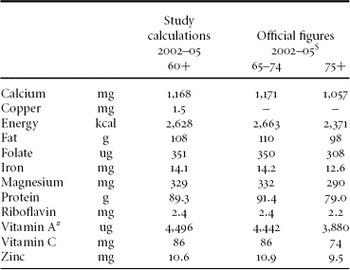
A first step in the analysis was to examine the data relating to household food consumption. The data on nutrient intake in the older population appear to follow the pattern of a normal distribution: 95 per cent of all the observations, for each of the nutrients, were found to be within two standard deviations of the mean (Figure 1). Average nutrient intake per person per day was also found to be comparable with the figures reported by UK government officials for the same period (Table 3). With this observation, we can be fairly confident that the conversion factors were applied correctly to the EFS data.Footnote 3
Distribution of nutrients (estimated intakes per person per day).

Average nutrition levels per person per day (study and official estimates)

Notes: $Gibbins and Georgina (Reference Gibbins and Georgina2006: 84).
#Retinol equivalents.
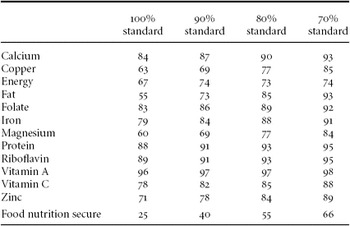
Next, the data on food consumption were evaluated against the minimum dietary standards recommended by national experts. All the calculations observe age- and sex-specific recommendations shown in Table 1. Overall, a quarter of the older household population met the minimum dietary standard and may be classified as being food and nutritionally secure (Table 4). A third of the diets were below recommended energy (caloric) requirements (with average figures in Table 3 reporting energy intakes well above requirements). About half were lacking in copper which is required for the structure of bone tissue, the lungs and blood vessels. Good sources of copper include nuts and shellfish (FSA, 2008b). A third of the diets lacked zinc, which is found in meat and dairy foods, and helps to make new cells and enzymes. A quarter were deficient in iron, which is found in meat, beans, nuts, brown rice, fortified breakfast cereals and most dark green leafy vegetables. A fifth of the diets appeared to be lacking in calcium, folate (folic acid) and vitamin C. Calcium can be found in dairy foods and leafy green vegetables, and helps to build strong teeth and bones; it also plays an essential role in nerve and muscle function. Folate helps the formation of healthy red blood cells and vitamin C, which is found in peppers, broccoli and oranges, helps to protect cells.
Households classified as meeting the dietary standards and being food nutrition secure

A sensitivity analysis helped to reveal the depth of the problem. Thresholds were set at 70, 80 and 90 per cent of each of the dietary standards (Table 4). Only two-thirds of the sample may be classified as being secure in food and nutrition with thresholds relaxed to the 70 per cent level. The findings shown in the table suggest some cause for concern from a social policy perspective. Many older people in the UK appear to be at risk of food insecurity and poor nutritional status.
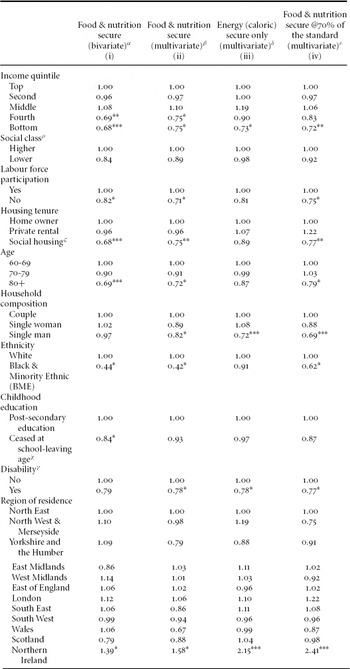
The results from the logistic regression analysis, listed in Table 5, helped to establish the relative risk by household characteristics. In the first column (‘bivariate’ results) of Table 5, the relative odds are compared without taking account of any of the other variables. Relative odds in this case compare the chance of being food and nutrition secure with the odds of not being food and nutrition secure. The odds ratios show the strength and the direction of the predictors, asterisks indicate the level of significance and the ‘base case’ is always one (1.00). For example, the relative odds of being food and nutrition secure for households in the bottom income quintiles are just over 30 per cent worse than the top quintile. The relative odds for those not in the labour force are about 20 per cent worse off compared to those in work. Naturally, these demographic and socio-economic characteristics are not independent of each other. Older pensioners, for example, are more likely to live in low-income households than younger pensioners (Palmer et al., Reference Palmer, MacInnes and Kenway2008). The odds of being food and nutrition secure, independent of the other variables, can be calculated using multivariate analysis. The ‘multivariate’ results are shown in column 2 of Table 5. Income, age, ethnicity, labour force participation, housing tenure and receipt of disability benefit continue to have an impact even after controlling for all other factors in the model, as does household composition. Education no longer appears to make a significant difference to the relative odds of being food and nutrition secure in older age. Social class does not help to explain patterns of food consumption here; however, there may be problems using this variable for the older population as noted in Table 2. There is little in the way of regional variation here except to note that older people in Northern Ireland appear to have a significantly better diet. The vast majority (89 per cent) of the population living here claim that healthy eating is important to them, and survey evidence does suggest that significantly higher portions of fresh fruit and vegetables are consumed compared to the UK average (FSA, 2007a). Women living in Northern Ireland also appear to have the highest mean percentage of EAR for energy across the four countries of the UK, although the difference was not statistically significant for men (Nelson et al., Reference Nelson, Erens, Bates, Church and Boshier2007a).
The relative odds of being food and nutrition secure

Notes: Significance levels: *<0.05; **<0.01; ***<0.001.
αBivariate: not taking account of other variables in the model.
βMultivariate: controlling for all other variables including survey month; Correctly classified = 68%.
δ Multivariate: controlling for all other variables including survey month; Correctly classified = 70%.
€Thresholds set at 70% of the dietary standards.
ρThe higher social class groups consists of professionals and managers and the lower group is made up of semi- and routine workers.
ςLocal authority or housing association.
χSchool-leaving age was raised from 14 to 15 in 1947.
γDisability benefits (Table 3).
If we re-run the analysis but this time with a focus on meeting energy (calorie) requirements in the model, we find that many of the household risk factors are no longer significant (employment position, housing tenure and disability). Being in the bottom income quintile and belonging to a black and minority ethnic (BME) group increases the relative odds of having a diet that is deficient in calories significantly (see column 3 in Table 5).
Many of the demographic characteristics continue to have an impact even after the dietary standards have been adjusted downwards, by as much as 30 per cent, to make them easier to achieve. Ethnicity, income, non-participation in the labour force, housing tenure and disability are all strongly associated with food and nutrition insecurity in later life as dietary thresholds are lowered by 10, 20 and 30 per cent (Table 5 shows results at the 70 per cent threshold in column 4).
Households at the bottom of the income distribution are significantly less likely to be food and nutrition secure, and this risk remains significant even with the dietary standards lowered by 30 per cent. Households in the oldest age group (80 plus) have significantly less chance of securing a healthy nutritious diet, although the risk no longer holds when caloric requirements are examined alone. This would suggest that the relative risk lies more with the quality of food being consumed by the oldest-old than with the quantity of food purchased. Living arrangements, housing tenure and economic activity are also important here. Single men living alone have significantly less chance of securing a nutritious diet compared to single women living alone and couples living together, as do older people living in social housing and those not in work. Ethnicity and disability are important factors; older people with a disability and those from BME groups are less likely to secure adequate food and nutrition. The results of the logistic regression can be used to estimate the overall risk for households with different characteristics. For example, the chance of securing adequate food and nutrition for a single white female aged 60–69 living in her own home on a high income is six times greater than a single BME man over 80 living in social housing on disability benefit.
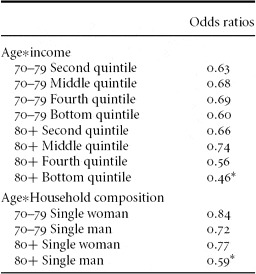
The results in the main effects multivariate model (column 2 of Table 5) suggest that there is some correlation between some of the variables. Income and age, for example, are less significant when all other variables are controlled for in the model (but they remain statistically significant, suggesting they make an independent contribution to food security). Further testing for interactions between the variables in the model revealed that income makes more of a difference to food insecurity for older households than for younger households. Age makes more of a difference for men living alone than it does for women living alone. Table 6 shows significant interactions with all other variables included in the main effects model. We know that older pensioners are more likely to live in low-income households than younger pensioners and so the results may be expected (Palmer et al., Reference Palmer, MacInnes and Kenway2008). Previously cited evidence indicates that living alone is generally an important risk factor for poor nutritional status, and the proportion of older men and women living alone increases with age (Tomassini, Reference Tomassini, Soule, Babb, Evandrou, Balchin and Zealey2005).
Multivariate model containing main effects and showing significant interactionsα

Notes: Significance levels: *<0.05; **<0.01; ***<0.001.
αmain effects model (Table 6, column 2).
Discussion
It is important for their health and wellbeing that older people obtain essential nutrients through food-based diets. Despite some of the shortcomings discussed earlier, household expenditure surveys like the EFS can provide an important source of data to examine issues relating to food and nutrition security. These surveys can offer insights to complement some of the more subjective approaches to measuring food security currently in use (Nelson et al., Reference Nelson, Erens, Bates, Church and Boshier2007b: 201–09).Footnote 4 In this inquiry, we examined the food consumed by over 5,000 older person households in the UK. The vast majority of household diets lacked sufficient quantity and/or quality of food. Only about a quarter of them were classified as being food and nutritionally secure according to the national dietary standards set out in Table 1. A third of the diets were deficient in energy, and many more were lacking in other aspects of nutritional quality: the essential vitamins and minerals required for different bodily functions. The overall findings suggest that ‘upstream’ measures may be needed to reduce the risk of food and nutrition insecurity. There is some evidence that a readjustment of value added tax (VAT) on food products could effectively reduce the burden of disease caused by poor diets in the UK (Mytton et al., Reference Mytton, Gray, Rayner and Rutter2007). Processed and less nutritious foods have tended to show lower price increases compared to healthier items such as fruit and vegetables, oily fish and wholegrain cereal products.
The inquiry also identified particular household characteristics associated with risk: low-income households, the oldest-old, elderly people from BME groups, those claiming disability benefit and men living alone are significantly more at risk of being food and nutrition insecure. Targeted policies may be required to ensure that inequalities in diet do not widen amongst sections of the older population. The positive relationship between household income and food security is to be expected and is consistent with other findings (Nelson, Reference Nelson, Gordon, Shaw, Dorling and Davey Smith1999). The results suggest that risk is most concentrated at the bottom of the income distribution. Those in the bottom quintile group are most at risk of diets that are deficient in calories and lacking in other important aspects of nutritional quality. These findings are important, as income is the primary means by which household diet can be improved. As Glennerster et al. (Reference Glennerster, Bradshaw, Lister and Lundberg2009) observe, the Labour government resisted calls for an explicit research-based approach to social protection policy for healthy living in the UK, and it is hard to judge the new Conservative–Liberal Democrat coalition government who have just started a period of consultation on welfare reform, but early indications are not promising (Department of Work and Pensions, 2010).
Living alone is generally an important risk factor for poor nutritional status. The results presented here suggest that single men may be at particular risk, especially those aged 80 plus. Older people who live on their own often report that it is not worth cooking for just one person (FSA, 2005). In addition, physiological effects such as lower taste acuity are likely to play an important role in influencing the choice of food amongst the oldest-old. Food, therefore, is a prime example of an area where there needs to be clear and consistent information available to help people make healthy choices. The British government has been promoting a ‘five-a-day’ message in relation to eating five portions of fruit and vegetables each day. It has also been working with retailers and manufacturers to improve food labelling in UK supermarkets (Department of Health, 2004a). Survey evidence from the FSA (2005) suggests that the ‘five-a-day’ message is getting through to the public. Older people over 65, however, are more likely to say that they should eat fewer portions than the recommended amount, which suggests that health education needs to be more specifically directed at vulnerable groups such as the elderly (Caraher, Reference Caraher2008).
Diet is one of the main modifiable risk factors to health, along with exercise. Poor diet among the older population often results from a combination of reduced appetite and a reduction in activity levels, which decline with age. In this inquiry, participation in the labour force was a significant factor towards the chances of securing a nutritious diet. Paid employment appears to offer a range of benefits in later life beyond economic gains; the British government is trying to encourage more people over the age of 60 to continue in work, and the state pension age is set to increase (Department of Work and Pensions, 2006). In the UK, activity levels are low in the older population and they decline sharply in retirement.
Employment is not an option available to all of the older population. The number of elderly people needing help and support from personal social services to live independently in the community continues to grow, while trend data show falls in local authority-provided domiciliary services. The inquiry found that those living in social housing, the frail elderly and those with a disability were at increased risk of being food and nutritionally insecure. Shopping for food, preparing meals and eating food independently presents a real challenge for many (Hirani and Malbut, Reference Hirani and Malbut2002).Footnote 5 Co-ordinated strategies to improve the nutrition of vulnerable older people in the UK are therefore welcome (e.g. DoH, 2004b, 2007). In hospitals and care homes, this is likely to involve a national standard of service for the provision of meals to ensure minimum nutritional requirements are being met in the diet. This or similar thinking, however, has not been extended to the ‘Meals on Wheels’ programme operating in all localities across the UK.Footnote 6 Lobstein (Reference Lobstein2007) suggests that it should be. Efforts would need to be made to take into account individual nutritional requirements as well as dietary and cultural preferences, but, ultimately, for those living within the community, ensuring a healthy nutritious diet poses a real challenge. The government is currently considering a new role for domiciliary care providers in helping to assess the nutritional status of older people receiving care in the community, the frail elderly people and those with a significant disability. The challenges for community services are considerable nonetheless; poorer households and the oldest-old have fewer natural teeth, for instance, meaning they are more likely to be edentate and vulnerable to food-based dietary restrictions.
The inquiry found significant variations in the diet by ethnic groups, which is consistent with previous research (Nelson et al., Reference Nelson, Erens, Bates, Church and Boshier2007a). Households who describe their ethnic background as ‘white’ are twice as likely to be food secure compared to those from BME backgrounds. Such disparities may, to an extent, reflect differences in the traditional diets of different cultures. People from BME groups are more likely to be vegetarian and are more likely to avoid certain foods for religious reasons (FSA, 2008a). Unfortunately, expenditure surveys like the EFS do not allow us to disentangle with any certainty those households that are food insecure through material circumstances, from those that are food compromised through choice (Smith, Reference Smith2003; Smith and Subandoro, Reference Smith and Subandoro2007). Expenditure surveys also say very little, if anything, about physical access to food, although this is clearly an important issue; older people in particular may find out-of-town supermarkets inaccessible (Hitchman et al., Reference Hitchman, Christie, Harrison and Lang2002). The task of separating out issues to do with food poverty, food access and matters of personal choice are complex and may be more suited to qualitative research methods, as discussed below.
Prior research confirms that high educational achievement is usually associated with healthy eating and this was confirmed in the study findings, although the difference was not statistically significant when all other factors were controlled for. A low level of childhood education is not easy to compensate for in the older population. Authoritative information about healthy eating and food labelling helps to promote healthier choices, as previously discussed. At present, there are a range of food and nutrition labelling systems in effect in UK supermarkets, which is causing confusion amongst consumers; recently there have been calls for a standardised single label format on the front of the packaging to enhance comprehension (Malam et al., Reference Malam, Clegg, Kirwan and McGinigal2009).
Conclusion
In the UK, a completely risk-free food supply chain is an unrealistic objective, as the British government argues (DEFRA, 2006). Eliminating the last trace of risk would involve costs that consumers and taxpayers would find excessive. Nevertheless, the findings reported here raise a number of important issues for social policy. Food security and nutrition are clearly an issue within some sections of the older population. Precisely how many households are involved, however, remains unclear. The EFS does not allow us to disentangle with any degree of certainty those households that are food secure and those that are food compromised. Some instances may be a result of material circumstances (i.e. inequality) and others may be through choice. The shift from being food secure to food insecurity, as the FAO observes, only comes when an individual or community does not have the choice. To this extent, the data do not allow us to settle the question posed earlier vis-à-vis the extent to which shortcomings in household diets are due to economic limitations rather than behavioural factors. Judging by the results, however, it would be hard to argue that such matters are simply a matter of personal choice, given that certain sections of the older population are clearly more at risk than others. Personal circumstances and household characteristics, such as employment, income, age, ethnicity, disability, household composition and housing tenure all appear to matter when it comes to securing the right amount of nutritious food for active, healthy living in later life.
Qualitative research might cast further light on some of these issues. All too often older people indicate that they need to make savings in the food budget, but this warrants further investigation (Dominy and Kempson, Reference Dominy and Kempson2006). Qualitative research might examine the everyday food purchasing decisions and budgeting behaviour of older people in the at-risk groups. The relatively small-scale but in-depth studies conducted in Britain by independent charities and concerned researchers, largely in the 1970s and 80s (and reviewed by Dowler et al., Reference Dowler, Turner and Dobson2001), now appear out of date. A renewed focus should be a priority for further research in this field.
Appendix Expenditure and Food Survey (EFS)
The UK's Expenditure and Food Survey (EFS) started in April 2001, when the National Food Survey (NFS, est. 1940) combined with the Family Expenditure Survey (FES, est. 1957). This merger opens up the potential for new research in areas of social policy by offering detailed data on household expenditure, food consumption and income. The EFS is a continuous survey of private households that uses a multi-stage stratified random sampling design with clustering. In Britain, the sample is drawn from the Post Offices Postal Address File (PAF). The Northern Ireland survey sample is drawn as a random sample of addresses from the Valuation and Lands Agency List. A random sample of postcode sectors is selected from the PAF, from which households are selected. The EFS attempts to get a reliable and accurate representation of the national population using stratification; essentially this means dividing the sampling frame into groups (strata) before sampling to reduce the risk of drawing an extreme sample that is unrepresentative of the population. A clustered sample is defined as a sample which is selected in two or more hierarchical stages with different units selected at each stage, e.g. households, two pensioners within each household. Clustering can also help to divide the sample into manageable workloads for interviewers. Samples of 12,000 households are usually drawn each year in Britain, with an actual or achieved response rate averaging around 60 per cent. From January 2008, the EFS questionnaire became the Living Costs and Food (LCF) module of the Integrated Household Survey (IHS).
Acknowledgements
I am grateful to J.N. Morris and two referees for their helpful and perceptive comments on an earlier version of this paper. Material from the EFS is Crown Copyright. It has been made available by the Office for National Statistics (ONS) and the Department for Environment Food and Rural Affairs (DEFRA) through the Economic and Social Research Council (ESRC) UK Data Archive based at the University of Essex. The data have been used with permission and the study is registered with the UK Data Archive (usage details: 20136 and study numbers: 5003, 5210 and 5375).