Implications
This manuscript aims to describe the effect of alternative housing conditions on rabbit carcass and meat quality with emphasis on enhancing exercise. Using a wide range of physico-chemical measurements and a principal component analysis, this paper provides new information and insight on the relationships between meat and carcass traits as affected by housing conditions: carcass parameters, meat colour and bone properties are affected independently. It demonstrates that rearing rabbits in large pens could be an alternative housing system, which would satisfy consumer demand for ‘ethical qualities’ of meat, but probably without perception of higher sensorial quality.
Introduction
Until the end of the 20th century, the main objectives of rabbit meat production were to increase productivity with respect to animal health. Thus, since the introduction of large breeding units (from the seventies onwards), rabbits have been kept in wire mesh cages. As these housing conditions were economically profitable and allowed to reduce working time and parasitism (Morisse, Reference Morisse1998), compared to hutches, they developed widely and quickly. But, consumer demand has evolved, and new criteria have to be taken into account such as ‘ethical qualities’ of meat (Dal Bosco et al., Reference Dal Bosco, Castellini and Mugnai2002). Indeed, consumers are now interested in the conditions of animal production in relation to animal welfare. According to The Farm Animal Welfare Council (1991) and its ‘five freedoms’, animals experience welfare in particular when they have suitable housing and can freely express the behavioural pattern of their species (Trocino and Xiccato, Reference Trocino and Xiccato2006). In semi-wild condition, rabbits spend most of their resting time in group and in close contact. They perform various comfort activities and locomotory activities with hopping as the main expression (Trocino and Xiccato, Reference Trocino and Xiccato2006). Presumably, group rearing in a larger area compared to conventional cages, would better satisfy the spatial and social needs of rabbits. To date, several experiments have been conducted with rabbits in order to test new housing conditions (Combes and Lebas, Reference Combes and Lebas2003), which include the effects of stocking density (Maertens and De Groote, Reference Maertens and De Groote1988; Aubret and Duperray, Reference Aubret and Duperray1992), group size (Rommers and Meijerhof, Reference Rommers and Meijerhof1998), pen size (Maertens and Van Oeckel, Reference Maertens and Van Oeckel2001; Jehl et al., Reference Jehl, Meplain, Mirabito and Combes2003), enrichment structure such as straw litter (Dal Bosco et al., Reference Dal Bosco, Castellini and Mugnai2002), wooden gnawing sticks (Maertens and Van Oeckel, Reference Maertens and Van Oeckel2001) or ways to encourage exercise (gates or elevated platforms) (Jehl et al., Reference Jehl, Meplain, Mirabito and Combes2003; Gondret et al., Reference Gondret, Hernandez, Remignon and Combes2009). Although rabbits spend the majority of their time resting, it has been shown that increasing pen size leads to increased locomotory activity for the same stocking density (Jehl et al., Reference Jehl, Meplain, Mirabito and Combes2003; Postollec et al., Reference Postollec, Boilletot, Maurice and Michel2008) or at different stocking density (Dal Bosco et al., Reference Dal Bosco, Castellini and Mugnai2002). Indeed, the frequency of runs, hops and successive hops were the highest in large pens. Moreover, the addition of a platform in pens is used either as an exercise structure in large pens or as an additional floor area in small pens (Jehl et al., Reference Jehl, Meplain, Mirabito and Combes2003; Postollec et al., Reference Postollec, Boilletot, Maurice and Michel2008).
For rabbits, few studies have been published on the effect of alternative housing on carcass and meat qualities (Combes and Lebas, Reference Combes and Lebas2003), and the results are fragmentary. This study was undertaken to provide more insight into the effect of alternative housing conditions on rabbit carcass and meat quality with emphasis on enhancing exercise. The aim was to compare, at the same stocking density, conventional housing conditions to small and large pens, which both contained an elevated platform as an exercise structure. The effects on live performance, health status and welfare were reported by Postollec et al. (Reference Postollec, Boilletot, Maurice and Michel2008).
Material and methods
Animals
Rabbits were cared for and handled in conformity with the French national regulations for humane care and use of animals in research at the AFSSA experimental farm of Ploufragan (France 22440). At weaning (31 days old), Hycole rabbits of both sexes were assigned into three housing groups at the same stocking density of 15 rabbits/m2. In the first group, 48 rabbits were reared in 8 conventional cages of 6 rabbits per cage (0.77 m length × 0.50 m width × 0.30 m height). In the second group, 80 rabbits were kept in 8 small pens of 10 rabbits. The small pens had 0.662 m2 of total available area, with a floor area of 0.503 m2 (0.53 m × 0.95 m) and a platform area of 0.159 m2 (0.53 m × 0.30 m). In the third one, 300 rabbits were kept in 5 large pens of 60 rabbits per pen. The large pens had a total available area of 4.052 m2, a floor area of 3.667 m2 (1.93 m × 1.90 m) and a platform area of 0.385 m2 (0.77 m × 0.50 m). During the entire study period, all rabbits had free access to water and to a standard pelleted diet. A detailed description of the experimental site, feeding, animals and their management is provided by Postollec et al. (Reference Postollec, Boilletot, Maurice and Michel2008).
Slaughter procedure and carcass traits
At 71 days of age, 90 rabbits (30 per group) were weighed and transported to the slaughterhouse. They were immediately pre-anesthetised by electronarcosis and slaughtered without prior fasting, by jugular cutting. Hot carcasses were prepared by removing the gastrointestinal and urogenital tracts and skin. After 24 h of chilling, cold carcasses (with head, thoracic cage organs, liver, kidneys, perirenal and scapular fat) were weighed. Liver, perirenal and scapular fat were then removed and weighed. Carcasses were then divided according to the norms of the World Rabbit Scientific Association (Blasco and Ouhayoun, Reference Blasco and Ouhayoun1993). Dressing out (chilled carcass (CC) weight/pre-slaughter weight (SW), times 100) and proportions (weight/CC weight) of perirenal and interscapular fat deposits and of fore (from atlas vertebra to the seventh thoracic vertebra), intermediate (from the seventh thoracic vertebra to the sixth lumbar vertebra) and hind (from the sixth lumbar vertebra) parts were calculated. Meat colour was assessed on the surface of the carcass over the biceps femoris (BF) and the longissimus lumborum (LL), and on a freshly exposed cut surface of LL at the seventh lumbar vertebra level. A Minolta CR-300 chromameter (Minolta, Osaka, Japan) was set to the L* (lightness), a* (redness), b* (yellowness) scale (Honikel, Reference Honikel1998). Ultimate pH was then obtained at the surface over BF and in LL adjacent to the first lumbar vertebra level, using a combined glass penetrating electrode (Ingold, Mettler Toledo, Greifensee, Switzerland) and a portable pH meter (WTW 340i; WTW, Weilheim, Germany). Both hind legs and the intermediate part (with abdominal walls) of the carcass were then vacuum packed and frozen at −20°C.
Analytical traits
Thereafter, vacuum-packed left hind legs were thawed under tap water and cooked at 80°C for 2 h and 30 min in a wet oven (EX435; HMI-Thirode, Mitry Mory, France). Cooking loss of hind legs was calculated as the cooked/raw hind leg weight ratio. The muscle-to-bone ratio of the hind leg was then calculated as the ratio of deboned cooked meat to bone weights (Blasco and Ouhayoun, Reference Blasco and Ouhayoun1993). After thawing, both LL were removed from the back and weighed. An entire cross-section in the mid-portion of right LL was photographed, and muscle cross-section area was measured by image analysis. Water-holding capacity was estimated by centrifuging raw LL portions (5 g) for 10 min at 1500 × g, and determining the residual water by drying the sample at 103°C overnight according to Castellini et al. (Reference Castellini, Dal Bosco, Bernardini and Cyril1998). The other LL was used for Warner–Bratzler (WB) shear test. Three skeletal muscles were carefully removed from the hind leg and immediately weighed: abductor cruralis cranialis (ACC), BF and semitendinosus (ST). These muscles were chosen because of their quantitative importance in rabbit leg meat (e.g. 21.9 ± 7.3% calculated from this study). Moisture was determined in samples by drying at 103°C overnight, and total lipids content (Folch et al., Reference Folch, Lees and Sloane Stanley1957) were determined after extraction with methanol/chloroform.
Rheological measurements on muscles and bones
WB shear tests were made using a universal test machine (Synergie 200; MTS, Eden Prairie, MN, USA). Sample strips were cut with a 100 mm2 (10 × 10) cross-section with the fibre direction parallel to the long dimension of 2 cm from ACC, BF, LL and ST muscles. These samples were sheared at right angles to the fibre axis using a WB shear blade with a rectangular hole. The blade travelled at 100 mm/min through the sample (Honikel, Reference Honikel1998). The parameters measured from the force deformation curve were the maximum shear force (N), total energy defined as the area under the force deformation curve (mJ) and stiffness defined as the ratio of maximum shear force to displacement to maximum shear force (N/mm).
Tibia and femurs were removed and weighed. The bones were submitted to a three-point flexure test conducted with a universal testing machine (Synergie 200; MTS). The distance between the two fulcrum points supporting the bones was 30 mm and a load was applied at 5 mm/min (Gondret et al., Reference Gondret, Larzul, Combes and De Rochambeau2005). Lengths, outside (B and D) and inside (b and d) diameters at the point of loading, both perpendicular and parallel to the direction of the applied force, were measured using a dial caliper (±0.02 mm). The area moment of inertia (MI; mm4), which is an estimate of bone distribution assuming that the bone shape is similar to that of an elliptical hollow tube (Crenshaw et al., Reference Crenshaw, Peo, Lewis and Moser1981), was calculated according to the following formula: MI = 0.0491 (BD3 − bd3). Yield force (N), ultimate force (N) and stiffness (slope of the elastic part, N/mm) were collected from the load deformation curve, whereas modulus of elasticity as a measure of the degree of rigidity of the bone material (N/mm2) and strain were calculated according to formula reported by Patterson et al. (Reference Patterson, Cook, Crenshaw and Sunde1986).
Data analysis
The normal distribution of the residues of the 64 physicochemical variables was checked, and it was decided to transform the following eight variables to their natural logarithms: measure of redness over LL, lipids content in ACC and BF, WB shear force, total energy and stiffness in BF, femur and tibia MI. Variables were first analysed by a two-way analysis of variance, including the housing and the sex effect, using R 2.8.0 software (R Development Core Team, 2008). The interaction between housing and sex was removed from the model since it was never significant. From this analysis, the 29 variables significant for the group effect were kept (P < 0.05). A principal component analysis (PCA) was performed using the 29 variable data set to provide a partial visualisation of the correlations between the variables in a reduced dimension plot using R 2.8.0 software (R Development Core Team, 2008). When applying multivariate analyses, observations with missing values are excluded. In this study, only 60 rabbits out of 90 slaughtered had all measurements recorded. The contribution of each variable to the constitution of the three first components was calculated.
Results
Slaughter traits
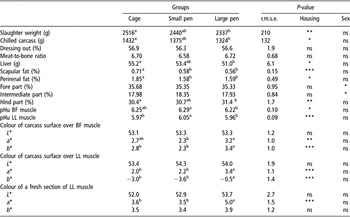
Daily gain was significantly reduced for rabbits housed in small (−3%, 43.9 ± 3.6 g/day) or in large pens (−8%, 41.6 ± 3.9 g/day) compared to those caged conventionally (45.3 ± 3.0 g/day; P < 0.001). Housing conditions had a significant effect on SW (P < 0.01), carcass weight (P < 0.05) and liver weight (P < 0.05). Caged rabbits ranked the highest, rabbits reared in large pens ranked the lowest and small pen ones being intermediate (Table 1). Dressing out and meat to bone ratio were not influenced by the housing system, but hind part proportion was higher (+1%) in rabbits reared in large pens compared to caged rabbits, whereas those reared in small pen were intermediate. Percentage of fat deposit was the highest in caged rabbits (scapular fat: P < 0.001; perirenal fat: P < 0.05). Meat ultimate pH and especially colour were affected by housing conditions (Table 1). The redness (a* value) was higher in rabbits reared in large pens than in the two other groups on both LL measured sites (on the surface of the carcass over the LL and on a fresh section of LL). In BF, the highest value of redness was observed in pen-reared rabbits, although it was not significantly different from in caged rabbits. Yellowness (b* value) of the carcass measured over the BF and over the LL were higher in rabbits reared in large pens than in the two other groups.
Effect of the housing system on rabbit slaughter traits (mean, n = 30 per group)

BF = biceps femoris; LL = longissimus lumborum.
a,bWithin a row, means without a common superscript letter differ, P < 0.05.
ns, non-significant; *P ⩽ 0.05; **P ⩽ 0.01; ***P ⩽ 0.001.
Analytical and rheological traits
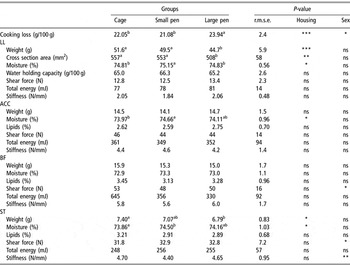
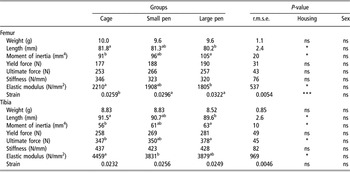
Rabbits reared in large pens exhibited the highest cooking loss (P < 0.001; Table 2). Moisture in LL, ACC and ST was the highest for the small pen group (P < 0.01). Neither lipids content nor WB shear test parameters were affected by housing conditions, whereas bone shape in both, the femur and the tibia (P < 0.01) differed (Table 3). Rabbits raised in large pen exhibited shorter bone (−2%) but higher MI (+15% and +12% in femur and tibia, respectively) compared to caged rabbits, whereas those reared in small pen were intermediate. Tibia and femur from caged rabbits had the highest elastic modulus that corresponded to the highest rigidity of the bone. The strain was also the lowest in caged rabbits, but only in the femur.
Effect of the housing system on cooking loss in hind leg and on analytical and rheological traits of longissimus lumborum, abductor cruralis cranialis, biceps femoris and semitendinosus rabbit muscles (means, n = 30 per group)

ACC = abductor cruralis cranialis; BF = biceps femoris; LL = longissimus lumborum; ST = semitendinosus.
a,bWithin a row, means without a common superscript letter differ, P < 0.05.
ns, non-significant; *P ⩽ 0.05; **P ⩽ 0.01;***P ⩽ 0.001.
Bone shape and mechanical properties of rabbit femur and tibia (mean, n = 30 per group)

a,bWithin a row, means without a common superscript letter differ, P < 0.05.
ns, non-significant; *P ⩽ 0.05; **P ⩽ 0.01; ***P ⩽ 0.001.
PCA
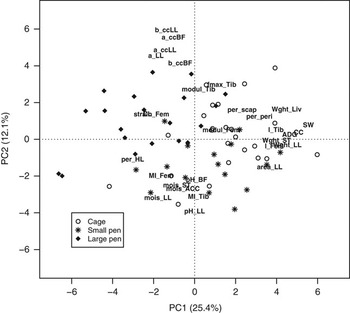
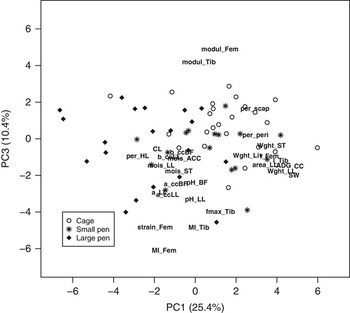
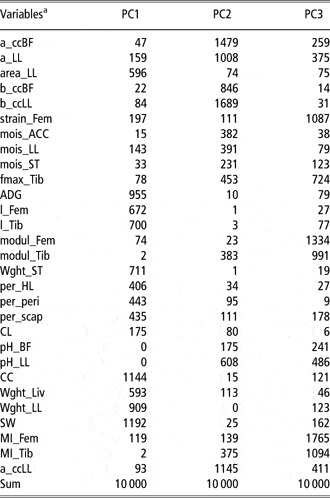
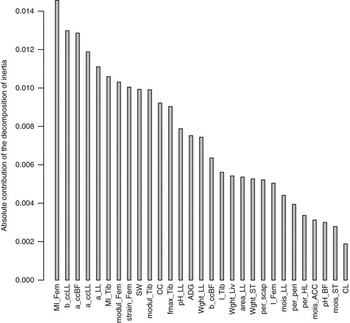
In order to have an overview of relationships between the 29 variables significantly affected by the group (P < 0.05), a PCA analysis was carried out. The first four principal components (PCs) explained 57.1% of the total variation. Figures 1 and 2 show a plot of the different traits according to the first two PCs and on the first and third PCs. A first group of variables, which was highly positively correlated to the first PC, could be linked to growth performance traits since it included average daily gain (ADG), SW, CC weight, bone length (l_Tib and l_Fem), weight of liver and muscles (Wght_Liv, Wght_LL and Wght_ST) and cross section area of the LL (Figure 1). The second PC was essentially related to colour characteristics (positively correlated) that were opposed to ultimate pH and to a lesser extent to moisture content. Finally, PC3 was strongly related to bone shape (tMI_fem; tMI_tibia) and mechanical characteristics (modul_Fem, strain_Fem, modul_Tib and Fmax_Tib) (Figure 2). Inertia of variables for each of the first three PCs and contribution of the variable to the explained variance of PCA for the three components are shown in Table 4 and Figure 3, respectively. These data showed that beside the growth parameter-related traits, bone shape and mechanical characteristics and colour variables made the highest contribution to explained variance of PCA. Altogether, it can be concluded that housing conditions clearly affected three types of traits (e.g. growth-related traits, meat colour and bone characteristics). But, these three types of traits were not linked together as demonstrated by the angle between the three groups of traits. The projection of data on the first two PCs, the first and third respectively, showed an overlapping of the three groups. This result indicates a moderate effect of housing conditions, especially between cage and small pen housing systems. However, the first and the second PCs (Figure 1) opposed the rabbits reared in large pens and the two others groups.
Projection of the 29 variables (selected P < 0.05 for group effect) and the data of the three groups of rabbits on the plan defined by the first two PCs (PC1 and PC2). ADG = average daily gain; SW = slaughter weight; CC = chilled carcass weight; Wght_Liv, Wght_ST, Wght_LL = weight of liver, semitendinosus (ST) and longissimus lumborum (LL) muscles; per_HL = ratio between hindlegs weight and CC weight × 100; per_peri, per_scap = ratio between perirenal fat of scapular fat weight and CC weight × 100; pH_BF, pH_LL = ultimate pH in biceps femoris (BF) and LL muscles; a_ccBF, a_ccLL, a_LL = measure of redness value on the surface of the carcass over the BF and over the LL muscles and on a freshly exposed cut surface of LL muscle; b_ccBF, b_ccLL = measure of yellowness value on the surface of the carcass over the BF and over the LL muscles; area_LL = cross section area of the LL muscle; CL = cooking loss in hind leg; mois_ACC, mois_LL, mois_ST = moisture content of abductor cruralis cranialis, LL and ST muscles; l_Fem, l_Tib = femur and tibia length; tMI_Fem, tMI_Tib = femur and tibia moment of inertia; fmax_Tib = tibia ultimate force; modul_Fem, modul_Tib = femur and tibia elastic modulus; strain_Fem = femur strain.

Projection of the 29 variables (selected P < 0.05 for group effect) and the data of the three groups of rabbits on the plan defined by the first and third PCs (PC1 and PC3). Abbreviations are given in Figure 1.

Absolute inertia of variables in the first three principal components (PC1, PC2 and PC3)

aAbbreviations are given in Figure 1.
Absolute contribution of each of the 29 variables (selected P < 0.05 for group effect) to the explained variance of the third PC. Abbreviations are given in Figure 1.

Discussion
Alternative housing conditions, in rabbit breeding as in other species, may alter carcass and meat quality compared to conventional housing. Several factors are involved depending on experimental design such as space availability, stocking density, group size, enrichment structure and stimulation of physical activity (Combes and Lebas, Reference Combes and Lebas2003; Trocino and Xiccato, Reference Trocino and Xiccato2006; Lebret, Reference Lebret2008). In this study, a conventional system was compared at the same stocking density with small and large pens with an elevated platform as an exercise structure. Growth parameters, health and behavioural observations were described in Postollec et al. (Reference Postollec, Boilletot, Maurice and Michel2008). Our study demonstrated that large pens with a platform affected carcass and meat characteristics moderately compared to conventional housing. However, housing systems with a platform as an exercise structure, but without any increase in space per rabbit (e.g. small pen), was not sufficient to alter the carcass or meat quality.
In the present study, we found a lower slaughter and carcass weight, lower carcass adiposity and greater proportion of hind parts in carcasses of rabbits reared in large pens compared to caged rabbits. These observations might be related to the locomotory behaviour in rabbits reared in large pens, e.g. the number of runs and jumps was 20% higher in large pens compared to the two other groups (Postollec et al., Reference Postollec, Boilletot, Maurice and Michel2008). These results are in accordance with previous studies that have reported the same link between increased locomotory behaviour and the above-mentioned carcass traits in rabbits reared in large pens compared to caged rabbits (Dal Bosco et al., Reference Dal Bosco, Castellini and Mugnai2002; Jehl et al., Reference Jehl, Meplain, Mirabito and Combes2003). The modifications in carcass weight and body conformation might be explained in part by the reduction in growth rate observed in our study, related to increased physical activity. Indeed, it is generally assumed (Ouhayoun, Reference Ouhayoun1998) that the lower growth rate increases the relative growth of early maturing tissues at the expense of late maturing ones, especially fat deposit. A positive and previously demonstrated consequence of exercise was the greater development of the hind part, much preferred by consumers (Lambertini et al., Reference Lambertini, Vignola and Zaghini2001; Dal Bosco et al., Reference Dal Bosco, Castellini and Mugnai2002; Jehl et al., Reference Jehl, Meplain, Mirabito and Combes2003; Gondret et al., Reference Gondret, Hernandez, Remignon and Combes2009). In our experiment, slaughter yield was unaffected by the housing system. No effect of housing conditions on slaughter yield (Jehl et al., Reference Jehl, Meplain, Mirabito and Combes2003; Dalle Zotte et al., Reference Dalle Zotte, Princz, Metzger, Szabó, Radnai, Biró-Németh, Orova and Szendro2009) or a reduction in slaughter yield has been reported previously (Dal Bosco et al., Reference Dal Bosco, Castellini and Bernardini2000; Lambertini et al., Reference Lambertini, Vignola and Zaghini2001; Dal Bosco et al., Reference Dal Bosco, Castellini and Mugnai2002). As slaughter yield is mainly affected by digestive tract weight (Ouhayoun, Reference Ouhayoun1989), the reduction observed in some studies could be attributed to straw consumption when rabbits are reared on straw-bedded pens (Dal Bosco et al., Reference Dal Bosco, Castellini and Mugnai2002).
Regarding the effect of housing on meat-to-bone ratio, several studies reported a lower meat-to-bone ratio in pen-housed rabbits compared to caged rabbits (Dal Bosco et al., Reference Dal Bosco, Castellini and Mugnai2002; Jehl et al., Reference Jehl, Meplain, Mirabito and Combes2003; Dalle Zotte et al., Reference Dalle Zotte, Princz, Metzger, Szabó, Radnai, Biró-Németh, Orova and Szendro2009). In the work of Dalle Zotte et al. (Reference Dalle Zotte, Princz, Metzger, Szabó, Radnai, Biró-Németh, Orova and Szendro2009), lower meat-to-bone ratio was linked to heavier femur and tibia bones. In our study, neither meat-to-bone ratio nor weight of the bones were affected by housing conditions, in agreement with Martrenchar et al. (Reference Martrenchar, Boilletot, Cotte and Morisse2001). Despite unaffected bone weight, in the present experiment, femur and tibia bones from rabbits reared in large pens were shorter and exhibited higher MI than caged rabbits, whereas those reared in small pen had intermediate values. This latter result indicated a modification of the distribution of the bone material within bone section: higher MI resulted mainly from higher value of outside antero-posterior diameter (D value; P < 0.05 and P < 0.01 in femur and tibia, respectively, data not shown). Besides bone shape modifications, mechanical properties of bones were also affected by housing conditions. In general, bones from caged rabbits exhibited the highest rigidity (elastic modulus as an indication of basic material elasticity independent of bone geometry) and the lowest susceptibility to deformation (strain P < 0.001 in the femur). Furthermore, ultimate force applied to tibia was the highest in rabbits reared in large pens. Bone resistance can be considered as another quality factor for the sale of retail cuts and mechanically deboned meats (Lebas et al., Reference Lebas, Lamboley-Gaüzere, Delmas and Auvergne1998). The frequency of leg bone breaking during carcass handling has been estimated to be approximately 10% of the slaughtered animals (Gondret et al., Reference Gondret, Larzul, Combes and De Rochambeau2005). Considering that the tibia is the main site of bone fracture during slaughtering, large pen rearing housing systems, resulting in decreased intrinsic material stiffness and increased ultimate force, may represent an interest for carcass process.
The greater redness index of meat in rabbits reared in large pen compared to those reared in small pen and caged rabbits can be attributed to enhance of locomotory behaviour. Indeed, it has been shown previously that physical activity increased oxidative energy metabolism and enhanced the proportion of type I and of type IIA fibres rich in mitochondria and myoglobin when compared to sedentary animals (Ducomps et al., Reference Ducomps, Mauriege, Darche, Combes, Lebas and Doutreloux2003; Gondret et al., Reference Gondret, Hernandez, Remignon and Combes2009). As observed in the PCA plot (Figure 1) in our experiment, increased redness was related to low ultimate pH in LL and in BF. This relation was not expected since increase in oxidative muscle metabolism should lead to an increased pHu value (Hulot and Ouhayoun, Reference Hulot and Ouhayoun1999). However, Millet et al., Reference Millet, Hesta, Seynaeve, Ongenae, De Smet, Debraekeleer and Janssens2004 also reported lower pHu and greater redness of the loin in organic housing reared pigs than in conventional pens. Moreover, the lower pHu observed in our study is in accordance with a previous study conducted on alternative housing systems for rabbits (Dal Bosco et al., Reference Dal Bosco, Castellini and Mugnai2002; Dalle Zotte et al., Reference Dalle Zotte, Princz, Metzger, Szabó, Radnai, Biró-Németh, Orova and Szendro2009) and pigs (Lebret, Reference Lebret2008). Conversely, in our study, ultimate pH variations might explain in part differences in moisture content observed in LL and in hind leg muscles.
This study revealed only small modifications to chemical traits and no alterations in rheological traits of loin muscle (LL) and the main three hind leg muscles (ACC, BF and ST). In accordance with the literature, lipids content (Dal Bosco et al., Reference Dal Bosco, Castellini and Mugnai2002; Dalle Zotte et al., Reference Dalle Zotte, Princz, Metzger, Szabó, Radnai, Biró-Németh, Orova and Szendro2009; Gondret et al., Reference Gondret, Hernandez, Remignon and Combes2009) and mechanical tenderness (Dalle Zotte et al., Reference Dalle Zotte, Princz, Metzger, Szabó, Radnai, Biró-Németh, Orova and Szendro2009) was unaffected by pen housing conditions.
In this study, beside growth parameters, bone characteristics and colour variables made the highest contribution to explained variance of PCA. These results accord with a previous study indicating that bone mechanical characteristics played an important part in describing the variation observed in carcasses of rabbits produced according to different breeding systems allowing different growth rates (Combes et al., Reference Combes, Larzul, Jehl, Cauquil, Gabinaud and Lebas2007). Using PCA analysis, we could demonstrate for the first time that housing conditions that enhanced locomotory activities affected three types of traits independently (e.g. growth related traits, meat colour and bone characteristics). However, these effects were of moderate importance since the three groups of rabbits were overlapping on the projection plan of the data, although the first and the second PC opposed large pen housing and the two other groups.
Conclusion
An alternative housing system consisting of small or large pens with platforms as an exercise structure had moderate effects on carcass and meat traits compared to conventional housing. These effects could mainly be observed in an independent manner in traits related to growth performance, colour parameters and bone shape and mechanical parameters. Nevertheless, this study demonstrated that space, allowing rabbits to perform activities like successive hops, had the major effect on carcass and meat traits when comparing large pen to small pen housing. Finally, based on the experiment, it can be stated that large pen housing favours locomotory activities, and induce modifications in carcass and meat quality traits that are in line with consumers’ demand for ‘ethical quality’.
Acknowledgements
The authors thank B. Gabinaud (INRA, UMR 1289 Tandem) and the AFSSA Ploufragan animal caretakers for technical assistance throughout the experiment.