I. INTRODUCTION
Recently, metal and semiconducting oxide nanowires (NWs) have received much attention as they offer a number of unique surface and microstructural properties that can be exploited for a wide range of catalytic, electronic, and optical applications; see, for example, reviews by Barth et al.,Reference Barth, Hernandez-Ramirez, Holmes and Romano-Rodriguez1 Wang,Reference Wang2 and Rao et al.Reference Rao, Deepak, Gundiah and Govindaraj3 These NWs can be grown successfully via a number of techniques, but these often involve the use of complex processing chambers and/or the use of toxic precursor gases and are therefore costly to implement.
Many pure and compounded refractory metals and semiconductors react with O2 gas to produce a volatile oxide vapor at temperatures below the melting point of the solid material. For semiconductors, volatilization of the substrate typically occurs at very low O2 partial pressures and is often referred to as active oxidation, resulting in a decomposition of the substrate surface and the formation of etch pits. Significantly, these oxide vapors can be used as the gas phase source of reactants for the growth of NWs via the vapor–liquid–solid (VLS) growth mechanism. In this case, specialized external vapor sources are not required because the NW vapor precursor is directly produced at the surface of the material where the NWs are to be grown.
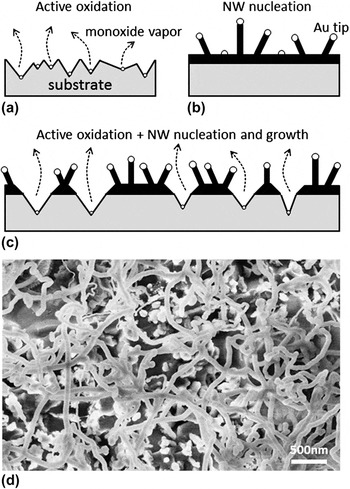
The growth of self-catalyzed metallic oxide NWs, including Fe2O3, CuO, and ZnO, via active oxidation type processes was first reported in the 1950s, but the theory of oxidation failed to explain the observed NW growth.Reference Takagi4 At about the same time, Weiss and WeissReference Weiss and Weiss5 reported the discovery of a new fibrous phase of silica from volatile SiO, which SosmanReference Sosman6 later named silica-w, a work that has essentially disappeared from the literature. Over the subsequent decades, much research has been conducted on understanding, minimizing, and preventing the formation of metal and semiconducting volatile oxidation species, particularly within the development of corrosion-resistant metals for the electric power industryReference Gulbransen7 and stable oxides at high processing temperatures for Si microelectronic applications.Reference Engel8, Reference Engstrom, Bonser, Nelson and Engel9 Research into maximizing and enhancing the active oxidation process has only recently been investigated, primarily from Au-coated Si substrates to produce a vapor source for substochiometric silica (SiOx) NW growth.Reference Kim, Shalav and Elliman10, Reference Shalav, Kim and Elliman11 Figures 1(a)–1(c) schematically illustrate the active oxidation process, NW nucleation, and how these two processes can occur simultaneously on the substrate surface. Figure 1(d) shows a typical scanning electron microscopy (SEM) image of SiOx NWs grown via Au-catalyzed active oxidation of the underlying Si substrate, as schematically illustrated in Fig. 1(c).
Schematic representation of (a) active oxidation, (b) nanowire (NW) nucleation and growth, and (c) NWs grown on the substrate surface where the vapor is produced directly from the underlying substrate via active oxidation. (d) A typical scanning electron microscopy (SEM) image of Au-catalyzed SiOx NWs grown via the active oxidation of the underlying Si substrate.

In this study, we use a simple thermochemical approach to determine the critical O2 partial pressure,  , as a function of temperature, required for the transition from passive to active oxidation of Ge and Si substrates. Annealed Ge and Si samples, with their native oxide intact, were compared with Au-coated samples annealed at different temperatures between 500 and 750 °C for Ge and between 850 and 1150 °C for Si, in a purging N2 atmosphere with a specified residual O2 partial pressure,
 , of <10 ppm. SEM was used to compare the surface morphologies of the annealed substrates. Etching and associated substoichiometric NW growth was clearly observed after active oxidation, whereas the surfaces appeared unchanged during passive oxidation. Experimental transitional temperatures from passive to active oxidation, at the estimated
 , for the Ge and Si samples agree with the predicted theoretical results.
Although etch pits were observed for the Au-coated Ge samples at higher temperatures, germania (GeOx) NWs were not observed, an effect also observed at higher (>1100 °C) temperatures for Au-coated Si samples. Evidence suggests that a buffer layer in the form of a metastable oxide is required during the growth of GeOx and SiOx NWs and that this oxide layer can be chemically and thermally compromised during the active oxidation of Au-coated Ge and Si substrates. This explanation does not address observations of SiOx NWs growing directly out of etch pits, where the native oxide has already been compromised.Reference Shalav, Kim and Elliman11 In these cases, small Au-rich particles have been observed on the walls of the etch pits and are likely to be formed on defect sites, an effect not discussed further in this article.
II. A SIMPLE THERMOCHEMICAL ASSESSMENT
Ge and Si have very similar material properties, especially when processing temperatures are normalized with respect to their melt temperatures.Reference Vanhellemont and Simoen12 Furthermore, GeO2 is a chemical analogue to SiO2,Reference Micoulaut, Cormier and Henderson13 and thin oxides on both Ge and Si desorb as monoxides when annealed at higher temperatures, although decomposition pathways seem to differ.Reference Prabhakaran, Maeda, Watanabe and Ogino14 In this assessment, the pathways for monoxide vapor formation are treated as identical since they are formed via a direct reaction between Ge and Si substrates with O2 rather than the decomposition of the solid oxides.
Passive oxidation of element X (where X = Ge or Si) can be simply described by

where (s) and (g) denote the solid and gaseous phases, respectively. For simplicity, it is assumed that X(s) and XO2(s) are the only solid phases present in the X–O system of interest. Using available thermochemical data,Reference Knacke, Kubaschewski and Hesselman15–Reference Dinsdale18 the transitional equilibrium O2 partial pressure,  , associated with Eq. (1) can be calculated as a function of temperature. XO2(s) does not form until the ambient O2 partial pressure,
 , is greater than
 resulting in two distinct thermodynamic reaction regimes within the X–O system, namely X(s) reactions, for
 , and XO2(s) reactions, for
 .
The active oxidation process where a volatile XO(g) is formed is obtained via the reaction

and is somewhat analogous to the process of incomplete oxidation of C, which produces CO(g). If  , then the XO(g) produced via Eq. (2) reacts with additional O2 to produce XO2(s) via the reaction

Applying Hess’s law, the energy change due to passive oxidation is equal to the sum of the energy changes during the reactions described by active oxidation of X(s), Eq. (2), and oxidation of XO(g), Eq. (3). Equation (1), describing passive oxidation, can therefore be considered to be the combination of these two reactions.
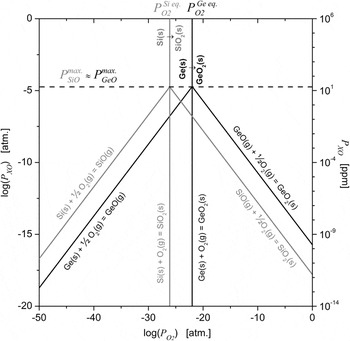
Figure 2 shows the calculated equilibrium partial pressures of GeO(g) and SiO(g) at 660 and 1070 °C, respectively, solved using the reactions described by Eqs. (1)–(3) and available thermochemical data. These temperatures were selected for illustrative purposes because the maximum partial pressures of GeO(g) and SiO(g) at these temperatures are approximately equal (∼20 ppm), twice the value of the maximum O2 partial pressure of the ambient purging gas utilized in this study (specified to be <10 ppm). It can be shown that XO(g) is the dominant vapor species at these lower O2 partial pressures,Reference Nagashio, Lee, Nishimura, Kita, Toriumi, Demkov, Taylor, Harris, Butterbaugh and Rachmady19–Reference Hinze and Graham22 by many orders of magnitude, over the entire temperature range investigated. The maximum XO(g) vapor pressure,  , occurs at the transition from X(s) to XO2(s), corresponding to
 values of the order 10−22 atm
 for Ge at 660 °C and 10−26 atm
 for Si at 1070 °C. For
 , for both the Ge–O and Si–O systems, Eq. (2) proceeds with a very large equilibrium constant suggesting that the reaction is spontaneous and vigorous in the forward direction. As a consequence, almost all the O2 present at the Ge or Si interface will be consumed, i.e.,
 , or in particular
 . For a closed system, the critical O2 partial pressure for the transition from active to passive oxidation,
 , can therefore be approximated by assuming that all the available O2 is consumed via Eq. (2) and yielding a maximum XO(g) partial pressure of
 . At the temperatures illustrated in Fig. 2,
 . From the stoichiometry of the reaction described by Eq. (2), the minimum or critical O2(g) partial pressure,
 , required to maintain
 will be given by

Partial pressures of GeO(g) and SiO(g) at 660 and 1070 °C, respectively, at equilibrium above the solid substrate and solid dioxide. At these temperatures  and corresponds with a
 value of 10 ppm, the upper limit of the residue O2 partial pressure present in the ambient purging gas.

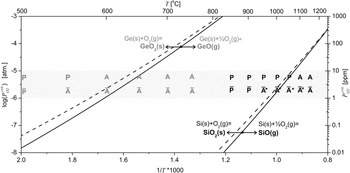
Figure 3 shows the calculated value for  as a function of temperature calculated from Eq. (4) using temperature-dependent active oxidation
 calculations for both the Ge–O and Si–O systems. This simple approximation for
 using steady-state equilibrium calculations agrees well with experimental results of ultrahigh vacuum (a molecular gas-flow regime) active oxidation of Si presented by Gelain et al.Reference Gelain, Cassuto and Legoff23 and Smith and Ghidini.Reference Smith and Ghidini24 WagnerReference Wagner25 first developed a model for active oxidation of Si in inert gas mixtures at a pressure approximately equal to the atmospheric pressure (a viscous flow regime) deriving an equation for
 dependent on the square root of the ratio of the SiO(g) and O2(g) diffusion coefficients close to the substrate surface. If these coefficients are similar, then the ratio is close to one and
 can be approximated by Eq. (4).Reference Hinze and Graham22, Reference Wagner25 To the authors’ knowledge, a proper assessment for
 as a function of temperature for the Ge–O system has yet to appear in the literature, and this is the first time such an approximation has been presented.
 for the transition from passive to active oxidation for the Ge–O and Si–O systems. The shaded region represents the residue O2 partial pressure, estimated to be 1–10 ppm within the experimental set-up utilized. The dashed lines represent
 calculated by replacing solid phase thermochemical data with liquid phase data and illustrate the effect of binary alloying with Au. A and
 represent experimentally observed regions where etching and active oxidation is observed for samples with their native oxides and samples coated with Au, respectively, whereas P and
 represent regions where no etching or passive oxidation occurs. The direct observation of NWs after annealing within the Si–O system are denoted with “*.”

The growth of NWs via the VLS mechanism is generally facilitated by metal catalyst particles that act to absorb and transport vapor phase reactants to the growing NW. In the present study, gold nanoparticles were used for this purpose and were formed by islanding of a deposited thin film. In fact, the Au catalyst has a number of critical roles on Ge and Si substrates, including enhancement of both the decomposition of the native oxide and the active oxidation of the underlying substrate.Reference Shalav, Kim and Elliman11 Ge oxides are less thermally stable than Si oxides,Reference Molle, Bhulyan, Tallarida and Fanciulli26 and for this reason thinner Au films were deposited on the Ge samples in this study to provide better control of Au-mediated oxide decomposition. The observed GeOx and SiOx NWs are substoichiometric, for example, 1.8 < x <2 for SiOx NWs.Reference Sekhar and Bhansali27 An oxygen deficiency is expected via the monoxide vapor–solid reaction 2XO(g) = X(s) + XO2(s) followed by an additional oxidation of some of the X(s) species with residual O2.
At partial pressures of  < 10 ppm,
 occurs at temperatures below the melting points of both Ge and Si but above the Au semiconductor eutectic temperature, a value close to 360 °C for both Ge and Si. The catalyst particles are, therefore, expected to be in a liquid alloy Au–X state. At temperatures below the melting point, the Gibbs free energy of liquid Ge and Si is greater than that of the solid phase and corresponding reactions are therefore more vigorous. Substituting X(l) data, where “l” denotes the liquid phase, for X(s) data in the reactions described by Eqs. (1)–(3) yields higher values of
 at the same temperature, as illustrated in Fig. 3. The Gibbs free energy of a binary alloy Au–Ge and Au–Si systems depends greatly on the constituent compositions,Reference Chevalier28 and the substitution of X(l) into the model is only valid for X compositions close to 1, deep within the X(s) + liquid phase of the binary phase diagram. Nevertheless, this simple substitution illustrates one of the important catalytic roles of the Au on the Ge and Si substrate surface. The model suggests that active oxidation and associated NW growth is expected to occur between 580 and 660 °C for Au-coated Ge and between 960 and 1070 °C for Au-coated Si substrates annealed in an inert gas with a specified O2 partial pressure of between 1 and 10 ppm.
III. EXPERIMENTAL DETAILS
Small samples, ∼1 cm × 1 cm, of commercially prepared undoped (100) Ge wafers (>40 Ω·cm) were coated with ∼1 nm of Au via thermal evaporation. The wafers underwent no treatment to remove their native oxides. Samples, both coated and uncoated with Au, were then individually annealed for 30 min at 500, 550, 600, 650, 700, and 750 °C in a sealed quartz tube furnace purged with N2 gas at a flow rate of 1150 mL/min. The annealing gas was passed through a laboratory drying canister filled with anhydrous CaSO4 but had a specified residual O2 partial pressure of <10 ppm.
Similarly, small samples of (100) Si wafers (p-type, B-doped 10–20 Ω·cm) were coated with ∼10 nm of Au, as well as uncoated Au samples, via thermal evaporation and individually annealed for 30 min at 850, 900, 950, 1000, 1050, 1100, and 1150 °C in N2 (1150 mL/min). The native oxide was also left unaltered for these samples.
A 40- to 50-nm thermal oxide was grown on an additional Ge sample by annealing it for 1 h in a pure O2 ambient at 550 °C (1150 mL/min). The oxide was then removed from half the surface by dipping the sample in distilled H2O. One nanometer of Au was then deposited by thermal evaporation on the entire surface covering both the oxide-grown and oxide-removed regions. The sample was then annealed for 1 h at 550 °C in N2 (1150 mL/min) with the oxide-removed region pointing into the flow of the purging N2.
All samples were characterized using a Zeiss UltraPlus analytical field emission scanning electron microscope(Zeiss, Oberkochen, Germany). Sample cross sections were prepared by cleaving along the <011> direction of the samples.
IV. RESULTS AND DISCUSSION
A. GeOx NW growth
SEM analysis showed that etch pits formed for T > 600 °C on Ge samples with their native oxide only, and for T > 550 °C for the Au-coated samples. As expected, the Au greatly enhanced the active oxidation reaction with evidence of GeO(g) formation occurring close to 50 °C, lower than that for the uncoated Au samples. The regions of observed passive and active oxidations are summarized in Fig. 3 for both the Au-coated and uncoated Ge samples. Interestingly, the transition from passive to active oxidation occurs at temperatures ∼50 °C lower than those predicted by the model. The reason for this is most likely to be an overestimation of the residual O2 partial pressure, estimated to be 1–10 ppm. This estimate is currently based on the manufacturer’s specifications but is known to vary slightly between batches.
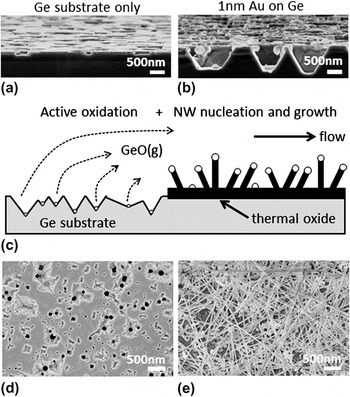
The cross sections shown in Figs. 4(a) and 4(b) clearly illustrate the effect of Au-enhanced active oxidation between an uncoated and an Au-coated Ge sample annealed under the same conditions at 650 °C for 30 min. Although GeO(g) is formed, GeOx NWs were not observed for the uncoated native oxide samples because there was no catalytic Au particles present to nucleate NW growth. More interestingly, no GeOx NWs were observed for the Au-deposited samples either, only enhanced etching was observed. In this case, the presence of Au is believed to have led to the rapid decomposition of the native oxide and alloyed with the Ge substrate to form active oxidation enhancing Au–Ge eutectic regions.
SEM micrographs of cross-sectioned samples (−4° tilt) showing the effects of active oxidation after a 30-min anneal at 650 °C for (a) a Ge substrate with a native oxide and (b) a Ge substrate with 1-nm Au layer deposited over the native oxide. (c) A schematic showing active GeO(g) forming over the oxide-free surface providing the necessary vapor precursor for GeOx NW growth further downstream. Corresponding SEM micrographs of the (d) etched oxide-free region and (e) GeOx NW growth at the interface with the Au-coated thermally deposited oxide region.

SEM micrographs of half of the sample coated with 40- to 50-nm thermal oxide and deposited with Au revealed three distinct regions of interest after annealing for 1 h at 550 °C, namely an etched region, the interface, and a nonetched region. The half with the oxide removed, facing into the flow of the purging N2, was uniformly covered in etch pits, producing GeO(g) that passed over the half of the sample with Au-coated thermal oxide. Within 10–100 μm of the interface, on top of the thermal oxide, GeOx NWs were observed to have grown. For distances greater than ∼100 μm from the interface, over the thermally grown oxide region, no etching or NWs were observed and only Au particles were present on the surface of the oxide. The etched and interface NW growth regions are schematically illustrated in Fig. 4(c) and micrographs from each region are shown in Figs. 4(d) and 4(e), respectively. The growth of NWs within 10–100 μm of the interface is consistent with gas phase diffusion of the GeO(g) suggesting that a critical vapor concentration for NW growth is required. For distances greater than ∼100 μm from the interface, the GeO(g) concentration is insufficient to support NW growth.
B. SiOx NW growth
Etch pits were observed to form on uncoated Si samples at T > 1100 °C, but no NWs were observed in this case. Decomposition of native Si oxides and substrate etching are known to occur during high-temperature annealing and to be significantly enhanced by small amounts (monolayers) of metallic impurities.Reference Liehr, Dallaporta and Lewis29
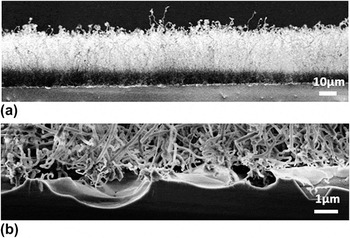
In contrast, samples annealed in the temperature range 950 < T < 1100 °C were found to have undergone extensive active oxidation, and to be covered in etch pits and SiOx NWs, as summarized in Fig. 3. This is different from the situation for Ge, and is consistent with Au-enhanced heterogeneous decomposition of the native oxide and Au-catalyzed VLS growth of NWs, as schematically illustrated in Fig. 1(c). Figure 5 shows typical cross-sectional SEM images of SiOx NWs grown at a temperature close to 1100 °C. The NW lengths are typically tens of micrometers, consistent with a diffusion-limited SiO(g) boundary layer and with the distance over which GeOx NW growth is observed from the edge of an oxide thin film. Figure 5(b) shows a close-up of the Si–SiOx NW interface from the sample shown in Fig. 5(a) where etch pits and NW growth are both observed and corresponds with the situation schematically illustrated in Fig. 1(c).
(a) A typical SEM cross-sectional image of the uniformly grown NW film on Si. (b) SEM close-up of (a) represented schematically by Fig. 1(c).

Interestingly, no SiOx NWs were observed on samples annealed at 1150 °C, even though significant Si etching is apparent. Under these conditions, it is likely that the native oxide has been completely decomposed by the Au catalyst and all the Au is in direct contact with the Si substrate, a situation similar to that observed during Au-catalyzed oxidation of the Ge samples. This suggests that the residual oxide is important for the growth of SiOx NWs, perhaps by decoupling the catalyst particle from the crystalline Si substrate and enabling it to reach supersaturation.
V. CONCLUSIONS
It has been shown that a simple thermodynamic model can be used to predict the critical O2 partial pressures required for optimum active oxidation of Ge and Si substrates and that this process offers a cost-effective method for producing a vapor source for the growth of GeOx and SiOx NWs. It has further been shown that gold catalyst particles enhance the active oxidation process. Model predictions were compared with experimental data on Au-coated and uncoated Ge and Si samples, and the results are shown to be in broad agreement with the model, although an overestimation of the residue O2 partial pressure within the experimental setup is likely. Other than enhancing the active oxidation process, Au nanoparticles facilitate NW growth and at high annealing temperatures evidence suggests that this requires a buffer layer to separate the catalyst particle from the crystalline semiconductor substrate.
Finally, we have demonstrated that GeOx NWs can be grown on a thermal oxide utilizing a neighboring active oxidation-mediated vapor source. However, for the conditions reported in this study, no NWs were observed on Ge surfaces with Au-coated native oxide layers, even when etch pits were evident. This suggests that GeOx NW growth requires the catalyst to be isolated from the Ge substrate by an oxide buffer layer and that the native oxide layer is removed too rapidly during high temperature annealing to serve this purpose. It should, therefore, be possible to grow a uniform GeOx NW film by optimizing the annealing conditions and the oxide thickness. The ideal conditions for uniform NW growth across both Au-coated Ge and Si substrate is, therefore, primarily dependent on the O2 partial pressure, the annealing temperature, and the oxide and Au thicknesses.
ACKNOWLEDGMENTS
The Australian Research Council is gratefully acknowledged for financial support. The Australian National University nodes of the Australian Nano Fabrication Facility and the Australian Microscopy & Microanalysis Research Facility, both established under the Australian National Cooperative Research Infrastructure Strategy, are acknowledged for access to the facilities used in this work.