Introduction
Strengthening of metals by grain refinement has long been described by the empirical Hall–Petch (HP) relationship [Reference Hall1, Reference Petch2], which was originally proposed for iron/steel over sixty years ago:
 $$\sigma = {\sigma _{\rm{i}}} + k{d^{ - n}}\quad ,$$
where σi is the lattice friction stress, d is the grain size, k is the parameter representing the strength of the grain boundary, and n is often taken as 0.5. Armstrong [Reference Armstrong3, Reference Armstrong4] and Hansen [Reference Hansen5] showed further the utility of Hall–Petch relationship in describing the grain size dependence of strength in other metals as well as in correlating other mechanical properties. These assessments, however, were for a limited range where the grain size, which typically varied from tens of micrometers to hundreds of micrometers. The HP form is often used in the interpretations of grain size effect on strength of metals and is often believed to arise from the operation of a single yielding mechanism, which may be either Cottrell’s pileup mechanism [Reference Cottrell6] or Li’s dislocation source mechanism [Reference Li7]. However, the long standing question of which mechanism provides the HP form of strengthening is yet to be resolved.
It has been understood that HP relationship is empirical and is useful for limited representations of grain size effects on strength. However, there does not seem to be much support for its validity over a wide grain size range. The HP form runs into difficulties when extended over multiple length scales of grain size, especially into the nanoscale. One of the major problems is that, when the HP equation is applied to different experimental datasets generated at different grain size ranges, it leads to varied values of σi and k. Anderson et al. [Reference Anderson, Law, King and Spreadborough8] showed this on the basis of evaluation of datasets from thirteen different investigations of iron/low-C steel. Their collection consisted of strength data obtained at comparable strain rates, hence, any strain rate effect can be considered to be absent. When the strength data were plotted as a function of d −1/2, the trend was in fact nonlinear over the wide range (4–180 µm) of grain size. When individual datasets were fitted with the HP equation, which was essentially by letting σi and k to float free, it was found that σi can vary from 25 to 89 MPa and k can vary from 0.39 to 0.71 MPa m1/2. The question of why a nominally same material (Fe) should lead to varied σi and k values, between different investigations, is then very difficult to explain. This suggests that the problem may be in the analysis method and not in the material. They also concluded that the collected data could be explained only on the basis of a nonlinear strength dependence of grain size. These findings raise significant doubts of the validity of HP relationship even in the micron-size range.
Strength values were also found to reach a saturation stress at extremely small grain sizes. Armstrong [Reference Armstrong4] and Lesuer et al. [Reference Lesuer, Syn and Sherby9] showed that, in the nanometer grain size range, the experimental strength actually tends to a nearly constant stress, deviating significantly from the HP trend projected from the midgrain size range. This feature was also noted by Anderson et al. in their analysis [Reference Anderson, Law, King and Spreadborough8]. This apparent saturation of strength cannot be represented by the HP form. In fact, extension of the HP equation (n = 1/2) into the nanoscale size range for Fe (taking σi ∼ 50 MPa for single crystal Fe and an average value of k ∼ 0.55 MPa m1/2 from the compilation of Anderson et al.) predicts a strength value of 31,804 MPa at the limiting grain size equal to Burger’s vector (∼0.3 nm). Theoretically, the maximum strength can only be as high as that corresponding to the theoretical shear strength, which is about 13,687 MPa (σth = 2τth = 2G Fe/2π; with G Fe = 86 GPa, where G Fe is the shear modulus of Fe). Therefore the upper limit strength of Fe cannot be higher than 13,687 MPa. Therefore, fitting the data to the HP form over limited ranges of grain size is possible only if the HP behaviors at the extremes of grain size (i.e., values of σi and σth) are allowed to float freely. This illustrates one of the major difficulties with the HP form.
Grain size and strength data for pure Fe over multiple length scales
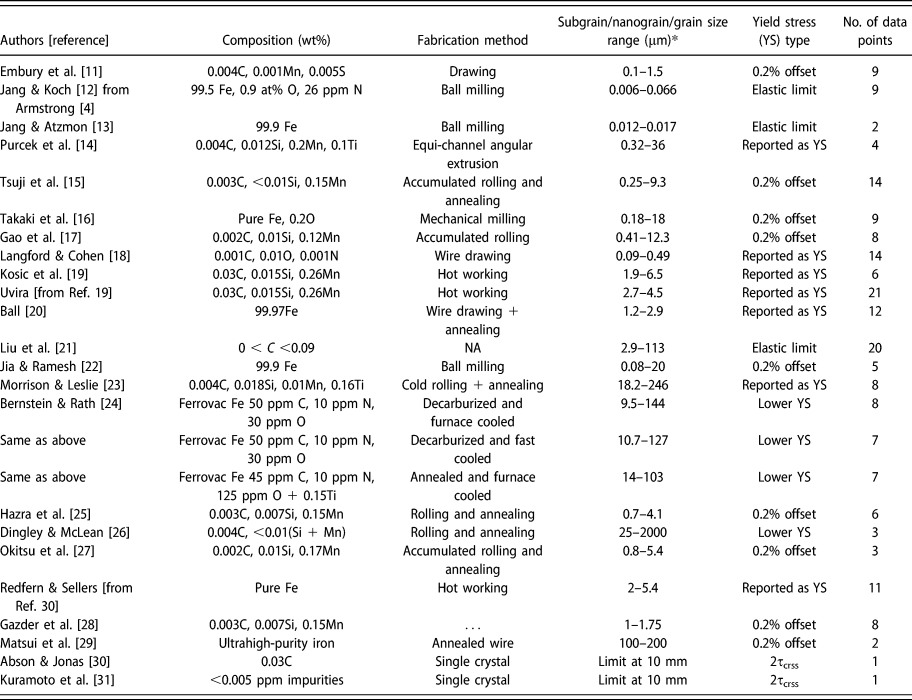
It can be argued that the compilation of Anderson et al. contained steels that varied in purity and that the range of grain sizes employed is not wide enough. A large compilation of strength versus grain size data for pure Fe, carefully screened for the composition, were made in this study for a rigorous evaluation of the HP equation over a wide length scale. The sources of the yield strength data are compiled in Table I. The strength and grain size values were either listed in a table or presented in a graph in the publications. The yield strength either corresponds to 0.2% offset stress or lower yield stress (in discontinuous yielding) or what was indicated as yield strength in these publications. When discontinuous yielding occurs, Petch [Reference Petch10] suggested the use of lower yield stress, in assessing grain size effect, as this corresponds to slip expansion through a grain corresponding to the development of Luders strain. This procedure was followed in determining the yield strength for some of the datasets in the compilation. The type of yield stress for each dataset is also indicated in Table I.
Source, composition, fabrication method, and the grain size range for the experimental strength data for pure Fe corresponding to a restricted composition range (see text). All the strength values are from tensile tests as reported in the original publications.

* Average size of grains (commonly the mean linear intercept distance) as reported in the respective studies.
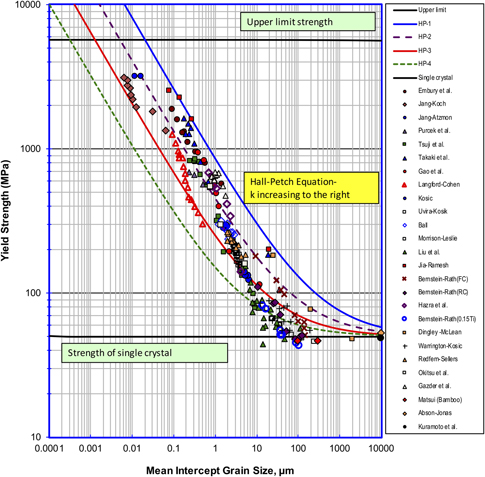
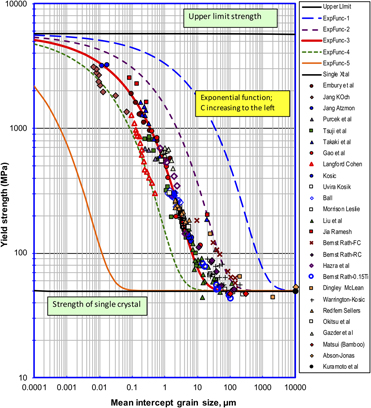
The compiled yield strength data as a function of grain size are plotted in Fig. 1. The data include strength data for nearly pure Fe samples with a relatively low carbon content (0.001 ≤ C ≤ 0.07 wt%) and with low levels of solid solution elements (Si and Mn each < ∼0.3 wt%). This restriction to a narrow C content is important, in the interest of screening data for nominally pure Fe, because the strength of Fe is sensitive to C content. At the upper limit of 0.07%C, the estimated amount of pearlite in the microstructure is ∼5% which is not considered to affect the yielding of Fe grains. The data cover a wide size range of grain size, which may be the average size of subgrains, nanograins, or conventional grains in the microsructure. The polycrystalline yield strength data are from the published works of Embury et al. [Reference Embury, Keh and Fisher11], Jang and Koch [Reference Jang and Koch12], Jang and Atzmon [Reference Jang and Atzmon13], Armstrong [Reference Armstrong4], Purcek [Reference Purcek, Saray, Karaman and Maier14], Tsuji et al. [Reference Tsuji, Ito, Saito and Minamino15], Takaki et al. [Reference Takaki, Kawasaki and Kimura16], Gao et al. [Reference Gao, Chen, Chen, Kamikawa, Shibata and Tsuji17], Langford and Cohen [Reference Langford and Cohen18], Kosik et al. [Reference Kosik, Abson and Jonas19], Uvira [from Ref Reference Kosik, Abson and Jonas19], Ball [Reference Ball20], Liu et al. [Reference Liu, Armstrong and Gurland21], Jia and Ramesh [Reference Jia, Ramesh and Ma22], Morrison and Leslie [Reference Morrison and Leslie23], Bernstein and Rath [Reference Bernstein and Rath24], Hazra et al. [Reference Hazra, Pereloma and Gazder25], Dingley and McLean [Reference Dingley and McLean26], Okitsu et al. [Reference Okitsu, Takata and Tsuji27], Redfern and Sellers [from Ref. Reference Abson and Jonas30], and Gazder et al. [Reference Gazder, Cao, Davies and Pereloma28]. The yield strength data from Matsui et al. [Reference Matsui, Moriya, Takaki and Kimura29] for high-purity Fe wires having very large grains, in the form of bamboo structure, are also included to fill the region of very large grain sizes. Additionally, yield strength data for pure Fe single crystals were obtained from Abson and Jonas [Reference Abson and Jonas30] and Kuramoto et al. [Reference Kuramoto, Aono and Kitajima31]. These data are plotted against 10 mm grain size in the abscissa in Fig. 1, as limiting stress at infinite grain size.
Plot of yield strength versus ferrite grain size for Fe and the predictions from Hall–Petch equation with σi = 50 MPa and for multiple values of k (from the top: 800, 400, 200, 100 MPa µm1/2).

Figure 1 also includes the plots of HP equation with σi = 50 MPa and for multiple values of the slope parameter, k (from top: 800, 400, 200, and 100 MPa µm1/2, selected arbitrarily to cover the data). The upper horizontal line indicates the upper limiting stress for dislocation nucleation, taken here as σS = 2G Fe/30 = 5733 MPa; as estimated by Cottrell [Reference Hull32, Reference Cottrell33]. This is on the basis of the fact that if dislocation expansion is considered to correspond to yielding, then the meaningful upper limit for this is the stress for dislocation nucleation in a defect-free crystal. However, it is noted that this may be one of the several limiting possibilities, depending on the mechanism of deformation. The lower horizontal line represents the lower limit of strength, corresponding to the single-crystal yield strength. This is taken to correspond to the room temperature yield strength data of Fe single crystals as reported by Abson and Jonas [Reference Abson and Jonas30] and Kuramoto et al. [Reference Kuramoto, Aono and Kitajima31], which are also plotted in Fig. 1 at the largest limiting grain size (10 mm in the graph). Additionally, a recent NIST report [Reference Lucon, Abiko, Lambrecht and Rehmer34] of round robin tests of coarse-grained ultrahigh-purity iron, indicated that σi ∼ 50 MPa (averaging over the strain rate range: 10−5–10−3/s), which is supportive of the lower limit strength value of pure Fe.
Figure 1 illustrates the problems arising from the application of HP equation over a wide range of grain size. First, none of the individual datasets seem to agree well with any of the hypothetical HP curves. This is largely because of the enforcement of the lower limit constraint that σi = 50 MPa on the HP form. Acceptable fitting of individual datasets, with the HP equation, requires that the end limit constraint (σi = 50 MPa) be eliminated—each dataset can then be easily fit with arbitrary values of σi and k. This is not meaningful because not only will this produce varying values of σi for pure iron between the datasets, but also the values will be in disagreement with the experimental strength data for single crystal. Second, in the limit of infinitesimal grain size, that is approaching the lattice spacing, the strength should approach the limiting stress for the operating dislocation mechanism. For example, this can be considered as the limiting stress for dislocation nucleation (σS) in Fe, as estimated by Cottrell. It is evident that in Fig. 1, none of the HP curves properly tend to this limit—they actually predict strengths greater than the upper limit strength, which is not realistic. The bottom curve, plotted in Fig. 1 for k = 100 MPa µm1/2, was made by forcing the HP strength, in the limit of lattice spacing (∼0.3 nm), to be equal to σS (5733 MPa). It can be seen that most of the experimental data in the nano to micron size range are way off the HP curve made with this enforcement. Third, several experimental data at grain sizes > ∼50 µm do not show significant strength dependence on grain size and this behavior is not satisfactorily represented by the HP equation.
The present evaluation reaffirms previous studies, which have historically pointed out that the Hall–Petch relationship does not adequately describe the grain size effect over a wide range of grain sizes and that the inverse square-root form is not universal. Several previous studies [Reference Lesuer, Syn and Sherby9, Reference Langford and Cohen18, Reference Baldwin35, Reference Christman36] have shown that a given set of strength versus grain size data can be represented equally well either with n = 1 or with n = 1/3 giving a wide latitude for the parameter n. Significant deviations in strength values from the HP trend were also observed by Young and Sherby [Reference Young and Sherby37] for 1018 steel at grain sizes <1 µm. Gertsman et al. [Reference Gertsman, Hoffmann, Gleiter and Birringer38] found that for Cu with grains in nanometer range (30 nm to 180 µm), the HP relationship was not obeyed. Attempts were also made recently to modify the HP form to include grain misorientation effects, such as that proposed by Hansen [Reference Hansen39]. Two most recent reviews by Dunstan and Bushby [Reference Dunstan and Bushby40], and Cordero et al. [Reference Cordero, Knight and Schuh41] also conclude that the grain size strengthening, interpreted in terms of Hall–Petch effect, does not scale as n = 1/2. In fact, this parameter was found to vary from 0 to 1 in BCC metals. It is to be noted that subscription to varying n values may not be meaningful as this would permit varied theoretical constructions depending on the n value (e.g., n = 1/3 and 1) to explain a given set of data, which is not warranted. Therefore, it is reasonable to suppose that n should have some fixed value in any allowable functional form, such that the experimental data could be explained by a single theory. There are also studies [Reference Suryanarayana, Mukhopadhyay, Patankar and Froes42, Reference Nieh and Wadsworth43, Reference Pande and Cooper44] on nanograined metals, which suggest that there might be “inverse” HP behavior where the strength actually begins to drop at sizes below a critical nanograin size, which is believed to be ∼10 nm. The inverse behavior is not seen in the data compiled in this study for pure Fe—the lowest grain size in the data is >10 nm.
The proposed exponential function
Theory [Reference Li7], electron microscopy [Reference Murr45, Reference Murr46, Reference Kumar, Suresh, Chisholm, Horton and Wang47, Reference Murr48], and atomistic modeling [Reference Van Swygenhoven, Derlet and Froseth49, Reference Van Swygenhoven, Derlet and Hasnaoui50] increasingly support the idea of dislocation nucleation from grain boundaries during yielding in polycrystals. It is also well known that as the grain size becomes extremely small, the extent of slip or ductility is severely restricted by the presence of high density of grain boundaries in the material. On the other hand, as the grain size becomes infinitely large or in a single crystal, slip and its expansion through the lattice are completely unobstructed. On the basis of these observations, a phenomenological functional form can be proposed, subject to meaningful physical boundary conditions at the extremes of grain size. In mathematical physics, the boundary conditions are the ones that guide the development of proper analytical functions that describe physical phenomena. Intuitively, the physical boundary conditions here are:
(i) In the limit of d → 0, the strength σy → σS as the upper/saturation limit strength. For example, this may be the limiting stress for dislocation nucleation (or slip inhibition) in a crystal as estimated by Cottrell (σs = 2τs = 2G/30; Refs. Reference Hull32 and Reference Cottrell33). This is also consistent with the vanishing of plastic strain or ductility in materials as the infinitesimal grain size is approached.
(ii) In the limit of d → ∞, the strength σy → σi as the lower limit on the strength, which corresponds to the critical resolved shear stress for slip. This is consistent with the uninhibited expansion of slip at infinite grain size or in the single crystal.
(iii) The function should be monotonic and nonlinear, to represent the data accurately, with a least number of unknown parameters.
(iv) In order to be consistent with a constant mechanism of hardening, the power on the grain size parameter should be invariant over the scale of the grain size.
The first two represent the physical boundary conditions that are required to be satisfied by the function at the extremes of grain size. The simplest functional form, which can satisfy all the criteria above, is as follows:
 $${{\left( {{\sigma _{\rm{y}}} - {\sigma _{\rm{i}}}} \right)} \over {\left( {{\sigma _{\rm{S}}} - {\sigma _{\rm{i}}}} \right)}} = \exp \left\{ { - C{{\left( d \right)}^{1/3}}} \right\}\quad ,$$
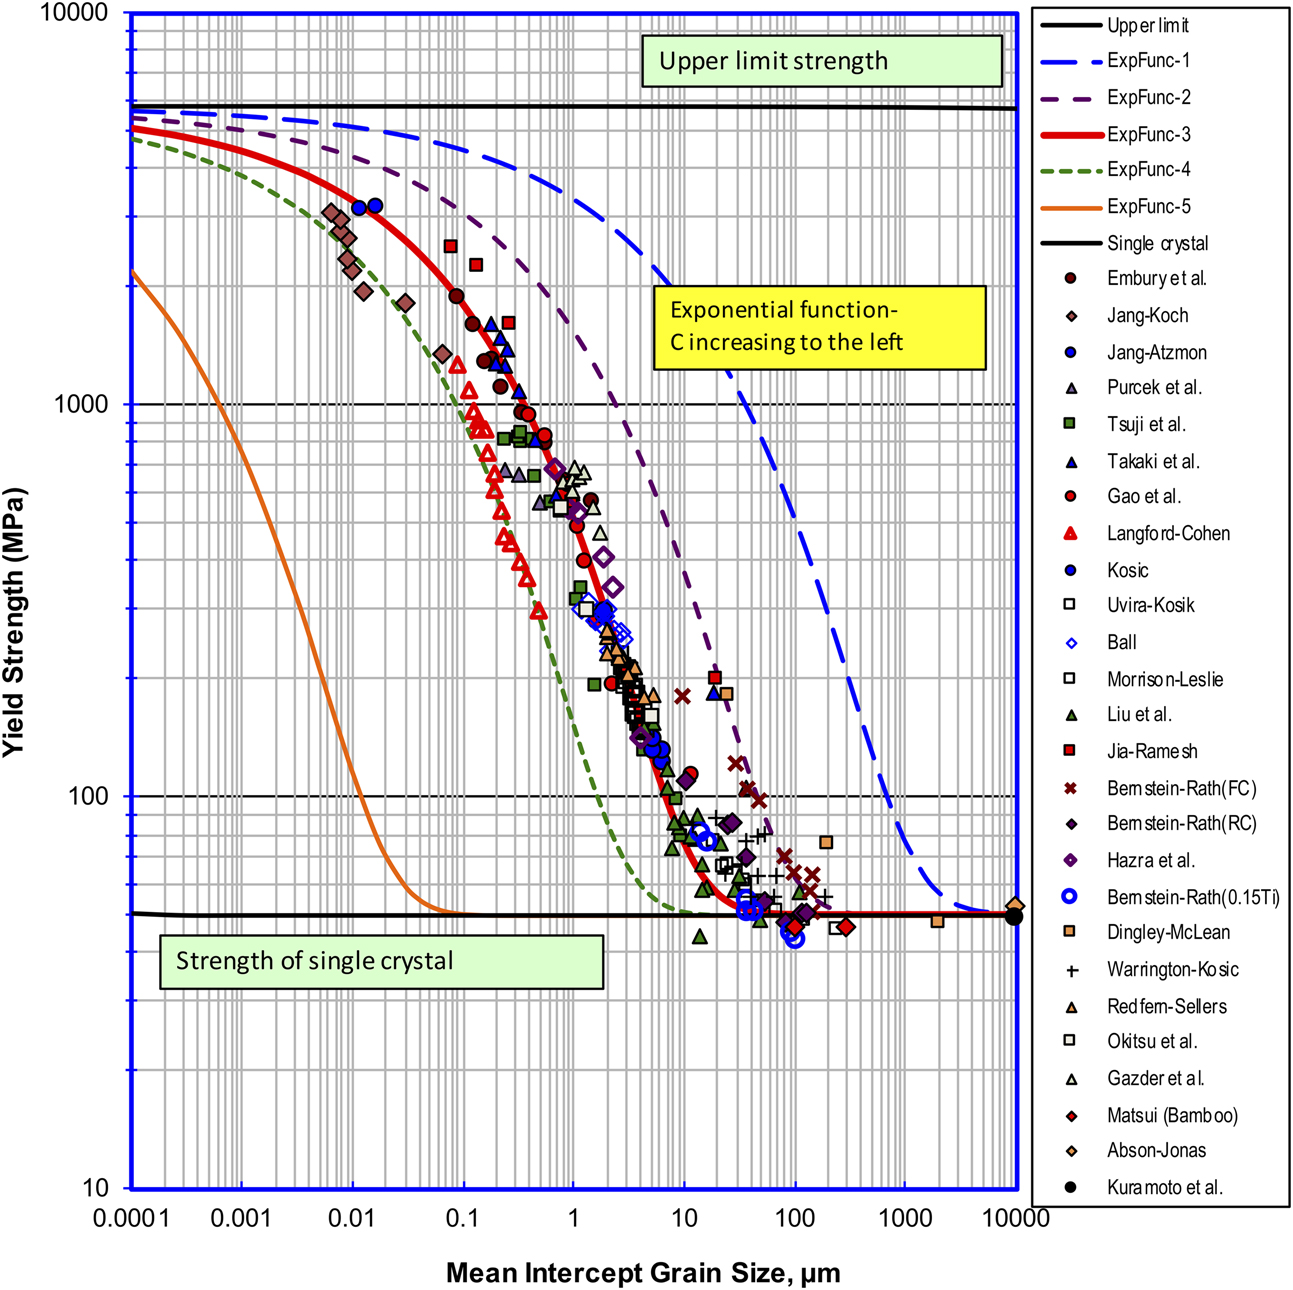
where σi is the strength in the limit of infinite grain size (strength of single crystal), σS is the limiting stress for dislocation nucleation, d is the mean intercept size of ferrite grains, and C is a parameter that may be considered here to represent the relative ease of dislocation slip through the grain. In Fig. 2, this equation is used to compare with the extensive experimental data on pure Fe.
Plot of yield strength versus grain size for Fe and the predictions from the exponential equation with σi = 50 MPa and for multiple values of C (from the top: 0, 0.55, 1.35, 2.52, 4, 20, and infinity; (µm)−1/3).

Figure 2 illustrates the curves predicted by the exponential function, obtained by varying C values and plotted against the experimental data on pure Fe. In plotting this equation, the boundary condition values of σS (upper limiting stress) and σi (lower limiting stress) were constrained as 5733 MPa (σS = 2τs = 2G Fe/30) and 50 MPa, respectively, for all C values. The C value for the middle curve (2.52) was determined by nonlinear regression analysis as described in the next section. For other curves, the value of C was varied arbitrarily from 0.55 (top curve) to about 20 to generate the four curves from top to bottom. The horizontal lines at the top and the bottom of the figure correspond to the predictions from the exponential function, for C = 0 and C = ∞, respectively. It is evident that the physical limits to the strength are correctly generated by the exponential function. It can also be seen that the exponential function describes the strength versus grain size data, over a wide length scale, remarkably well. Over 90% of the data points (186 out of ∼200 data points) agree well with the central curve [ExpFunc-3 with C = 2.52 (µm)−1/3]. The remaining data, which appear to be stacked in layers, are also represented well by varying values of C. This indicates the validity of the proposed function for a wide range of C values, which are necessary to explain the stacking or layering of data. The C value may represent the relevant microstructural state of a material. It should be emphasized that although the purity of Fe in the studies considered are roughly similar, differences in strength levels can arise from the differences in the internal structural state of the samples prior to testing. The differences between the processing methods and the extent of deformation and annealing can lead to different residual dislocation structures, which can influence any operational dislocation mechanism at yielding. Therefore, the variation of C parameter can be thought of as rationalizing the differences in the internal microstructural state of iron caused by the differences in the processing conditions in different studies.
Statistical analysis of correlation
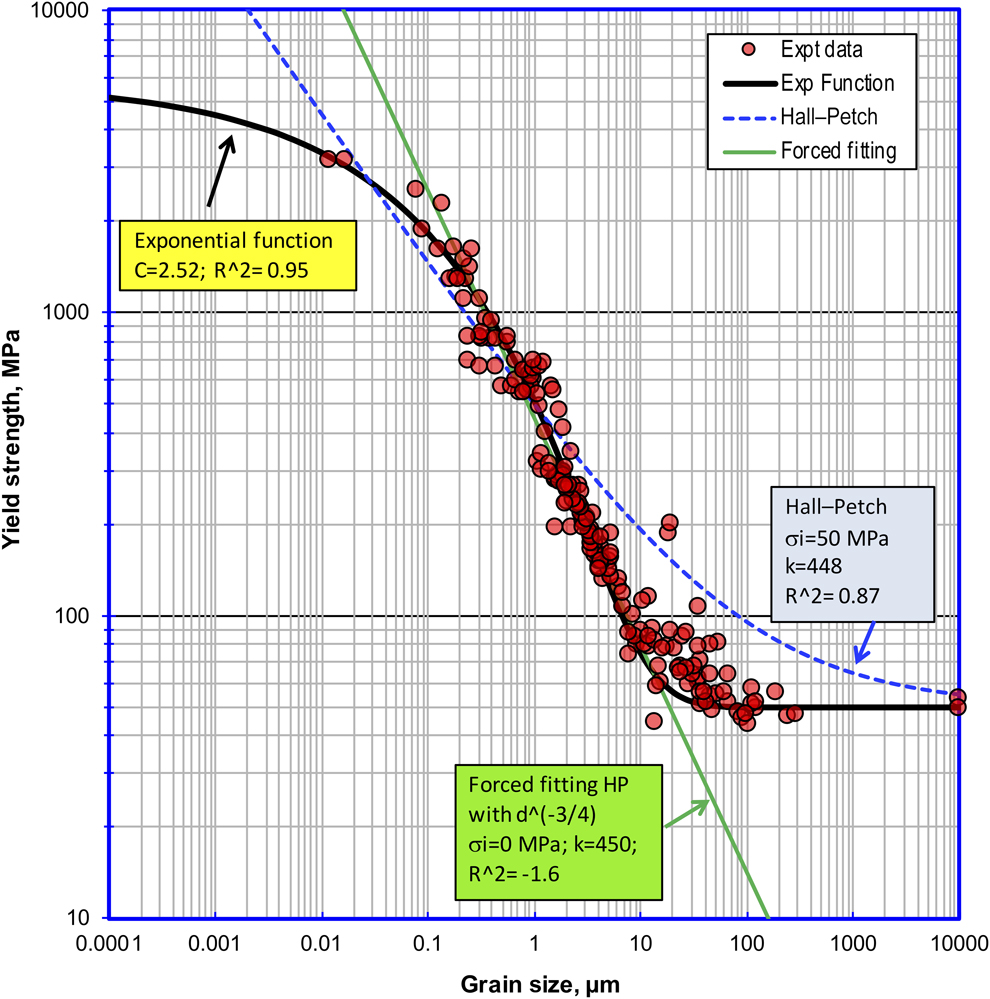
A nonlinear regression analysis was performed to determine how well the proposed exponential function represented the experimental data. The data points lying close to the central curve for C = 2.52 in Fig. 2 were used in this analysis. These included all the data with the exception of data from Jang and Koch, Langford and Cohen, Bernstein and Rath (furnace cooled), and Dingley and McClean, as these data points fall along the curves with other C values in Fig. 2. The nonlinear regression of the data against the exponential function was performed using the Solver module in MS Excel by constraining all the parameters (σS, σi, and 1/3) except the parameter C in Eq. (2). In this regression analysis, the grain size is the independent variable and yield strength (σy) is the predicted variable. The correlation coefficient (R 2) was determined by
 $${R^2} = 1 - {{\sum\limits_1^p {{{\left( {{Y_{\rm{i}}} - {Y_{{\rm{iF}}}}} \right)}^2}} } \over {\sum\limits_1^p {{{\left( {{Y_{\rm{i}}} - \bar{y}} \right)}^2}} }}\quad ,$$
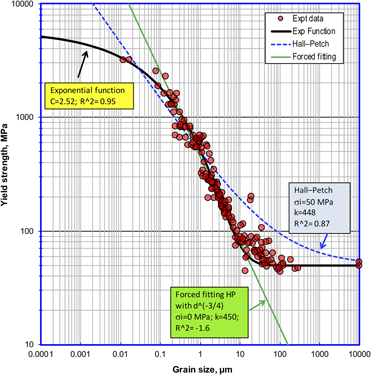
where Y i is the experimental yield strength and Y iF is the predicted yield strength (by the function considered) as a function of grain size,  $\bar{y}$ is the average of all experimental yield strength values and p is the number of points. The correlations of various functional forms are shown in Fig. 3. The exponential function, with C = 2.52, provides a R 2 value of 0.95 for about 186 data points in the figure. This is a very high degree of correlation by the proposed functional form. For the HP equation [Eq. (1)] with the intercept σo and the exponent values constrained at 50 MPa and 0.5, respectively, the regression analysis found the Hall–Petch slope, k = 448 MPa m1/2 yielded a R 2 value of 0.87. However, as shown in Fig. 3, one might be enticed to draw a straight line through the data—this is only possible if σo is set to zero and an exponent of 0.75 is used in the HP relationship. The resulting correlation coefficient value, with k = 450 MPa m1/2, is negative (−1.6), which is the result of letting σo = 0, and hence it is not a meaningful correlation. The negative correlation is largely due to the influence of experimental data points, lying far away from the straight line, at the extremes of grain size.
Statistical analysis of correlation of various functional forms against the bulk of experimental data.
Discussion
The exact theory of grain size strengthening that would give rise to the exponential function, however, remains to be constructed. The present proposal may be helpful in finding the right theory because it is shown that only the present exponential function fits the experimental data well. This means that any acceptable theory should analytically reduce to this function. However, the exponential form is not suggested here in an entirely arbitrary manner. There is some physical meaning behind the proposed phenomenological function, which may help toward justifying its validity. The left side of Eq. (2), it represents the fractional increase in yield strength (σy − σi), relative to the maximum increase (σS − σi) possible by grain size strengthening. This can be thought of as the probability of finding a dislocation source operating to produce yielding at a given grain size and at the stress corresponding to the observed strength σy. The right side can be thought of as the relative severity or probability with which the grain boundary acts as barrier to dislocation nucleation. This interpretation may help to develop a rigorous theory for grain size strengthening in iron.
It is striking that the proposed exponential function represents a large number of datasets with a high degree of fidelity, with several advantages. First, the data in Fig. 2 appear to be roughly stacked in three groups, represented by varying values of C, which may in fact reflect varying degrees of yielding or slip expansion through the material. Nevertheless, regardless of the C value, all the curves consistently converge to the end limits correctly as required by the boundary conditions 1 and 2. Second, C = 0 in the proposed function reflects the upper limiting stress for dislocation slip/nucleation, which is the most restricted slip at one extreme. At the other extreme (C = ∞), it represents the unobstructed yielding of a single crystal (lower limit stress). Therefore, it appears that C scales with the ease of dislocation slip at the yield point, with increasing values of C associated with an increase in the extent of slip expansion through the crystal. The stacking of the predicted curves for various C values as well as the corresponding experimental data is consistent with this relative ease of slip. As pointed out before, this stacking might be explained on the basis of the internal microstructural state or the residual dislocation structure in the material. Third, the curves are asymptotic in the nanometer grain size region, which seem to describe well the saturation of strength in the nanograin regime as observed in some studies [Reference Suryanarayana, Mukhopadhyay, Patankar and Froes42, Reference Nieh and Wadsworth43]. Furthermore, the asymptotic behavior in the very large grain size region (>50 µm) also reproduces accurately the weak or no apparent effect of grain size on strength in this regime. The function is monotonic and nonlinear, which satisfies the constraint conditions 3 and 4. Mathematically, the exponential function is the simplest form that is capable of meeting the physical requirements stated above and it is doubtful that any simpler function could be found.
It may be relevant to discuss the potential dislocation mechanism that may govern the present exponential function. In terms of dislocation mechanics, either dislocation pileup theory [Reference Cottrell6] or the theory based on dislocation emission from grain boundaries [Reference Li7] may lead to the development of a robust theory for the grain size strengthening, but the challenge is to analytically work out the exact theory. Additionally, some recent theories, which may apply in the conventional microcrystalline grain size range, may be considered. For example, Asaro and Suresh [Reference Asaro and Suresh51], observing the change in activation volume of deformation with grain size, suggested either dislocation emission or twin emission from stress concentrations at the grain boundary may be used to develop a theory for the grain size effect. However, they noted the difficulties in comparing the theory with the experimental data and suggested that there may be different mechanisms operating at different size ranges. It is to be noted that only the dislocation pileups (Cottrell’s theory) and the dislocation emissions from grain boundary ledges (Li’s theory) are the two main stream mechanisms that have been part of the long-term debate on grain size strengthening in the microcrystalline range. Therefore, for the development of a reliable theory, the dominant mechanism of hardening must be settled first.
Strengthening by interfaces, over a wide length scale of layer spacing, in metallic multilayers has been theoretically assessed by Misra, Hirth, and Hoagland [Reference Misra, Hirth and Hoagland52]. The authors divided the multilayer strengthening into three regimes: 1–2 nm; few nm to tens of nm, and submicron to micron ranges of layer thickness. In these regimes, dislocations crossing the interface, dislocations bowing within a layer but locked at the interface, and dislocations piled up at the interface, respectively, have been suggested to be the mechanisms controlling the strength. A common feature in these three mechanisms is the involvement of the multilayer interface in locking or providing a barrier to the dislocation line, which may be generally considered as the resistance of the interface to slip. The schematic strengthening line hypothesized in this work resembles the trend predicted by the exponential function proposed in this study. A similar consideration of resistance by grain boundary to the dislocation nucleation/propagation may explain why the proposed exponential function represents the grain size effect on strength over a wide length scale. However, the challenge is to work out a theory that may yield the exponential form based on the operating mechanisms.
There is another competing theory based on the net effect of dislocation pileup, dislocation emission, elastic incompatibilities between grains, and grain boundary work hardening, as proposed by Meyers and Ashworth [Reference Meyers and Ashworth53] and Fu et al. [Reference Fu, Benson and Meyers54]. A special feature of this theory is that it leads to the prediction of the asymptotic saturation of strength at extremely small grain sizes, but at sizes < ∼30 nm. This behavior is seen in the experimental data compiled here as well as in the data presented by Fu et al. [Reference Meyers and Ashworth53]. Many other studies also have shown that in the nanocrystalline size regime, especially <10 nm, the strength levels of some metals often saturates to a constant value. This asymptotic behavior is in fact predicted well by the proposed exponential function, provided that the asymptotic limit stress for the governing mechanism is taken for the prediction. It might be worthwhile to further explore how the theory by Meyers and Ashworth could lead to a sigmoidal shape of the strength–grain size data variation, which is the main characteristic of the data shown in Figs. 2 and 3 and how a final exponential form may be analytically determined.
The asymptotic saturation of strength at nanocrystalline region, however, is in contrast to the softening, suggested to be present in this region (typically <10 nm), in some studies. This softening phenomenon, as reported, questioned, and debated in the nanocrystalline material literature, must also be settled first for the development of any reliable functional form to represent the effect of grain size on strength. The decrease in strength in nanocrystalline regime of Cu and Pd, over a size range of about 6–16 nm, was first attributed to diffusional creep and/or grain boundary sliding by Chokshi et al. [Reference Chokshi, Rosen, Karch and Gleiter55]. Weertman [Reference Weertman56] however considered that this decrease was due to flaws in the material, and was suspected to be the result of one sample that was annealed repetitively to obtain the different grain sizes. This and the lack of convincing experimental evidence of any softening mechanism raise the doubt whether the decrease in strengths observed at sizes < ∼10 nm, is a real phenomenon or an artefact. However, disregarding the softening part for now, there is indeed a large amount of experimental data supporting the asymptotic saturation of strength at nanocrystalline sizes approaching about 10 nm. A few such data were compiled for pure metals such as Cu and Ni in an excellent review by Meyers et al. [Reference Meyers, Mishra and Benson57]. The asymptotic behavior of the proposed exponential function appears to be consistent with the saturation of strength at sizes approaching the lattice spacing. It is therefore hoped that a reliable theory may be constructed and that the present work could serve as a basis toward that purpose.
Conclusions
A phenomenological exponential function for the grain size effect on strength of metals has been proposed. The function is shown to represent the variation in yield strength as a function of grain size for pure Fe, over multiple length scales, remarkably well. A nonlinear regression analysis indicated that the function provided a very high degree of correlation of data. The functional form has been determined by imposing the physical boundary conditions at the extremes of grain size, that is, strength asymptotically reaching the correct end limits—the limiting strength for dislocation nucleation at infinitesimal grain size and the strength of single crystal at infinite grain size. The exponential form offers significant improvement over the Hall–Petch relationship and could be used as a guide to develop a reliable theory of grain size strengthening.
Acknowledgment
The author thanks Prof. R.W. Armstrong, University of Maryland, for his comments and suggestions on the manuscript. The suggestions of the two reviewers greatly helped to improve the manuscript.