




1 Introduction
Turbulent flows in modern gas turbine combustors often exhibit periodic oscillations due to hydrodynamic and acoustic instabilities as well as non-periodic dynamics such as flame lift-off, flashback and bistability. In addition, stochastic combustion noise and intermittent bursts of high amplitude oscillations may occur prior to fully developed combustion instabilities (Gotoda et al. Reference Gotoda, Nikimoto, Miyano and Tachibana2011; Nair, Thampi & Sujith Reference Nair, Thampi and Sujith2014; Tony et al. Reference Tony, Gopalakrishnan, Sreelekha and Sujith2015). These phenomena can occur simultaneously over wide-ranging time scales and may also interact with each other. The resulting variations of flame heat release impede the stable, low-emission operation of the combustor. Therefore, the mechanisms and control of these instabilities have been intensively studied during the past decades (Lieuwen & Yang Reference Lieuwen and Yang2005).
Specifically, the bistability frequently encountered in swirl-stabilised combustors has been under scrutiny in recent years (Fritsche, Füri & Boulouchos Reference Fritsche, Füri and Boulouchos2007; Biagioli, Güthe & Schuermans Reference Biagioli, Güthe and Schuermans2008; Hermeth et al. Reference Hermeth, Staffelbach, Gicquel, Anisimov, Cirigliano and Poinsot2014; Guiberti et al. Reference Guiberti, Durox, Scouflaire and Schuller2015; An et al. Reference An, Kwong, Geraedts and Steinberg2016), where the flame alternates in irregular successions between a lifted-off M-shape and an attached conical V-shape. The flame-shape transitions usually take place over tens of milliseconds and could cause steep local temperature fluctuations, leading to undesirable situations such as sudden increase of thermoacoustic pulsations or thermal stress on the combustor chamber. A thorough understanding of this bistable phenomenon is therefore necessary for the improvement of combustor designs.
For this purpose, a bistable case has been established in a well-studied atmospheric swirl-stabilised gas turbine model combustor based on an industrial design (Roux et al. Reference Roux, Lartigue, Poinsot, Meier and Bérat2005; Meier et al. Reference Meier, Weigand, Duan and Giezendanner-Thoben2007; Franzelli et al. Reference Franzelli, Riber, Gicquel and Poinsot2012; Steinberg, Arndt & Meier Reference Steinberg, Arndt and Meier2013). The case has been characterised by high-speed optical diagnostics including simultaneous particle image velocimetry (PIV) and planar laser-induced fluorescence of OH radicals (OH PLIF) (Oberleithner et al. Reference Oberleithner, Stöhr, Im, Arndt and Steinberg2015; Stöhr et al. Reference Stöhr, Oberleithner, Sieber, Yin and Meier2018) as well as simultaneous OH PLIF and surface thermometry employing thermographic phosphors (Yin, Nau & Meier Reference Yin, Nau and Meier2017). The resulting data series have most recently been analysed by Stöhr et al. (Reference Stöhr, Oberleithner, Sieber, Yin and Meier2018) using spectral proper orthogonal decomposition (SPOD) (Sieber, Paschereit & Oberleithner Reference Sieber, Paschereit and Oberleithner2016) and local linear stability analysis (LSA) (Rukes et al. Reference Rukes, Sieber, Paschereit and Oberleithner2017). An array of co-existing instabilities with diverse characteristic frequencies have been unveiled to underpin the flame-shape transitions: a shift mode representing the changes in the mean flow field, a helical processing vortex core (PVC), a thermoacoustic (TA) axial pulsation in the inner recirculation zone (IRZ) of the combustor as well as instabilities linked to TA modulations on PVC. It has been demonstrated that PVC provides an unsteady stagnation point in the IRZ for stabilising of the M-flame. During an M–V transition, the development of TA instability suppresses PVC, leading to the destabilisation of the M-flame and its reattachment to the combustor inlet to form a V-flame. On the other hand, as the flame undergoes a V–M transition, PVC is re-initiated and self-amplified, followed by re-establishment of the stagnation point in the IRZ and flame lift-off. The non-periodic switching between the flame shapes is also accompanied by abrupt changes in the flow field, with transient and intermittent behaviours in normally coherent and periodic instabilities like PVC and TA.
Data-driven modal decomposition methods such as POD (Lumley Reference Lumley, Yaglom and Tatarski1967; Sirovich Reference Sirovich1987) and dynamic mode decomposition (DMD) (Rowley et al. Reference Rowley, Mezić, Bagheri, Schlatter and Henningson2009; Schmid Reference Schmid2010) have been implemented most commonly to extract periodic, coherent structures in turbulent flows (Taira et al. Reference Taira, Brunton, Dawson, Rowley, Colonius, McKeon, Schmidt, Gordeyev, Theofilis and Ukeiley2017). In their most basic forms, however, their applicability to problems such as the bistable flame is hindered due to their inadequacies at identifying and separating intermittent dynamic components, which may possess similar spatial structures but which occur on a multitude of time scales. Spectral POD methods outlined by Sieber et al. (Reference Sieber, Paschereit and Oberleithner2016) and Towne, Schmidt & Colonius (Reference Towne, Schmidt and Colonius2018) provide additional ranking of the energetic modes according to their dynamic relevance but lack built-in mechanisms for separating closely packed frequency components and/or localising discontinuities in the temporal behaviours of the extracted modes. A variant of DMD that extracts time coefficients based on dynamic modes (Alenius Reference Alenius2014; Premchand et al. Reference Premchand, George, Raghunathan, Unni, Sujith and Nair2019) is capable of capturing temporal disruptions in coherent structures with well-defined frequencies but is not suitable for handling the non-periodic dynamics that governs the flame-shape switching.
On the other hand, multiresolution analysis (MRA) based on discrete wavelet transform (DWT) (Mallat Reference Mallat1989) enables the expression of a time series as the sum of distinct components related to its variations on different time scales. Non-periodic and unsteady dynamics often rejected by Fourier analysis is preserved in MRA. Besides direct implementation of MRA on data series acquired in turbulent flows (Ruppert-Felsot, Farge & Petitjeans Reference Ruppert-Felsot, Farge and Petitjeans2009; Indrusiak & Möller Reference Indrusiak and Möller2011; Rinoshika & Omori Reference Rinoshika and Omori2011; Mancinelli et al. Reference Mancinelli, Pagliaroli, Di Marco, Camussi and Castelain2017; Kim et al. Reference Kim, Bassenne, Towery, Hamlington, Poludnenko and Urzay2018), the concept of MRA has also given rise to multiresolution DMD (MRDMD) (Kutz, Fu & Brunton Reference Kutz, Fu and Brunton2016) and multi-scale POD (Mendez, Scelzo & Buchlin Reference Mendez, Scelzo and Buchlin2018; Mendez, Balabane & Buchlin Reference Mendez, Balabane and Buchlin2019) that can potentially overcome the shortcomings of conventional modal analyses when treating complex dynamic systems. To further the understanding of the bistable phenomenon, this work proposes a novel approach to combine POD with wavelet-based MRA for deriving unambiguous modal descriptions of intermittent dynamics from the high-speed experimental data series obtained in the bistable flame. Instead of using DWT that offers limited, scale-dependent spectral resolutions, discrete wavelet packet transform (DWPT) (Coifman et al. Reference Coifman, Meyer, Quake, Wickerhauser, Byrnes, Byrnes, Hargreaves and Berry1994) was favoured for its larger basis of wavelet coefficients that allows a more flexible time–frequency decomposition of the time series. Specifically, a shift-invariant version of DWPT, termed maximum overlap DWPT (MODWPT) (Percival & Guttorp Reference Percival, Guttorp, Foufoula-Georgiou and Kumar1994; Percival & Walden Reference Percival and Walden2000), is generalised into matrix forms to handle multidimensional data series. Care is taken to select the wavelet filter and decomposition levels to achieve a desired balance between temporal and spectral resolutions. When interfaced with the conventional snapshot POD, it is shown that the method devised in this work attains the principle of a multiresolution POD (MRPOD). The enhanced capability of MRPOD in the analysis of complex unsteady turbulent flows is then demonstrated by newly gained insights into the bistable phenomenon.
The paper is organised as follows: in § 2, an overview is first given on the fundamentals of MODWPT of time series. A set of selection criteria are then provided for wavelet filters and decomposition levels. A generalised formulation is subsequently derived to achieve efficient computation and to facilitate interfacing with snapshot POD. In § 3, MRPOD is applied to measured data series of the flow field in the bistable flame to extract modal descriptions of the data series within specific bandpasses in the spectral domain. In § 4, MRPOD modes are characterised and compared with POD modes for different frequency components. New findings regarding the bistable flow field are discussed in detail. In § 5, the results from this work are summarised with an outlook on potential improvements and applications of the method of MRPOD presented in this work.
2 MODWPT-based modal analysis of time series
The proposed approach seeks to facilitate a generalised implementation of wavelet packet transform (WPT) for handling time series of diverse dimensions. Since there exists a large variety of wavelet transforms and wavelet filters that can be used to perform a WPT, the choices are made based on the following criteria:
(i) dynamics at various frequencies can be identified and adequately isolated, and
(ii) abrupt changes in their temporal behaviours must be properly resolved and align perfectly with the original data series such that they can be correctly correlated in time.
Before delving into the generalisation of the WPT method, this section begins with a brief introduction of DWPT and the rationale for choosing its shift-invariant version, namely the MODWPT.
2.1 Shift-invariant DWPT
Generally speaking, DWPT carries out a time–frequency decomposition of a time series by projecting it onto an orthonormal basis of wavelet filters, which is constructed by dilation and translation of a single wavelet function. Each of the resulting wavelet coefficients can be localised to a particular frequency/time interval. The time series can then be reconstructed based on the wavelet coefficients to allow for the analysis of its various frequency components separately. Since DWPT essentially expands upon a standard DWT by decomposing not only the scaling coefficients but also the wavelet coefficients at each decomposition level, its wavelet coefficients afford a higher flexibility and selectivity during reconstructions of the time series when compared to a DWT-based MRA (that can be viewed as a subset of DWPT-based reconstruction, see § A.1).
Unlike DWPT, shift-invariant WPT such as MODWPT (similar variants include undecimated (Shensa Reference Shensa1992) and stationary (Nason & Silverman Reference Nason and Silverman1995) DWPTs) is well defined for arbitrary sample sizes and is insensitive to the choice of the starting point in the time series. Moreover, MODWPT can offer higher spectral isolation during the reconstruction process, which becomes especially beneficial for handling time series laden with highly intermittent dynamic components that are densely packed in the spectral domain, as is the case in this work. Although MODWPT achieves these advantages at the expense of orthonormality, it still retains the ability to form an exact analysis of variance and a perfect reconstruction of the time series. Details are presented below.
2.2 Decomposition and reconstruction of time series
The classical pyramid algorithm for MODWPT is illustrated in § A.1 and is detailed in Percival & Walden (Reference Percival and Walden2000). This work opts for a composite filter approach that simplifies the matrix formulation given later in § 2.4 and offers a higher computational efficiency. For MODWPT of a time series
 $\boldsymbol{x}=[x_{1},x_{2},\ldots ,x_{N}]^{\text{T}}\in \mathbb{R}^{N}$
, at each decomposition level
 $j\geqslant 1$
, the frequency domain is divided equally into
 $2^{j}$
scales, with each scale
 $n$
corresponding to a frequency bandpass of
 $$\begin{eqnarray}{\mathcal{I}}_{j,n}\equiv \left[\frac{n}{2^{j+1}},\frac{n+1}{2^{j+1}}\right]\frac{1}{\unicode[STIX]{x0394}t},\quad n=0,1,\ldots ,2^{j}-1,\end{eqnarray}$$
where
 $\unicode[STIX]{x0394}t$
is the time step between two sampling points. The decomposition of
 $\boldsymbol{x}$
using MODWPT at a specific scale
 $n$
of
 $j$
can be expressed as:
 $$\begin{eqnarray}\boldsymbol{w}_{j,n}=\unicode[STIX]{x1D650}_{j,n}\boldsymbol{x}.\end{eqnarray}$$
The transform matrix
 $\unicode[STIX]{x1D650}_{j,n}\in \mathbb{R}^{N\times N}$
is formed by time shifting row vectors of the composite wavelet filter
 $\boldsymbol{u}_{j,n}$
constructed via filter cascade and periodised to the length of
 $N$
(only real wavelet filters are considered in this work. See § A.2 for details). Since the resulting wavelet coefficients
 $\boldsymbol{w}_{j,n}\in \mathbb{R}^{N}$
preserve the energy of
 $\boldsymbol{x}$
at
 $j$
as
 $$\begin{eqnarray}\mathop{\sum }_{t=1}^{N}x_{t}^{2}=\mathop{\sum }_{n=0}^{2^{j}-1}\mathop{\sum }_{t=1}^{N}w_{j,n,t}^{2}\end{eqnarray}$$
a spectrogram
 $\unicode[STIX]{x1D64E}_{j}\in \mathbb{R}^{2^{j}\times N}$
representing the variations of
 $\boldsymbol{x}$
at each scale
 $n$
over time can be written as
 $$\begin{eqnarray}\unicode[STIX]{x1D64E}_{j}=\left[\begin{array}{@{}c@{}}\boldsymbol{w}_{j,0}^{2}\\ \displaystyle \boldsymbol{w}_{j,1}^{2}\\ \displaystyle \vdots \\ \displaystyle \boldsymbol{w}_{j,2^{j}-1}^{2}\\ \end{array}\right].\end{eqnarray}$$
By averaging the rows of
 $\unicode[STIX]{x1D64E}_{j}$
, an empirical power spectrum of
 $\boldsymbol{x}$
at a given
 $j$
on a scale-by-scale basis can be derived as
 $$\begin{eqnarray}{\mathcal{P}}_{\boldsymbol{x}}^{(j)}(n)=\overline{\langle \unicode[STIX]{x1D64E}_{j}\rangle }_{N}=\frac{1}{N}\mathop{\sum }_{t=1}^{N}w_{j,n,t}^{2},\quad n=0,1,\ldots ,2^{j}-1,\end{eqnarray}$$
where the angle bracket and the overline represent integration along the dimension indicated in its subscript and averaging, respectively.
After the decomposition stage,
 $\boldsymbol{x}$
can be reconstructed at a specific scale
 $n$
of
 $j$
by using
 $$\begin{eqnarray}\boldsymbol{d}_{j,n}=\unicode[STIX]{x1D650}_{j,n}^{\text{T}}\boldsymbol{w}_{j,n}=\unicode[STIX]{x1D650}_{j,n}^{\text{T}}\unicode[STIX]{x1D650}_{j,n}\boldsymbol{x},\end{eqnarray}$$
where the wavelet detail
 $\boldsymbol{d}_{j,n}\in \mathbb{R}^{N}$
represents essentially the temporal behaviour of
 $\boldsymbol{x}$
within the bandpass defined by
 ${\mathcal{I}}_{j,n}$
. At any decomposition level
 $j$
,
 $\boldsymbol{x}$
can be perfectly reconstructed by summing up all the
 $2^{j}$
frequency components (wavelet details),
 $$\begin{eqnarray}\boldsymbol{x}=\mathop{\sum }_{n=0}^{2^{j}-1}\boldsymbol{d}_{j,n}.\end{eqnarray}$$
The decomposition and reconstruction stages of MODWPT-based analysis with LA(8) at
 $j=2$
: (a) the squared gains of the composite filters; (b) the resulting wavelet coefficients; (c) the wavelet details.

The decomposition and reconstruction stages of MODWPT-based analysis are demonstrated in figure 1, using a time series
 $\boldsymbol{x}$
generated ad hoc by combing two time-varying sinusoidal waves with respective characteristic frequencies of 0.075
 $f_{s}$
and 0.185
 $f_{s}$
(
 $f_{s}=1/\unicode[STIX]{x0394}t$
). A Daubechies least asymmetric wavelet (Daubechies Reference Daubechies1992) with 4 elements (referred to as LA(4)) and a decomposition level
 $j=2$
are used for MODWPT. The squared gain functions
 ${\mathcal{G}}_{\boldsymbol{u}}$
(see § A.3) of the composite filters
 $\boldsymbol{u}_{j,n}$
at each of the four scales are plotted in column (a) of figure 1. Their corresponding ideal frequency bands
 ${\mathcal{I}}_{j,n}$
are shown as shaded rectangles in the background for comparison. The centre frequencies of the two sinusoidal waves are marked by dashed lines to indicate at which scales
 $n$
they are expected to appear after MODWPT. It is clear that at
 $j=2$
the composite filters are far from ideal bandpass filters. As a consequence, the two frequency components of
 $\boldsymbol{x}$
are not sufficiently isolated and instead ‘leak’ into other scales, as shown in the wavelet coefficients
 $\boldsymbol{w}_{j,n}$
in column (b). This ‘leakage’ is to a large extent suppressed during the reconstruction process, as can be observed in the wavelet details
 $\boldsymbol{d}_{j,n}$
in column (c). This is due to the fact that the composite filter for the wavelet detail has an effective squared gain of
 ${\mathcal{G}}_{\boldsymbol{d}}={\mathcal{G}}_{\boldsymbol{u}}^{2}$
(see § A.3), hence a much better approximation of a bandpass filter. Moreover, since
 ${\mathcal{G}}_{\boldsymbol{d}}$
is real and positive, it corresponds to a zero-phase filter and guarantees an exact temporal alignment between wavelet details and the time series. This is not the case with DWPT, whose details are derived by up-sampling of the wavelet coefficients and have poorer bandpass approximation and temporal alignment (see appendix C for details).
In general, the choices of wavelet filter and the decomposition level determine the quality of the reconstructions and must be carefully assessed on a case-by-case basis, as discussed in detail below.
2.3 Selection criteria for wavelet filter,
 $j$
and
$n$


It is often the case that various frequency components of a time series may find themselves in close vicinity of each other and may occupy multiple frequency bands defined by the scales
 $n$
of a specific decomposition level
 $j$
. It is then necessary to further divvy up the frequency domain by increasing
 $j$
(and number of
 $n$
as a result). However, due to the reciprocity relation between the temporal resolution (
 $\unicode[STIX]{x0394}\unicode[STIX]{x1D70F}$
) and spectral resolution (
 $\unicode[STIX]{x0394}\unicode[STIX]{x1D707}$
) of wavelet transform,
 $$\begin{eqnarray}\unicode[STIX]{x0394}\unicode[STIX]{x1D70F}\unicode[STIX]{x0394}\unicode[STIX]{x1D707}={\textstyle \frac{1}{2}},\end{eqnarray}$$
the wavelet details obtained from these finer scales may need to be ‘bundled’ together to properly capture the waxes and wanes of intermittent dynamics. A detail bundle from a decomposition level
 $j$
is introduced in this work as
 $$\begin{eqnarray}\boldsymbol{b}_{j,n_{0}}^{(k)}=\mathop{\sum }_{n=n_{0}}^{n_{k-1}}\boldsymbol{d}_{j,n},\end{eqnarray}$$
where
 $n_{0}$
is the first scale in the total number of
 $k$
scales included in the summation. Notice that a full bandwidth or perfect reconstruction of the time series is achieved by setting
 $n_{0}$
to 0 and
 $n_{k}$
to
 $2^{j}-1$
, the equivalent of (2.7).
The size of the wavelet filter influences the squared gain function in a similar manner as dictated by (2.8): the larger it is the better its approximation of a bandpass filter. This comes with the caveat that the computational burden of MODWPT scales with the filter size and the resulting details may become more sensitive to boundary conditions of the time series (see § A.5). As pointed out by Mouri et al. (Reference Mouri, Kubotani, Fujitani, Niino and Takaoka1999), turbulent statistics are largely independent of the choice of the wavelets. The specific type of wavelet filter plays a lesser role for MODWPT, especially when a large filter is used, as shown in § A.4. Among the most commonly used wavelet filters, this work has chosen the Daubechies wavelets as they have been widely adopted in turbulent flow applications (Indrusiak & Möller Reference Indrusiak and Möller2011; Rinoshika & Omori Reference Rinoshika and Omori2011; Mancinelli et al. Reference Mancinelli, Pagliaroli, Di Marco, Camussi and Castelain2017). Detailed performance comparisons of different wavelets are included in § A.4.
Effects of wavelet size and reconstruction scales on the detail bundles: (a) the squared gain function corresponding to the three bundles compared to the normalised PSD of the synthesised time series
 $\boldsymbol{y}$
; (b–d) comparisons between reconstructed and the original time series.

Figure 2 demonstrates the effects of wavelet size and reconstruction scales on the detail bundles using another synthesised time series
 $\boldsymbol{y}$
(black lines), whose normalised power spectral density (PSD) is plotted in figure 2(a). A decomposition level of
 $j=8$
is used to divide the frequency domain into 256 bands to allow for a sufficient amount of flexibility in constructing detail bundles to contain the frequency features within their bandpasses. Three detail bundles are compared here: (i)
 $\boldsymbol{b}_{8,21}^{(6)}$
with LA(8) (blue lines), (ii)
 $\boldsymbol{b}_{8,23}^{(2)}$
with LA(32) (green lines) and (iii)
 $\boldsymbol{b}_{8,21}^{(6)}$
with LA(32) (red lines). Their corresponding squared gain functions
 ${\mathcal{G}}_{\boldsymbol{b}}$
are plotted in figure 2(a). As can be seen, the short wavelet filter of bundle (i) provides insufficient gain around the target frequency with undesirable gains in other bands, causing bundle (i) to notably miss the amplitude of
 $\boldsymbol{y}$
as shown in figure 2(b). With a much longer wavelet filter, bundle (ii) is able to spectrally isolate
 $\boldsymbol{y}$
but fails at resolving its fast decay due to the narrow total bandpass, as illustrated in figure 2(c). On the other hand, with a combination of a long wavelet filter and an adequate bandwidth, bundle (iii) can well reproduce the magnitude as well as the temporal behaviour of
 $\boldsymbol{y}$
as evident in figure 2(d). It should be noted that, at higher decomposition levels, the gains of the individual scales tend to deviate significantly from ideal bandpasses and become highly irregular. It is therefore important to examine the gain shapes when designing detail bundles, as discussed in detail in § A.3.
To summarise, the choices of decomposition level, wavelet filter and reconstruction scales depend primarily on (i) the spectral resolution necessary for separating the target frequency components and (ii) the temporal resolution needed for resolving the intermittencies. In addition, the best basis algorithm (Coifman & Wickerhauser Reference Coifman and Wickerhauser1992) designed for DWPT can be used as an initial guidance for choosing the decomposition level
 $j$
.
2.4 Generalisation to multidimensional data arrays
The approach outlined in § 2.2 is generalised to handle data arrays with a dimension of
 $N\times M_{\unicode[STIX]{x1D702}}\times M_{\unicode[STIX]{x1D709}}\times \cdots \times M_{\unicode[STIX]{x1D701}}$
, with
 $N$
being the sample size in time. Let
 $\boldsymbol{x}_{i}$
represent the time series obtained at an index
 $i$
that spans all components
 $\unicode[STIX]{x1D702},\unicode[STIX]{x1D709},\ldots ,\unicode[STIX]{x1D701}$
(other than time) of the data array. The data series can be arranged into a matrix
 $\unicode[STIX]{x1D653}\in \mathbb{R}^{N\times M}$
as
 $$\begin{eqnarray}\unicode[STIX]{x1D653}=[\boldsymbol{x}_{1},\boldsymbol{x}_{2},\ldots ,\boldsymbol{x}_{M}],\quad \boldsymbol{x}_{i}\in \mathbb{R}^{N},\end{eqnarray}$$
where
 $M=M_{\unicode[STIX]{x1D702}}\times M_{\unicode[STIX]{x1D709}}\times \cdots \times M_{\unicode[STIX]{x1D701}}$
. This is equivalent to reshaping the multidimensional data array by collapsing all non-time dimensions into row vectors and stacking them along the time axis. The MODWPT of
 $\unicode[STIX]{x1D653}$
at a scale
 $n$
of a decomposition level
 $j$
can be expressed as
 $$\begin{eqnarray}\unicode[STIX]{x1D652}_{j,n}=\unicode[STIX]{x1D650}_{j,n}\unicode[STIX]{x1D653},\end{eqnarray}$$
where
 $\unicode[STIX]{x1D652}_{j,n}\in \mathbb{R}^{N\times M}$
contains the wavelet coefficients
 $\boldsymbol{w}_{j,n}$
defined by (2.2) at all the indices
 $i$
. Similarly the wavelet details matrix
 $\unicode[STIX]{x1D63F}_{j,n}\in \mathbb{R}^{N\times M}$
can be obtained based on (2.6)
 $$\begin{eqnarray}\unicode[STIX]{x1D63F}_{j,n}=\unicode[STIX]{x1D650}_{j,n}^{\text{T}}\unicode[STIX]{x1D650}_{j,n}\unicode[STIX]{x1D653}.\end{eqnarray}$$
Finally, the detail bundles
 $\unicode[STIX]{x1D63D}_{j,n_{0}}^{(k)}\in \mathbb{R}^{N\times M}$
can be formulated as
 $$\begin{eqnarray}\unicode[STIX]{x1D63D}_{j,n_{0}}^{(k)}=\unicode[STIX]{x1D739}_{n_{0}}^{(k)}\left[\begin{array}{@{}c@{}}\unicode[STIX]{x1D63F}_{j,0}\\ \displaystyle \unicode[STIX]{x1D63F}_{j,1}\\ \displaystyle \vdots \\ \displaystyle \unicode[STIX]{x1D63F}_{j,2^{j}-1}\end{array}\right]=\unicode[STIX]{x1D739}_{n_{0}}^{(k)}\left[\begin{array}{@{}c@{}}\unicode[STIX]{x1D650}_{j,0}^{\text{T}}\unicode[STIX]{x1D650}_{j,0}\\ \displaystyle \unicode[STIX]{x1D650}_{j,1}^{\text{T}}\unicode[STIX]{x1D650}_{j,1}\\ \displaystyle \vdots \\ \displaystyle \unicode[STIX]{x1D650}_{j,2^{j}-1}^{\text{T}}\unicode[STIX]{x1D650}_{j,2^{j}-1}\end{array}\right]\unicode[STIX]{x1D653}=\unicode[STIX]{x1D739}_{n_{0}}^{(k)}\unicode[STIX]{x1D64F}_{j}\unicode[STIX]{x1D653},\end{eqnarray}$$
with the elements
 $\unicode[STIX]{x1D6FF}_{n}$
of the row vector
 $\unicode[STIX]{x1D739}_{n_{0}}^{(k)}\in \mathbb{R}^{2^{j}}$
controlling the bandpass of the detail bundle and which is defined as
 $$\begin{eqnarray}\unicode[STIX]{x1D6FF}_{n}=\left\{\begin{array}{@{}ll@{}}1, & n=n_{0},n_{1},\ldots ,n_{k-1},\\ 0, & \text{otherwise}.\end{array}\right.\end{eqnarray}$$
Also recognise that the transform operator
 $\unicode[STIX]{x1D64F}_{j}\in \mathbb{R}^{2^{j}\times N\times N}$
is independent of the contents of
 $\unicode[STIX]{x1D653}$
and can be constructed a priori based on a chosen wavelet function, decomposition level
 $j$
and the time dimension of the data series
 $N$
. Following (2.7),
 $\unicode[STIX]{x1D653}$
can then be perfectly recovered by setting all
 $\unicode[STIX]{x1D6FF}_{n}$
to 1. In addition, each wavelet detail can be viewed as a detail bundle with
 $k=1$
. When compared with the classical DWT-based MRA, WPT such as MODWPT offers a much larger basis of wavelet coefficients for reconstructing the time series within refined and variable bandpasses. The approximation (or ‘smooth’) and details of a DWT-based MRA can also be readily computed based on (2.7), by assigning an appropriate
 $\unicode[STIX]{x1D6FF}_{n}$
to 1 (or 0) to achieve varying time resolutions (scales).
Notice that the definition of the detail bundles given in (2.13) does not require the
 $k$
number of scales
 $n$
to be in sequence. This allows for grouping together of the discontinuous frequency bands during reconstruction for selective filtering of the time series. In practical implementation, (2.13) constitutes only a partial WPT (arbitrary disjoint dyadic decomposition) and can be efficiently computed by invoking fewer equivalent parent scales from lower
 $j$
levels to construct detail bundles at the target level, as further explained in § A.6.
2.5 Multiresolution POD
With their well-defined spectral bandpasses, the detail bundles can be used as foundations for modal analyses to provide modal representations of the isolated dynamics of interest. This section formulates a multiresolution POD (MRPOD) that interfaces the wavelet detail bundles with conventional snapshot POD. Note that the indices
 $j$
and
 $n$
in the notation of the detail bundles are omitted in this section for readability.
Following the classical definition of snapshot POD (assuming
 $N<M$
), the eigenvectors
 $\unicode[STIX]{x1D733}=[\unicode[STIX]{x1D74D}_{1},\unicode[STIX]{x1D74D}_{2},\ldots ,\unicode[STIX]{x1D74D}_{N}]\in \mathbb{R}^{N\times N}$
and eigenvalues
 $\unicode[STIX]{x1D726}=\text{diag}(\unicode[STIX]{x1D706}_{1},\unicode[STIX]{x1D706}_{2},\ldots ,\unicode[STIX]{x1D706}_{N})\in \mathbb{R}^{N\times N}$
of the detail bundles
 $\unicode[STIX]{x1D63D}$
can be obtained by solving
 $$\begin{eqnarray}\unicode[STIX]{x1D63D}\unicode[STIX]{x1D63D}^{\text{T}}\unicode[STIX]{x1D733}=\unicode[STIX]{x1D733}\unicode[STIX]{x1D726}.\end{eqnarray}$$
The spatial mode
 $\unicode[STIX]{x1D753}_{l}\in \mathbb{R}^{M}$
can be written as
 $$\begin{eqnarray}\unicode[STIX]{x1D753}_{l}=\frac{1}{\unicode[STIX]{x1D706}_{l}}\boldsymbol{a}_{l}\unicode[STIX]{x1D63D},\quad l=1,2,\ldots ,N\end{eqnarray}$$
where its temporal coefficient
 $\boldsymbol{a}_{l}\in \mathbb{R}^{N}$
is
 $$\begin{eqnarray}\boldsymbol{a}_{l}=\sqrt{\unicode[STIX]{x1D706}_{l}}\unicode[STIX]{x1D74D}_{l},\quad l=1,2,\ldots ,N.\end{eqnarray}$$
Alternatively, POD can also be applied directly to specific frequency components of
 $\unicode[STIX]{x1D653}$
without explicitly constructing the detail bundles. This is made obvious by expanding the cross-correlation matrix
 $\unicode[STIX]{x1D646}_{\unicode[STIX]{x1D63D}}$
of
 $\unicode[STIX]{x1D63D}$
using (2.13) as
 $$\begin{eqnarray}\unicode[STIX]{x1D646}_{\unicode[STIX]{x1D63D}}=\unicode[STIX]{x1D63D}\unicode[STIX]{x1D63D}^{\text{T}}=\unicode[STIX]{x1D739}\unicode[STIX]{x1D64F}\unicode[STIX]{x1D653}\unicode[STIX]{x1D653}^{\text{T}}\unicode[STIX]{x1D64F}^{\text{T}}\unicode[STIX]{x1D739}^{\text{T}}=\unicode[STIX]{x1D739}\unicode[STIX]{x1D64F}\unicode[STIX]{x1D646}_{\unicode[STIX]{x1D653}}\unicode[STIX]{x1D64F}^{\text{T}}\unicode[STIX]{x1D739}^{\text{T}}.\end{eqnarray}$$
This shows that the POD of a specific detail bundle
 $\unicode[STIX]{x1D63D}$
constructed based on filtering
 $\unicode[STIX]{x1D653}$
with
 $\unicode[STIX]{x1D739}\unicode[STIX]{x1D64F}$
is equivalent to iteratively filtering the rows and columns of the cross-correlation matrix
 $\unicode[STIX]{x1D646}_{\unicode[STIX]{x1D653}}$
of
 $\unicode[STIX]{x1D653}$
with
 $\unicode[STIX]{x1D739}\unicode[STIX]{x1D64F}$
(i.e. the two-dimensional discrete wavelet transform (2-D DWT) of
 $\unicode[STIX]{x1D646}_{\unicode[STIX]{x1D653}}$
), which naturally preserves the symmetry of the Hermitian matrix. This is analogous to the method proposed by Mendez et al. (Reference Mendez, Scelzo and Buchlin2018), where the filtering of
 $\unicode[STIX]{x1D646}_{\unicode[STIX]{x1D653}}$
is achieved via 2-D DWT. Therefore, the notions of MRPOD and POD of detail bundles are used interchangeably in the following discussions.
The core concept of MRPOD is that, by simply altering the elements of the selection vector
 $\unicode[STIX]{x1D739}$
, POD can be performed either on the original data series or on a subset of the data series reconstructed within adjustable bandpasses that can even be discontinuous in the spectral domain. This can overcome one of the major drawbacks of POD: the inability to distinguish dynamics occurring at different time scales. It should be pointed out that the formulation of MRPOD in (2.15) does not necessarily require the implementation of MODWPT. If the focus is placed rather on creating an orthogonal basis containing POD modes ranked by both kinetic energy and dynamic importance, the detail bundles can be constructed based on an orthonormal wavelet transform such as DWPT instead, as demonstrated in appendix C. If flexible frequency division and a highly controllable filter performance are needed, a generalised MRA using custom-designed bandpass filters can be adopted to conduct MRPOD (Mendez et al.
Reference Mendez, Balabane and Buchlin2019), as discussed in appendix D.
The full workflow for MRPOD is summarised in the following step-by-step algorithm:

Owing to the efficient matrix-based operations, the MODWPT-based MRPOD is computationally efficient for even large data volumes, as discussed in detail in §§ 3.4 and A.6.
3 MRPOD of the bistable reacting flow
As the primary motivation of this work, the flow field measured from the aforementioned bistable turbulent swirl flame is analysed using the MRPOD approach described in § 2. After an overview of the experiments, data series obtained from high-speed PIV is decomposed and reconstructed within different spectral bandpasses. The resulting detail bundles are then compared with each other based on their spatial and temporal POD modes.
3.1 Experimental set-up
Overview of the experimental set-up and results: (a) schematic of the swirl-stabilised combustor and the field of views of the optical diagnostics; (b) snapshots of flow fields (vectors) and OH distributions (filled contour) representative of the M- and V-flames from Dataset no. 1; (c) time series of normalised spatially integrated OH signal from Dataset no. 1.

The experimental data analysed in this section were acquired by Stöhr et al. (Reference Stöhr, Oberleithner, Sieber, Yin and Meier2018) from the widely researched PRECCINSTA combustor (Roux et al.
Reference Roux, Lartigue, Poinsot, Meier and Bérat2005; Meier et al.
Reference Meier, Weigand, Duan and Giezendanner-Thoben2007; Franzelli et al.
Reference Franzelli, Riber, Gicquel and Poinsot2012; Steinberg et al.
Reference Steinberg, Arndt and Meier2013) operated at atmospheric pressure, with premixed methane (
 $\text{CH}_{4}$
) and air at an equivalence ratio of 0.7, and thermal power of 20 kW. As shown schematically in figure 3(a), the combustor is composed of a cylindrical plenum with a diameter of 78 mm, a 12-vane swirl generator and a converging nozzle (
 $D=27.85~\text{mm}$
) with a central conical bluff body. In addition, the combustor acoustics is decoupled from that of the gas delivery system by a sonic nozzle installed upstream of the plenum. The gas mixture is discharged into a combustion chamber (
 $85\times 85\times 114~\text{mm}^{3}$
with optical access through side walls made of quartz glass) at an average exit velocity (non-reacting) of
 $14.4~\text{m}~\text{s}^{-1}$
(
 $Re_{D}\sim 28\,000$
) and a swirl number of 0.6 (measured 1.5 mm above the exit) (Meier et al.
Reference Meier, Weigand, Duan and Giezendanner-Thoben2007), resulting in a large inner recirculation zone (IRZ) as well as an outer recirculation zone (ORZ). Gas mixture is eventually directed into an exhaust duct via a conical converging section.
Series of three-component vector fields were measured in the reacting flow using stereo-PIV at 10 kHz repetition rate. Concurrently, flame shape was monitored by OH planar laser-induced fluorescence (OH PLIF). For the diagnostics, the double-pulse output at 532 nm (2.6 mJ pulse
 $^{-1}$
) from an Nd:YAG laser (Edgewave) and the UV output at 283.2 nm (
 $80~\unicode[STIX]{x03BC}\text{J}~\text{pulse}^{-1}$
) from an Nd:YAG pumped dye laser (Edgewave and Sirah Credo) were overlapped spatially, expanded into vertical sheets and aligned across the geometric centre of the combustion chamber. For PIV, a pair of CMOS cameras (LaVision HSS8) equipped with 100 mm,
 $f/2.8$
Tokina lenses and notch filters (
 $532\pm 1~\text{nm}$
) was used to image Mie scattering at 532 nm from
 $\text{TiO}_{2}$
particles seeded in the air flow with double exposure. The recorded particle images were processed using a cross-correlation algorithm (LaVision 8.2) with a final interrogation window of
 $16\times 16$
with 50 % overlap (
 $1.3\times 1.3~\text{mm}^{2}$
spatial resolution), resulting in a total of
 $44\times 86$
(vertically and horizontally, respectively) vector points per snapshot. For PLIF, OH fluorescence following the excitation of the
 $\text{Q}_{1}(7)$
transition in the OH A-X
 $(1,0)$
band was collected using an intensified CMOS camera (LaVision HSS5
 $+$
HS-IRO) coupled with a 45 mm,
 $f/1.8$
UV lens (Cerco) and a bandpass filter (300–325 nm). In addition, approximately 4 % of the UV laser sheet was redirected into a dye cuvette to allow for recording of shot-to-shot variations in laser sheet profiles by a separate high-speed intensified camera system, which was then used to correct the captured OH images. The measurement fields of view for PIV and OH PLIF are outlined by dashed rectangles in figure 3(a), with their heights limited by the available pulse energies from the laser systems. A total of 8000 frames were captured in each recording (limited by the available on-camera storage) of both systems.
3.2 Overview of experimental results
The connections between flame shapes and combustion stabilities as well as the mechanisms governing these transitions have been studied extensively in premixed swirl-stabilised combustors (Shanbhogue et al.
Reference Shanbhogue, Sanusi, Taamallah, Habib, Mokheimer and Ghoniem2016; Taamallah, Shanbhogue & Ghoniem Reference Taamallah, Shanbhogue and Ghoniem2016). A series of experimental surveys was conducted in the PRECCINSTA combustor by Oberleithner et al. (Reference Oberleithner, Stöhr, Im, Arndt and Steinberg2015) to analyse the stabilisation mechanisms of swirl flame. It was observed that, at a given thermal power, the flame could be stabilised in a lifted-off M-shape at leaner conditions with the presence of PVC and in an attached V-shape where PVC was suppressed when the equivalence ratio was increased. At certain intermediate equivalence ratios, bistable cases emerged where the flame alternates non-periodically between a lifted-off M-shape and an attached V-Shape, such as at the operating condition used in this work (described in § 3.1). Figure 3(b) shows the overlaid instantaneous flow field and OH distributions selected from Dataset no. 1 (a recording of 8000 frames or equivalently 0.8 s) to represent a typical M- and V-flame, respectively. The signature ‘zig-zag’ vortex pattern of PVC is also visible in the flow field of the M-flame, but is absent during V-flame. The OH signal within a 10 mm by 4 mm region as outlined in the V-flame in figure 3(b) above the bluff body is integrated to track the flame shapes. The resulting, normalised time series of
 $\langle I_{OH}\rangle$
(angle bracket denotes spatial integration) is plotted in figure 3(c). Time zero is set at the first frame of the recording, and the periods of the M- and V-flames are qualitatively labelled in figure 3(c). The respective time stamps of the two snapshots shown in figure 3(b) are marked as
 $t_{1}$
and
 $t_{2}$
. As can be seen, the time series starts and ends with a V-flame and experiences two V–M and M–V transitions with a total of approximately 0.4 s residing in either bistable state. The flame detachment and reattachment processes during V–M and M–V transitions (each occurs and completes within about 0.05 s) are captured in detail by overlaid distributions of OH PLIF and velocity vectors in the supplementary movies 1 and 2 are available online at https://doi.org/10.1017/jfm.2019.762. In addition to Dataset no. 1, three other datasets with the same sample volume but which are composed of various constellations of M- and V-flame periods are analysed in the following sections.
Using SPOD and local LSA, Stöhr et al. (Reference Stöhr, Oberleithner, Sieber, Yin and Meier2018) furthered the study of Oberleithner et al. (Reference Oberleithner, Stöhr, Im, Arndt and Steinberg2015) by looking at the complex interplays between TA and hydrodynamic instabilities during flame-shape transitions. It was shown that while V–M transition was preluded by a slow drift in the velocity and density fields that led to an increase in the growth rate of PVC, M–V transition was governed by TA oscillations that caused repetitive M-flame reattachments to the inlet, resulting in the suppression of PVC and eventual stabilisation of a V-flame. It was also found that TA did not influence PVC by modifying the mean flow field and hence the PVC growth rate (Manoharan et al.
Reference Manoharan, Hansford, O’Connor and Hemchandra2015; Oberleithner et al.
Reference Oberleithner, Stöhr, Im, Arndt and Steinberg2015), it rather interacted with PVC via a nonlinear mean flow modulation (Terhaar et al.
Reference Terhaar, Ćosić, Paschereit and Oberleithner2016), where the pressure fluctuations induced by TA modulate the inlet flow rate and thus PVC. Evidence of such a TA modulation was found in two instabilities that resided in the spectral domain at the sum and difference of the frequencies of PVC and TA, termed PVC
 $+$
TA and PVC-TA.
Following the previous studies, this work employs the MODWPT-based MRPOD to time–frequency localise all relevant intermittent dynamics in the flow field of the bistable flame, with a focus on (i) providing unambiguous modal descriptions of known/unknown frequency components and (ii) seeking prevailing trends shared among different datasets consisted of varying durations of V- and M-flames.
3.3 Inspection of the flow field
In order to determine all the relevant intermittent dynamics, an inspection of the (i) temporal and (ii) spatial behaviours of various frequency components in the bistable flow field was carried out by constructing spectrograms, i.e. Step 4 of the MRPOD Algorithm given at the end of § 2.5. Specifically, each of the time series of measured flow field as exemplified in figure 3 (subtracted by its series mean) was first organised into an
 $N\times M$
matrix of
 $\unicode[STIX]{x1D651}^{\prime }=[\boldsymbol{v}_{1}^{\prime },\boldsymbol{v}_{2}^{\prime },\ldots ,\boldsymbol{v}_{M}^{\prime }]$
, with an
 $N$
of 8000 (snapshots) and
 $M$
of 11 352 (
 $=3\times 44\times 86$
, i.e. total number of measured velocity components per snapshot). Based on a preliminary examination of vector series extracted from different regions in the flow field following consideration of the spectral and temporal resolutions outlined in § 2.3, a decomposition level of
 $j=8$
(i.e. 256 scales
 $n$
) and the LA(32) filter were chosen to perform the MODWPT of
 $\unicode[STIX]{x1D651}^{\prime }$
using (2.11) and then to construct the spectrograms using (2.4). Note that the spectrogram
 $\unicode[STIX]{x1D64E}$
of each dataset has a dimension of
 $2^{j}\times N\times M$
(the index
 $j$
is omitted in the notations of the forthcoming discussion as it is kept the same). Results from all four datasets including Dataset no. 1 shown in figure 3 are presented in figure 4.
Inspection of the flow field for all the datasets: (a) the detail bundle
 $\boldsymbol{b}_{8,0}^{(6)}$
of OH signal for reference of flame shape; (b) spectrogram averaged over all
 $M$
components; and (c) power spectrum of
 $\unicode[STIX]{x1D651}^{\prime }$
averaged over all
 $M$
components.

For each dataset, figure 4(b–c) shows the spectrogram
 $\overline{\langle \unicode[STIX]{x1D64E}\rangle }_{M}$
(i.e.
 $\unicode[STIX]{x1D64E}\in \mathbb{R}^{2^{j}\times N\times M}$
averaged over all
 $M$
components) on a log colour scale (same for all datasets) and the empirical power spectrum
 $\overline{\langle {\mathcal{P}}_{\unicode[STIX]{x1D651}^{\prime }}\rangle }_{M}$
of
 $\unicode[STIX]{x1D651}^{\prime }$
averaged over all
 $M$
components, generated using (2.4), (2.5) and the wavelet coefficient matrices
 $\unicode[STIX]{x1D652}_{n}$
. The frequency axis in both plots corresponds to the centre frequency
 $f_{c}$
of each scale
 $n$
. Note that for LA(32) and at
 $j=8$
, the phase shift in wavelet coefficients are not negligible and need to be compensated for such that the coefficients are aligned to the original data series in time (Percival & Walden Reference Percival and Walden2000). While the spectrogram provides an overview of the temporal behaviours of various frequency components, the power spectrum compares their absolute amplitudes. Additionally, a detail bundle
 $\langle I_{OH}\rangle ^{\boldsymbol{b}_{0}}$
of
 $\langle I_{OH}\rangle$
with a bandpass of
 $[0,117.1875]$
Hz (
 $\boldsymbol{b}_{0}$
is short for
 $\boldsymbol{b}_{8,0}^{(6)}$
) was derived using (2.9) to track only the states of the flames as well as the transitions between them, both of which occur on a fairly large time scale. Here
 $\langle I_{OH}\rangle ^{\boldsymbol{b}_{0}}$
is shown together with
 $\langle I_{OH}\rangle$
in figure 3(c) for Dataset no. 1 as an example and is plotted in figure 4(a) for reference of the bistable states.
As can be seen in all four cases, the flow field consists of a large variety of dynamic components occuring over a wide spectral range, some of which are highly intermittent. When compared to
 $\langle I_{OH}\rangle ^{\boldsymbol{b}_{0}}$
, it is clear that these frequency components do not always overlap in time: while the prominent peak at
 $n=24$
, corresponding to PVC, appears to exist only during the M-flame, while others are more discernible during the V-flame (e.g. at
 $n=2$
) or become especially exited during flame transitions (e.g. between
 $n=0$
and 2). The irregular and non-periodic nature of the bistable flame-shape switching is made obvious by comparing the datasets: the durations of either V- or M-flame as well as the incidences of (in)complete flame-shape transitions vary drastically from dataset to dataset. For instance, while Dataset no. 2 exhibits only a brief period of M-flame between 0.2 and 0.3 s, Dataset no. 4 is dominated almost entirely by an M-flame, which only switches into a V-flame towards the end of the recording. Despite such differences, all the datasets share some common features: (i) a complete flame-shape transition (V–M or M–V) takes place within approximately 0.05 s, as pointed out in the discussions of figure 3(c); and (ii) the same frequency components can be identified in the spectrograms with consistent temporal behaviours with regard to the flame-shape indicator of
 $\langle I_{OH}\rangle ^{\boldsymbol{b}_{0}}$
, albeit with different magnitude, as shown in their corresponding power spectra.
Inspection of the flow field from Dataset no. 1: spatial power spectrum of prominent dynamics averaged over three vector components. The streamlines represent the mean flow field.

The spatial behaviours of the various dynamics can be revealed by examining the spectrogram
 $\unicode[STIX]{x1D64E}$
from a different perspective. Figure 5 shows the spatial power spectrum
 $\overline{\langle {\mathcal{P}}_{\unicode[STIX]{x1D651}^{\prime }}(n)\rangle }_{3}$
(i.e.
 $\unicode[STIX]{x1D64E}$
averaged over the sample size
 $N$
and the three components of velocity vectors) of Dataset no. 1 for some of the prominent dynamics. They correspond to the five scales labelled in figure 4(c). The mean flow field (
 $\overline{\langle \unicode[STIX]{x1D651}\rangle }_{N}$
) is also shown as streamlines for spatial reference. Not only do these dynamic components have different temporal behaviours as seen in figure 4(b), they also influence distinct parts of the flow field (albeit mostly confined within the IRZ) with their most active regions concentrating towards the inlet with increasing
 $n$
(i.e. frequency). Notice that since the mean flow field was subtracted from each dataset,
 $n=0$
represents the dynamical changes within its bandpass of
 $[0,19.5]~\text{Hz}$
, as given by (2.1).


Together with the temporal patterns shown in 4(a), this spatial perspective provides an additional gauge for identifying adjacent scales that belong to the same dynamics. With their help, a series of detail bundles were then designed to isolate the discernible dynamics in the bistable flow field by:
(i) grouping together scales
$n$
with similar spatial and temporal behaviours to enclose only a single dynamic component in each detail bundle;(ii) minimising spectral overlaps among the detail bundles; and
(iii) prioritising major dynamics (based on amplitudes from the power spectrum) over minor ones.

As discussed in § 2.3, due to the sometimes highly irregular gains of individual scales, their combinations (i.e. detail bundles) need to be thoroughly examined to ensure sufficient bandpass performance. By employing both actual data and the synthesised signal (such as those used throughout § 2.1), the detail bundles were tailored and optimised to handle the bistable flow field, where many of the frequency components reside in close vicinity to one another, as clearly shown in figure 4(c). A trade-off between spectral purity and sufficient temporal resolution (for transitions between the bistable states) was reached by using a total number of consecutive scales
 $k=6$
for each detail bundle, equivalent of a total bandwidth of 117.1875 Hz (the index
 $k$
is omitted in the notation henceforth unless a
 $k$
other than 6 is used). Nine detail bundles were eventually determined and are listed in table 1, including their total ideal bandpasses (
 ${\mathcal{I}}$
from (2.1)) and the peak frequencies (
 $f_{p}$
) of the enclosed dynamics extracted from figure 4(c) (the values are rounded for clarity). The gain behaviours of these detail bundles are discussed further in § A.3.
By comparing
 $f_{p}$
to previous studies (Oberleithner et al.
Reference Oberleithner, Stöhr, Im, Arndt and Steinberg2015; Stöhr et al.
Reference Stöhr, Oberleithner, Sieber, Yin and Meier2018),
 $\unicode[STIX]{x1D63D}_{12}$
,
 $\unicode[STIX]{x1D63D}_{21}$
and
 $\unicode[STIX]{x1D63D}_{46}$
are expected to enclose TA, PVC and 2PVC (second harmonic of PVC with approximately doubled frequency), while
 $\unicode[STIX]{x1D63D}_{6}$
and
 $\unicode[STIX]{x1D63D}_{37}$
can be associated with PVC-TA and PVC
 $+$
TA, i.e. TA modulations on PVC. The remaining five detail bundles are linked to dynamic components yet to be characterised. Specifically, a single value of
 $f_{p}$
cannot be determined for
 $\unicode[STIX]{x1D63D}_{0}$
since it encompasses several dissimilar and non-periodic dynamics. The roles of these newly uncovered dynamic components in the bistable flow field are thoroughly examined later in § 4.
3.4 Construction and POD of detail bundles
After determining the detail bundles, they were constructed following (2.13) (Steps 5 and 6a of the MRPOD Algorithm in § 2.5). In practice, specific steps were taken to reduce computational cost for all four datasets, as discussed in § A.6. In the end, for all four datasets analysed in this work, each detail bundle per dataset (8000 frames) took an (effective) average of 12.7 s to construct. A thorough breakdown of the computational time is provided in table 2 in § A.6.
Reconstruction of the fluctuating flow field at
 $t_{1}$
(M-flame) and
 $t_{2}$
(V-flame) shown in figure 3(b) with detail bundles of Dataset no. 1.

Figure 6 compares selected detail bundles to
 $\unicode[STIX]{x1D651}^{\prime }$
from Dataset no. 1 at
 $t_{1}$
and
 $t_{2}$
, the same time instances for the two snapshots given in figure 3(b), on a colour scale based on the
 $y$
-component of the fluctuating flow field (
 $v_{y}^{\prime }$
). As discussed in § 3.2, the flow fields at these two instances are characterised by a predominant PVC (M-flame,
 $t_{1}$
) and an absence of it (V-flame,
 $t_{2}$
), respectively. This is reflected in
 $\unicode[STIX]{x1D63D}_{21}$
, which highlights the helical structure of PVC at
 $t_{1}$
but barely registers any footprint at
 $t_{2}$
. On the other hand, the dynamic components contained in
 $\unicode[STIX]{x1D63D}_{0}$
do not follow the same pattern.
Figure 6 also demonstrates how to create multiresolution subsets of the original flow field by altering the selection vector
 $\unicode[STIX]{x1D739}_{n_{0}}^{(k)}$
in (2.13) to include either consecutive or discrete scales. The sum of all 9 detail bundles listed in table 1, i.e.
 $\unicode[STIX]{x1D63D}_{0}+\unicode[STIX]{x1D63D}_{6}+\cdots +\unicode[STIX]{x1D63D}_{70}$
(with a total number of scales of 54) is compared to
 $\unicode[STIX]{x1D63D}_{0}^{(76)}$
, which consists of the first 76 scales with a bandpass ending at approximately 1484 Hz (same as
 $\unicode[STIX]{x1D63D}_{70}$
in table 1). As can be seen, both replicate the primary features in
 $\unicode[STIX]{x1D651}^{\prime }$
fairly well, although they include respectively only 21 % and 30 % of the total 256 scales at the chosen decomposition level of
 $j=8$
. Note that the dynamics encompassed by the detail bundles can be visualised by constructing a reduced model of
 $\unicode[STIX]{x1D651}$
using
 $\unicode[STIX]{x1D63D}+\overline{\langle \unicode[STIX]{x1D651}\rangle }_{N}$
, as demonstrated in the supplementary movies 1 and 2 for
 $\unicode[STIX]{x1D63D}_{0}$
and
 $\unicode[STIX]{x1D63D}_{21}$
.
Once the detail bundles were constructed, they were subjected to POD as per Steps 6a and 7 of the MRPOD Algorithm. Alternatively, one could directly apply the transform operators of the corresponding detail bundles on the cross-correlation matrix of
 $\unicode[STIX]{x1D651}^{\prime }$
(Step 6b), as demonstrated below for Dataset no. 1.
(a) Cross-correlation matrices of
 $\unicode[STIX]{x1D651}^{\prime }$
from Dataset no. 1 and its selected detail bundles; (b) energy contributions of their corresponding POD modes.

Figure 7(a) compares the cross-correlation matrices
 $\unicode[STIX]{x1D646}_{\unicode[STIX]{x1D63D}}$
of selected detail bundles with a variety of bandpasses to
 $\unicode[STIX]{x1D646}_{\unicode[STIX]{x1D651}^{\prime }}$
of
 $\unicode[STIX]{x1D651}^{\prime }$
from Dataset no. 1. These results are obtained with (2.18), i.e. by completing Steps 5 and 6b of the MRPOD Algorithm, which is mathematically equivalent to computing the cross-correlation matrices based on the detail bundles constructed in Step 6a. Only a time segment of the cross-correlation matrices containing
 $300\times 300$
frames is plotted to emphasise the fine structures. The frame numbers are converted to the same time stamps corresponding to the M–V transition period shaded in figure 3(c). As can be seen, while
 $\unicode[STIX]{x1D646}_{\unicode[STIX]{x1D651}^{\prime }}$
appears noisy, the detail bundles
 $\unicode[STIX]{x1D646}_{\unicode[STIX]{x1D63D}}$
encapsulate not only distinct self-repeating structures on different time scales, but also their disparate intermittencies during the flame transition. For instance, the diminishing PVC during this period is clearly captured in the cross-correlation matrix of
 $\unicode[STIX]{x1D63D}_{21}$
.
Figure 7(b) plots the energy contributions (
 $E_{l}=\unicode[STIX]{x1D706}_{l}/\sum \unicode[STIX]{x1D706}_{l}$
) of the POD modes derived from solving the eigenvalue problem of the cross-correlation matrices shown above them using (2.15) and (2.16). It is known that coherent, periodic structures usually appear as pairs of POD modes with similar energy contributions. For
 $\unicode[STIX]{x1D651}^{\prime }$
, the energy-ranking mechanism of POD identifies just three outstanding modes despite the existence of diverse dynamics, as seen in figure 4. Sorting through various POD modes and pairing them are usually non-trivial, not to mention that each mode may contain multiple frequency components. On the other hand, as each detail bundle was designed to enclose only a single dynamic component, MRPOD is capable of promoting a pair of modes that can be directly assigned to the said dynamic component, especially for PVC-related dynamics
 $\unicode[STIX]{x1D63D}_{21}$
and
 $\unicode[STIX]{x1D63D}_{46}$
that are expected to have relatively well-defined frequencies and strong coherence during M-flame periods. This is demonstrated in the next section.
4 Characterisation of MRPOD modes
In order to characterise the spatial and temporal behaviours of various prevalent dynamics existing in the bistable flow field, this section examines in detail the MRPOD mode pairs extracted from all nine detail bundles. As a comparison, pseudo mode pairs from POD of
 $\unicode[STIX]{x1D651}^{\prime }$
(grouped together based on their spatial and spectral similarities) are also shown to demonstrate the advantages of the MRPOD method. Since the results appeared highly consistent among all four datasets, only those from Dataset no. 1 are presented in the next four subsections. Additional examples of MRPOD modes from other datasets can be found in appendix B.
4.1 PVC, 3PVC and TA modulations
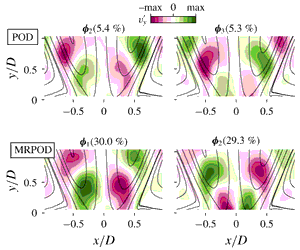
Comparisons of POD modes (first row) and MRPOD mode pairs of Dataset no. 1, with columns: (a) spatial modes; (b) PSD and (c) phase portraits of the temporal coefficients.

The first row of figure 8 displays from left to right: (a) the first two most energetic modes (
 $\unicode[STIX]{x1D753}_{1}$
and
 $\unicode[STIX]{x1D753}_{2}$
) of
 $\unicode[STIX]{x1D651}^{\prime }$
with their energy contributions
 $E$
printed on top, (b) the power spectral density and (c) the phase portrait of their corresponding temporal coefficients (
 $\boldsymbol{a}_{1}$
and
 $\boldsymbol{a}_{2}$
). The filled contour for each spatial mode was generated based on the magnitude of
 $v_{y}^{\prime }$
(same as in figure 6) with an overlay of the streamlines of
 $\overline{\langle \unicode[STIX]{x1D651}\rangle }_{N}$
. PSDs were calculated using the Welch method with a boxcar window size of 512 frames and 50 % overlap. To illustrate the influence of flame-shape transitions on the temporal behaviours of the modes, the phase portrait was coloured by the amplitude of
 $\langle I_{OH}\rangle ^{\boldsymbol{b}_{0}}$
as shown in figure 3(c) and in figure 4(a). To provide a qualitative indicator of the state of the flame, the colour scale was capped at 0.3 of the normalised amplitude and was composed of three colours representing three states of the flame: blue for M-flame (
 $\langle I_{OH}\rangle ^{\boldsymbol{b}_{0}}\sim 0$
), green for V-flame (
 $\langle I_{OH}\rangle ^{\boldsymbol{b}_{0}}\geqslant 0.3$
) and red for the transitions between M- and V-flame periods.
As can be seen,
 $\unicode[STIX]{x1D753}_{1}$
and
 $\unicode[STIX]{x1D753}_{2}$
from direct POD of
 $\unicode[STIX]{x1D651}^{\prime }$
form a mode pair that can be assigned to the PVC based on prior experience: they both exhibit coherent helical structures (‘zig-zag’ distributions of local maxima and minima of
 $v_{y}^{\prime }$
) with (i) similar energy contributions, (ii) a relative spatial displacement, (iii) nearly identical spectral profiles with the peak at
 $f_{p}\approx 469~\text{Hz}$
(corresponding to a Strouhal number of
 ${\sim}$
0.9) and (iv) a relative phase shift of approximately
 $\unicode[STIX]{x03C0}/2$
between
 $\boldsymbol{a}_{1}$
and
 $\boldsymbol{a}_{2}$
, hence the near circular phase portrait (albeit noisy) during M-flame. In addition, the intermittent nature of PVC is visible in the phase portrait in figure 8(c), as the coherence between the two modes is only sustained during the M-flame (blue coloured lines in the phase portrait). However, from the PSD in figure 8(b), an array of minor dynamics is also lumped into
 $\unicode[STIX]{x1D753}_{1}$
and
 $\unicode[STIX]{x1D753}_{2}$
, making it difficult to interpret their spatial and temporal contributions to the flow field.
With the aim of separating PVC from the other minor dynamics, the next four rows of figure 8 present the same set of results but from MRPOD mode pairs of selected detail bundles. As mentioned in figure 7(b), when a single frequency component is enclosed in a detail bundle, only one mode pair describing the related dynamics is expected to emerge as the first two most energetic modes. This is observed for most of the detail bundles included here, especially with
 $\unicode[STIX]{x1D63D}_{21}$
, where the PVC mode pair captures close to 90 % of the total kinetic energy contained within
 $\unicode[STIX]{x1D63D}_{21}$
. Although the spatial modes do not seem to differ significantly from the ones of
 $\unicode[STIX]{x1D651}^{\prime }$
, they exhibit a remarkable spectral purity when comparing the PSD of
 $\boldsymbol{a}_{1}$
and
 $\boldsymbol{a}_{2}$
to that of
 $\unicode[STIX]{x1D651}^{\prime }$
(
 $\boldsymbol{a}_{1,\unicode[STIX]{x1D651}^{\prime }}$
, plotted in the background). The phase portrait of
 $\boldsymbol{a}_{1}$
and
 $\boldsymbol{a}_{2}$
shows not only an improved coherence during M-flame with more confined amplitude (blue lines), but also a distinguishable cascade from M- to V-flame (green) via the transition periods (red).
The two minor dynamics to each side of the PVC peak in figure 8(b) are at
 $f_{p}\approx 195~\text{Hz}$
(PVC-TA) and 762 Hz (PVC
 $+$
TA) respectively. As discussed in previous sections, they have been attributed to the interplay between PVC and TA. They are well isolated in
 $\unicode[STIX]{x1D63D}_{6}$
and
 $\unicode[STIX]{x1D63D}_{37}$
as shown in the third and fourth rows of figure 8. For
 $\unicode[STIX]{x1D63D}_{6}$
, it appears the limited field of view of PIV does not completely capture the displacement of the dynamics, a likely cause of the 5 % energy difference between the two modes. For
 $\unicode[STIX]{x1D63D}_{37}$
, a weak presence of PVC is also visible in the PSD, a result of ‘leakage’ in the gain function of the detail bundle as discussed in § 2.1 and § 2.3. However, the influence of PVC is not as discernible in the spatial modes. The high-frequency dynamic component isolated by
 $\unicode[STIX]{x1D63D}_{70}$
has
 $f_{p}\approx 1426~\text{Hz}$
, roughly three times that of PVC, suggesting that it is likely the third harmonic of PVC (3PVC). When compared with the PVC modes in
 $\unicode[STIX]{x1D63D}_{21}$
, these minor dynamic components seem to be associated with similar helical vortex structures but with varying spatial wavelengths, which decrease with increasing frequency. The phase portraits of these minor modes show that they also exist primarily during M-flame but with notably larger jitters likely due to higher intermittency and weaker coherence, especially for
 $\unicode[STIX]{x1D63D}_{6}$
and
 $\unicode[STIX]{x1D63D}_{37}$
.
Notice that since Dataset no. 1 contains long durations of M-flame, conventional POD could already extract fairly coherent spatial modes of PVC (albeit with interference from other dynamic components) by analysing the entire data series as shown in figure 8. This is, however, not the case for other datasets with a short-lived M-flame period, as shown in figure 19 in appendix B for Dataset no. 2. The improvement gained from MRPOD thus becomes much more pronounced for those cases.
4.2 TA, 2PVC and their interplays
More comparisons of POD modes (first row) and MRPOD mode pairs of Dataset no. 1, with columns: (a) spatial modes; (b) PSD and (c) phase portraits of the temporal coefficients.

Other than the PVC modes, the rest of the POD modes of
 $\unicode[STIX]{x1D651}^{\prime }$
cannot be easily interpreted due to their convoluted spatial and spectral features, as exemplified in figure 9 for
 $\unicode[STIX]{x1D753}_{6}$
and
 $\unicode[STIX]{x1D753}_{7}$
of
 $\unicode[STIX]{x1D651}^{\prime }$
which are grouped together based on the similarity of their PSDs. Due to the inclusion of several similarly weighted frequency components, both the spatial modes and the phase portrait provide poor indications of any coherent structures. A different picture regarding this group of dynamics can be gained from the corresponding detail bundles.
The detail bundle
 $\unicode[STIX]{x1D63D}_{12}$
isolates the first strong peak at
 $f_{p}\approx 293~\text{Hz}$
. Unlike in the case of PVC, the MRPOD modes consist of energetic structures along the centre axis in the IRZ, previously recognised as the axial pumping motion of TA. As in the case of
 $\unicode[STIX]{x1D63D}_{6}$
shown in figure 8, the first two modes exhibit similar energy discrepancy as well as poor temporal coherence. At
 $f_{p}\approx 957~\text{Hz}$
approximately double that of PVC, the MRPOD mode pair from
 $\unicode[STIX]{x1D63D}_{46}$
corresponds to the second harmonic of PVC, i.e. 2PVC. Much like in the case of PVC, the phase portrait also shows a cascade from more coherent periods during M-flame (blue) to flame transitions (red) and eventually diminishes during V-flame (green). However, 2PVC exhibits a much wider spread (amplitude jitter) in the magnitude during M-flame than PVC. In addition, two weak peaks visible in the PSD of
 $\boldsymbol{a}_{6,\unicode[STIX]{x1D651}^{\prime }}$
are localised within
 $\unicode[STIX]{x1D63D}_{31}$
and
 $\unicode[STIX]{x1D63D}_{61}$
. Their peak frequencies, at approximately 625 Hz (2PVC-TA) and 1250 Hz (2PVC
 $+$
TA), seem to allude to interactions between 2PVC and TA, much in the same subtraction/addition manner as in the case of TA modulation on PVC captured by
 $\unicode[STIX]{x1D63D}_{6}$
and
 $\unicode[STIX]{x1D63D}_{37}$
. However, these two instabilities appear energetic mostly during V-flame according to their phase portraits, opposite to the PVC and TA modulations on PVC shown in both figures 8. This discovery provides further evidence of a mean flow modulation type of interaction between TA instabilities and the PVC dynamics (including 2PVC), as first unveiled in Stöhr et al. (Reference Stöhr, Oberleithner, Sieber, Yin and Meier2018).
Notice also that the spatial distributions of the PVC-related modes are generally consistent with the observations made in figure 8: the wavelengths of the vortex structures decrease with increasing frequency. However, other than the ‘zig-zag’ vortex pattern seen for all the PVC-related instabilities shown in figure 8, in this 2-D perspective, 2PVC (
 $\unicode[STIX]{x1D63D}_{46}$
) and 2PVC
 $+$
TA (
 $\unicode[STIX]{x1D63D}_{61}$
) exhibit rather axisymmetric distributions of local maxima/minima of
 $v_{y}^{\prime }$
. Based on analysis of LES results of a similar swirl-stabilised flame, it was concluded that such distributions are manifestations of double helical structures in 2-D measurement planes.
4.3 Non-periodic shift and switch modes
Low-frequency modes of
 $\unicode[STIX]{x1D651}^{\prime }$
(first row) and the corresponding MRPOD mode pairs of Dataset no. 1, with columns: (a) spatial modes; (b) PSD and (c) phase portraits of the temporal coefficients.

The third and fourth strongest modes of
 $\unicode[STIX]{x1D651}^{\prime }$
are shown in figure 10 (first row) with nearly identical spectral profiles based on the PSD of their temporal coefficients. However, they have quite different spatial structures with
 $\unicode[STIX]{x1D753}_{3}$
being by far the more energetic mode, which has been identified as the shift mode and associated with slow changes in the mean flow field as flame switches between V- and M-shapes (Stöhr et al.
Reference Stöhr, Oberleithner, Sieber, Yin and Meier2018). Both of the modes are dominated by low-frequency components but are also interfered by TA at
 $f_{p}\approx 293~\text{Hz}$
and 2PVC at
 $f_{p}\approx 957~\text{Hz}$
. The phase portrait of their temporal coefficients does not suggest any obvious coupling between the two modes, besides the fact that
 $\boldsymbol{a}_{3}$
appears to change sign depending on the flame shape.
The detail bundle
 $\unicode[STIX]{x1D63D}_{0}$
is able to isolate the same modes from the influence of higher-frequency dynamics, as demonstrated in the second row of figure 10. Although its
 $\unicode[STIX]{x1D753}_{1}$
is nearly identical to
 $\unicode[STIX]{x1D753}_{3}$
of
 $\unicode[STIX]{x1D651}^{\prime }$
,
 $\unicode[STIX]{x1D753}_{2}$
shows a more pronounced influence along the backflow in the IRZ and right at the nozzle exit. Moreover, from the phase portrait, there are parabolic-like ‘bridges’ between the two otherwise isolated islands of uncorrelated coefficients. Upon further investigation, they correspond to the transition periods between the V- and M-flames (see supplementary movies 1 and 2). This seems to suggest that these two modes may only become temporarily coupled during flame-shape transitions. If the two modes were completely uncorrelated, one would expect random distributions of coefficients instead, as seen in the phase portrait of
 $\unicode[STIX]{x1D753}_{6}$
and
 $\unicode[STIX]{x1D753}_{7}$
of
 $\unicode[STIX]{x1D651}^{\prime }$
in figure 9. Further evidence of this transient coupling can also be seen in the spectrogram in figure 4(b), where the two low-frequency peaks at
 $n=0$
and
 $n=2$
appear to ‘merge’ during flame transitions. Also notice that,
 $\unicode[STIX]{x1D753}_{2}$
experiences larger fluctuations during V-flame, as evident from the spread of
 $\boldsymbol{a}_{2}$
in the phase portrait. This is consistent with the visibly strong peaks at
 $n=2$
in the spectrogram in figure 4(b) during the same period. Since unlike the shift mode,
 $\unicode[STIX]{x1D753}_{2}$
is only active during flame-shape switchings, it is termed accordingly as the switch mode in this work.
4.4 Bi-modal behaviours
Secondary mode pairs from POD of selected detail bundles from Dataset no. 1.
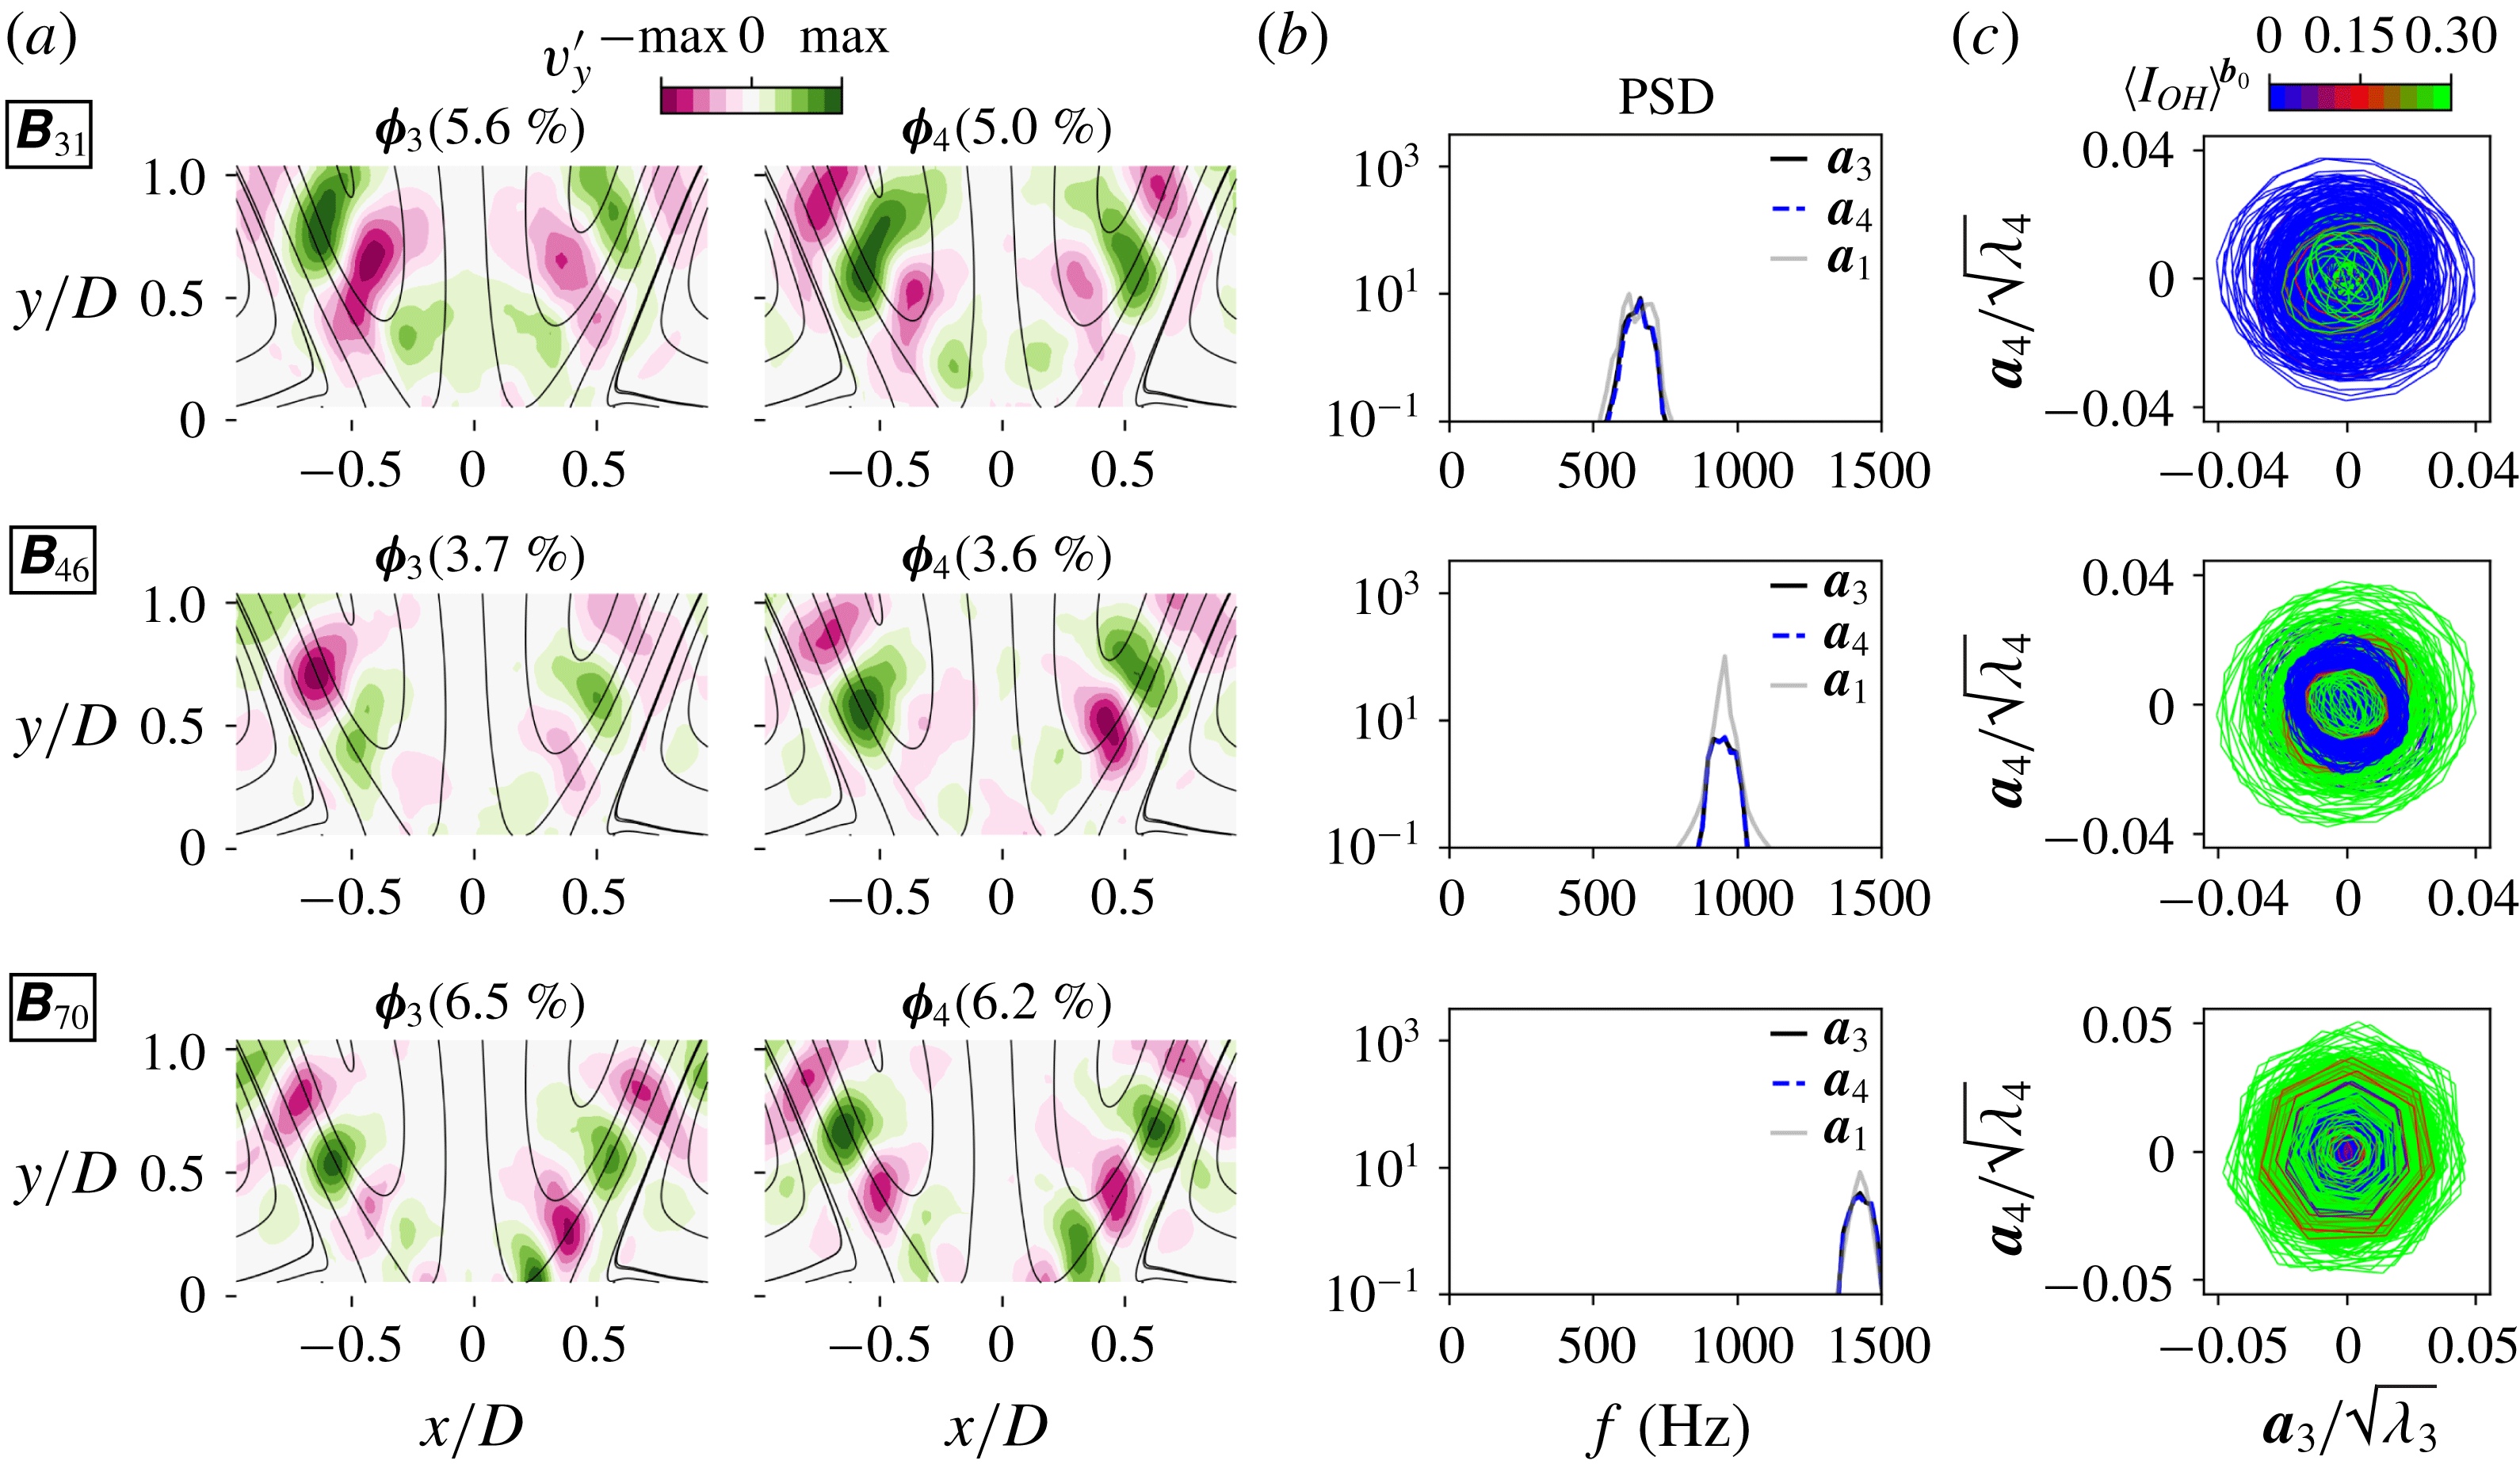
Upon further examination of the other MRPOD modes from the various detail bundles, secondary mode pairs (
 $\unicode[STIX]{x1D753}_{3}$
and
 $\unicode[STIX]{x1D753}_{4}$
) were uncovered for 2PVC-TA (
 $\unicode[STIX]{x1D63D}_{31}$
), 2PVC (
 $\unicode[STIX]{x1D63D}_{46}$
) and 3PVC (
 $\unicode[STIX]{x1D63D}_{70}$
), as shown in figure 11. When compared with their corresponding primary mode pairs (
 $\unicode[STIX]{x1D753}_{1}$
and
 $\unicode[STIX]{x1D753}_{2}$
) in figures 8 and 9:
(i) The secondary mode pairs reside at the same frequencies as their primary peers, as clearly shown in the PSD profiles in column (b).
(ii) Their spatial modes exhibit a double helical structure (nearly axisymmetric distribution of local maxima/minima in a 2-D measurement plane) if their primary modes contain a single helical structure (i.e. ‘zig-zag’ vortex pattern, most notably for
$\unicode[STIX]{x1D63D}_{31}$
).(iii) From the phase portraits in column (c), they behave temporally in the opposite manner to the primary modes: they are more energetic during M-flame if the primary modes are more so during V-flame, and vice versa.

Such a strong presence of secondary mode pairs was not found in other detail bundles. It is therefore clear that, while PVC may only prevail during M-flame, its harmonics (2PVC and 3PVC) as well as TA-modulations (2PVC-TA) could actually attain a bi-modal nature both in the spatial and temporal domains depending on the flame shape: while exhibiting respectively the same characteristic frequencies, they could consist of either single or double helical structures and could be primarily active during either M- or V-flame.
Based on the results thus far, it becomes quite evident that conventional POD is generally incapable of distinguishing various frequency components and tends to lump together dissimilar dynamics, rendering it difficult to make unambiguous interpretations of the derived modes: firstly, from the PSD of
 $\boldsymbol{a}_{1,\unicode[STIX]{x1D651}^{\prime }}$
and
 $\boldsymbol{a}_{2,\unicode[STIX]{x1D651}^{\prime }}$
, the PVC temporal and spatial modes of
 $\unicode[STIX]{x1D651}^{\prime }$
are influenced by other PVC-related instabilities. MRPOD, on the other hand, is able to separate these relatively weak dynamic components from one another and derive modal representations of them that depict single or double helical structures with decreasing wavelengths and increasing frequency. Secondly, despite having a distinct spatial symmetry, TA is not singled out in POD of
 $\unicode[STIX]{x1D651}^{\prime }$
but split among several modes and mixed with the PVC-related dynamics (
 $\unicode[STIX]{x1D753}_{3}$
to
 $\unicode[STIX]{x1D753}_{7}$
). With the spectral isolation provided by
 $\unicode[STIX]{x1D63D}_{12}$
, the unique spatial representation of TA as well as its highly intermittent nature are captured in the MRPOD modes. Thirdly, unlike in the case of POD, the low-frequency dynamics contained in
 $\unicode[STIX]{x1D63D}_{0}$
directly points to a weak and transient coupling between the previously discovered shift mode and the newly characterised switch mode. Both of them could be considered to form a temporary mode pair that reflects the irregular flame-shape switching dynamics. Fourthly, the bi-modal behaviours of some of the dynamic components would have been easily overlooked in conventional POD due to their weak presence. They might also elude pure dynamic-ranking techniques such as DMD depending on segmentation of the datasets. MRPOD, however, makes it possible to distinguish dynamics that exhibit the same characteristic frequency but consist of different spatial and temporal patterns. Lastly, MRPOD also significantly lessens the difficulty of recognising mode pairs that can be linked to specific dynamics. The variable bandpasses of the detail bundles automatically promote spatial coherent structures that are associated with the encompassed dynamics during the POD process. This is especially helpful for identifying and characterising weak dynamic components.
Notice that the bandwidth of the detail bundles has so far been kept constant (
 $k=6$
) for the sake of consistency. However, the multiresolution nature of the MODWPT-based analysis allows flexible constructions of additional detail bundles (as demonstrated in figure 6) for optimised temporal resolution, especially for dynamic components such as PVC that might experience transient growth during V-flame, as demonstrated in the following subsection.
4.5 PVC versus flame-shape switching
To gain insights into the roles of key frequency components (shift/switch, PVC and TA) extracted from the bistable flow field in the flame-shape transitions and common trends of dynamic interactions shared amongst different datasets, the next two subsections scrutinise the temporal coefficients of the MRPOD modes obtained from all four datasets shown in figure 4.
Temporal evolution of PVC versus shift and switch modes for all the datasets: (a) integrated OH signal and its detail bundle
 $\boldsymbol{b}_{8,0}^{(6)}$
for reference of flame shape; (b) the temporal coefficients of the shift and switch modes from
 $\unicode[STIX]{x1D63D}_{0}$
and (c) the amplitude of PVC based on its temporal coefficients extracted from
 $\unicode[STIX]{x1D63D}_{21}$
.

For all four datasets, figure 12 compares the temporal evolution of (b) shift/switch modes (
 $\boldsymbol{a}_{1}$
and
 $\boldsymbol{a}_{2}$
from
 $\unicode[STIX]{x1D63D}_{0}$
) to the (c) amplitude of PVC. Integrated OH signal right above the nozzle
 $\langle I_{OH}\rangle$
first shown in figure 3(c) is plotted in figure 12(a) to indicate the flame shape. Its detail bundle
 $\langle I_{OH}\rangle ^{\boldsymbol{b}_{0}}$
with the same bandpass as
 $\unicode[STIX]{x1D63D}_{0}$
is also shown to better trace the flame-shape transitions. The amplitude of PVC was calculated based on
 $\sqrt{\boldsymbol{a}_{1}^{2}+\boldsymbol{ a}_{2}^{2}}$
, i.e. the norm of the mode pair. In addition, the incidences of M–V and V–M transitions are indicated qualitatively by vertical dashed lines across three panels for all the datasets. As can be seen, when compared against
 $\langle I_{OH}\rangle ^{\boldsymbol{b}_{0}}$
, the bistable states (i.e. V- or M-flame) can be easily inferred from both the shift mode, which tends to stabilise during either flame-shape period, and the PVC amplitude, which stabilises during M-flame periods but diminishes close to zero during V-flame. Also clearly shown is the coincidence of the flame-shape transitions with the growth (V–M) and suppression (M–V) of PVC. On the other hand, the switch mode remains relatively inactive during either flame-shape period but peaks sharply during flame transitions (especially M–V), a universal trend seen in all four datasets. Moreover, a consistent phase lag can be observed between the rise in the switch mode and the transition of the shift mode from one bistable state into the other (more obvious during M–V transitions), indicating a temporary coupling between the two modes. Note that this is also the cause of the ‘bridges’ observed in the phase portrait in figure 10(c) of
 $\unicode[STIX]{x1D63D}_{0}$
. Unlike in the case of more coherent dynamic components such as PVC, the phase lag between the shift and switch modes is not strictly
 $\unicode[STIX]{x03C0}/2$
but can vary widely from transition to transition, giving rise to a non-circular and random appearance of the ‘bridges’.
The importance of this transient coupling between the shift and switch modes can be further understood by the differences in their spatial distributions, i.e.
 $\unicode[STIX]{x1D753}_{1}$
and
 $\unicode[STIX]{x1D753}_{2}$
shown in figure 10(a) (and for other datasets in figure 20 in appendix B). The switch mode appears to compensate the shift mode by exerting a pronounced modification along the backflow and near the inlet in the IRZ. The rise of its temporal coefficient (
 $\boldsymbol{a}_{2}$
) increases across the zero line prior to flame transitions signifies an increase in the backflow velocity. This process is also visualised in the supplementary movies 1 and 2 for V–M and M–V transitions, respectively. By comparing stable swirl flames with either V- or M-shapes, Terhaar, Oberleithner & Paschereit (Reference Terhaar, Oberleithner and Paschereit2015) have demonstrated that strong backflow near the nozzle destabilises the flow field and also determines the growth rate of PVC. It is therefore necessary to consider both the shift and switch modes when describing the dynamics of flame-shape switching: while the former captures the slow-varying global flow field, the latter reflects the fast transient changes mainly in the IRZ. The shift and switch modes can then be regarded as a temporary mode pair that only becomes strongly coupled during transitions between both flame shapes.
In addition to the incidences of complete flame-shape transitions that are marked explicitly by vertical dashed lines, incomplete transitions were also registered as short-lived PVC growth/decay events, which could not be sufficiently resolved by the bandwidth of the detail bundle
 $\unicode[STIX]{x1D63D}_{21}$
. As an example,
 $\unicode[STIX]{x1D63D}_{19}^{(12)}$
centred around PVC but with double the bandwidth (
 $k=12$
at
 $j=8$
) is plotted in figure 12(c) for Dataset no. 1. This detail bundle still does not overlap with adjacent detail bundles and offers a higher temporal resolution. As can be seen, although
 $\unicode[STIX]{x1D63D}_{21}$
can adequately resolve most of the temporal behaviours of PVC development in the bistable flow field, it under-resolves occasional sharp peaks in the PVC amplitude during V-flame periods (labelled by red arrows), which may be linked to unsuccessful attempts of V–M transitions.
4.6 TA versus flame-shape switching
Temporal evolution of TA instabilities during flame transitions for all the datasets: (a) integrated OH signal and its detail bundle
 $\boldsymbol{b}_{8,12}^{(6)}$
for reference of flame shape and activities of TA oscillations; (b) the amplitudes of TA oscillations and PVC-TA in the flow field based on its temporal coefficients extracted from
 $\unicode[STIX]{x1D63D}_{12}$
and
 $\unicode[STIX]{x1D63D}_{6}$
, respectively.

As discussed in § 3.1, TA which has been observed to cause repetitive flame reattachments during M–V transitions (Stöhr et al.
Reference Stöhr, Oberleithner, Sieber, Yin and Meier2018), suppresses PVC and leads to an eventual flame stabilisation in a V-shape. To show that this is the prevailing trend in the bistable flow field, figure 13 compares the temporal evolution of TA oscillations derived from
 $\unicode[STIX]{x1D63D}_{12}$
to
 $\langle I_{OH}\rangle$
. The same vertical dashed lines from figure 12 are used here to indicate flame-shape transitions. As can be seen in figure 13(b), TA oscillations in the flow field becomes more energetic during M-flame periods, especially pronounced for Datasets no. 1, no. 3 and no. 4. Since
 $\langle I_{OH}\rangle$
only includes the OH signal right at the nozzle (above the bluff body, see figure 3), repetitive flame reattachment is reflected in
 $\langle I_{OH}\rangle$
as small spikes during M-flame prior to M–V transitions, exemplified by blue arrows in figure 13(a), which start to emerge mostly prior to M–V transitions, as can be seen in figure 13(a). To see that these spikes are indeed caused by the same TA oscillations, the detail bundle
 $\langle I_{OH}\rangle ^{\boldsymbol{b}_{12}}$
(
 $\boldsymbol{b}_{12}$
is short for
 $\boldsymbol{b}_{8,12}^{(6)}$
) that has the same bandpass as
 $\unicode[STIX]{x1D63D}_{12}$
was used to isolate TA-influenced components from
 $\langle I_{OH}\rangle$
and is plotted for all datasets in figure 13(a) as well. As can be seen, the increases in the fluctuations of
 $\langle I_{OH}\rangle ^{\boldsymbol{b}_{12}}$
before M–V transitions correspond well with the spikes in
 $\langle I_{OH}\rangle$
.
In addition to TA, the amplitude of one of the TA modulations on PVC, PVC-TA extracted from
 $\unicode[STIX]{x1D63D}_{6}$
, is also plotted in figure 13(b). PVC
 $+$
TA exhibits similar behaviours and is therefore omitted. As can be seen, the modulation demonstrates a strong dependence on TA: its temporal evolution follows almost exactly that of TA oscillations. As suggested by Stöhr et al. (Reference Stöhr, Oberleithner, Sieber, Yin and Meier2018) for the nature of the mean flow modulation type of interaction between TA and PVC, since the growth rate of PVC does not really diminish close to M–V transitions, it would regain its amplitude if TA were to be ‘turned off’. This speculation can be supported by comparing figure 13 and figure 12 for Datasets no. 1 and no. 4 during unsuccessful M–V transitions and very short-lived M-flame periods. For instance, during the first M-flame period in Dataset no. 1, PVC recovers after a brief dip around 0.05 s, which can be attributed to the damping of TA oscillations. Only after the second development of TA oscillation within the same M-flame period could a complete M–V transition be achieved. Similar behaviours can be seen at multiple time incidences in Dataset no. 4.
Moreover, it is also clear from figure 13, heightened TA oscillations in the flow field alone do not always result in flame-shape transitions, such as in Dataset no. 3 and no. 4. This suggests that TA likely functions as a mechanism for an M-flame to reattach to form a V-flame when the global conditions in the flow field ripens for a flame transition.
5 Conclusions and outlook
5.1 Conclusions I: MODWPT-based modal analysis
In this work, a method of modal analysis based on maximum overlap discrete wavelet packet transform is proposed with an aim to time–frequency localise intermittent dynamics in turbulent flows. Firstly, MODWPT of time series is generalised into a matrix form to facilitate handling of multidimensional data series for efficient computation. Secondly, the concept of detail bundle is introduced to group together a flexible number of wavelet details to achieve a variable spectral bandpass and time resolution during reconstruction of the data series. Thirdly, when interfaced with the snapshot proper orthogonal decomposition, it is shown that the POD of detail bundles is equivalent to applying the corresponding transform operators directly to the cross-correlation matrix constructed by the original data series, essentially a form of multiresolution POD (MRPOD).
The main features of the proposed MRPOD are:
(i) Selectivity. The discrete nature of the wavelet details in the spectral domain affords considerable flexibility when constructing detail bundles with variable (dis)continuous bandwidths as well as bandpasses.
(ii) Spectral purity. With its well-defined spectral bandpasses, the detail bundles promote mode pairs responsible solely for the encompassed dynamics via the energy ranking process of POD. The gained spectral purity can facilitate unambiguous interpretations of the extracted spatial and temporal modes.
(iii) Ease of implementation. The matrix formulation can be easily programmed and can also be interfaced with a vast existing library of wavelet tools from Matlab or Python.
5.2 Conclusions II: MRPOD of the bistable flow field
The proposed method of MRPOD is applied to four datasets of high-speed three-component flow field measurements from a bistable swirl flame to time–frequency localise the various dynamic components existing on different time scales that are involved in the irregular flame-shape transitions. The spectral, spatial and temporal behaviours of these dynamic components are characterised and compared in detail. Newly gained insights into the bistable phenomenon are summarised below:
(i) Previously unidentified dynamics, including the switch mode, TA modulation on 2PVC and a higher-order PVC harmonics (3PVC), is unveiled owing to the spectral isolations offered by MRPOD.
(ii) The switch mode couples to the shift mode to form a temporary mode pair only during flame-shape transitions, when it is seen to strongly modify the backflow velocity that is known to influence PVC growth rate.
(iii) Prior to and during M–V transitions, strong TA oscillations in the flow field induce repetitive flame reattachment and an eventual stabilisation as a V-flame. However, sustained TA instability alone does not presage the onset of an M–V transition.
(iv) Several PVC-related dynamics exhibit spatial and temporal bi-modal behaviours: while having the same characteristic frequencies, they could possess either a single or double helical structure and they could be active during either V- or M-flame periods.
5.3 Outlook
Although the MODWPT-based MRPOD is devised to investigate turbulent flows containing intermittent dynamics, it should be equally applicable to stationary problems for separation of different frequency components and for enhancement of coherent structures. As already demonstrated in appendices C and D, MRPOD in principle does not require the use of MODWPT. Its core concept of MRA and shift invariance could be potentially realised more efficiently and effectively by employing more recently emerged techniques such as dual-tree and M-band wavelet transforms (Selesnick, Baraniuk & Kingsbury Reference Selesnick, Baraniuk and Kingsbury2005; Chaux, Duval & Pesquet Reference Chaux, Duval and Pesquet2006; Bayram & Selesnick Reference Bayram and Selesnick2008).
Further insights into the physical mechanisms of the flame transitions in the bistable flow field may be gained by performing additional MRPOD on the simultaneously acquired OH PLIF and the density field (based on the Mie scattering of seeded particles). Additionally, MRPOD might also be used for filtering of the turbulent flow dynamics in order to obtain a smoothed, time-varying base flow, which would be suitable for determining time-dependent PVC growth rates using the method of local LSA (Rukes et al. Reference Rukes, Sieber, Paschereit and Oberleithner2017; Stöhr et al. Reference Stöhr, Oberleithner, Sieber, Yin and Meier2018). Moreover, controlled suppression of PVC using open- or closed-loop forcing as proposed by Kuhn et al. (Reference Kuhn, Moeck, Paschereit and Oberleithner2016) and Müller, Lückoff & Oberleithner (Reference Müller, Lückoff and Oberleithner2018) might stabilise the flame in the attached V-shape and thus inhibit bistability. Although it is difficult to analyse the PIV data online using MRPOD due to hardware limitations, it is conceivable to utilise microphones to identify the onset of bistabilities for the purpose of active control.
Supplementary movies
Supplementary movies are available at https://doi.org/10.1017/jfm.2019.762.
Appendix A. Additional details regarding MODWPT
A.1 The pyramid scheme
Flow chart of MODWPT in a pyramid scheme up to decomposition level
 $j=2$
.

The process of WPT can be more readily visualised via the pyramid flow chart shown in figure 14. The elements enclosed inside solid lines belong to standard (partial) MODWT up to a decomposition level
 $j=2$
(can be compared to figure 1), while the ones enclosed in dashed lines are additions from wavelet packet transform. As can be seen, while MODWT only decomposes the scaling coefficient (lowpass) at each decomposition level, MODWPT decomposes the wavelet coefficient (highpass) as well to achieve finer scales with uniform (ideal) bandwidths. Note that with DWPT, a downsampling is applied to the coefficients at each decomposition level, as detailed in appendix C.
A.2 Wavelet composite filter and transform matrix
Instead of using a pyramid algorithm to repeatedly filter the previous decomposition level with the same wavelet filter (Mallat Reference Mallat1989), the composite-filter approach adopted in this work allows for direct decomposition/reconstruction at any given decomposition level
 $j$
and scale
 $n=0,1,\ldots ,2^{j}-1$
. The composite filter
 $\boldsymbol{u}_{j,n}$
is obtained by compounding the wavelet filter
 $\boldsymbol{h}$
and its scaling filter
 $\boldsymbol{g}$
used in an equivalent filter cascade scheme (as in a pyramid algorithm). In the case of MODWPT, the
 $l$
th element of
 $\boldsymbol{u}_{j,n}\in \mathbb{R}^{L_{j}}$
(for
 $j>1$
) is obtained by
 $$\begin{eqnarray}u_{j,n,l}=2^{-j/2}\mathop{\sum }_{k=1}^{L}c_{n,k}u_{j-1,\lfloor \frac{n}{2}\rfloor ,l-2^{j-1}k},\quad l=1,2,\ldots ,L_{j}\end{eqnarray}$$
where
 $L$
and
 $L_{j}=(2^{j}-1)(L-1)+1$
are the lengths of
 $\boldsymbol{h}$
(or
 $\boldsymbol{g}$
) and
 $\boldsymbol{u}_{j,n}$
, respectively; ‘
 $\lfloor \,\rfloor$
’ denotes the floor operator (integer part) and
 $$\begin{eqnarray}\boldsymbol{c}_{n}=\left\{\begin{array}{@{}ll@{}}\boldsymbol{h}, & n\;\text{mod}\;4=1\;\text{or}\;2,\\ \boldsymbol{g}, & n\;\text{mod}\;4=0\;\text{or}\;3,\end{array}\right.\end{eqnarray}$$
with ‘mod’ denoting the module operator. For
 $j=1$
,
 $\boldsymbol{u}_{1,0}=\boldsymbol{g}$
and
 $\boldsymbol{u}_{1,1}=\boldsymbol{h}$
. Note that in this work, the scaling filter
 $\boldsymbol{g}$
is derived from the chosen wavelet filter
 $\boldsymbol{h}$
. The
 $l$
th element of
 $\boldsymbol{g}$
is
 $g_{l}=(-1)^{l+1}h_{L-1-l}$
(i.e. a quadrature mirror filter). The
 $t$
th element of the wavelet coefficient
 $\boldsymbol{w}_{j,n}$
can be derived from
 $$\begin{eqnarray}w_{j,n,t}=\mathop{\sum }_{l=1}^{L_{j}}u_{j,n,l}x_{(t-l)\;\text{mod}\;N},\quad t=1,2,\ldots ,N\end{eqnarray}$$
or from
 $$\begin{eqnarray}w_{j,n,t}=\mathop{\sum }_{l=1}^{N}u_{j,n,(t-l)\;\text{mod}\;N}^{\circ }x_{l},\quad t=1,2,\ldots ,N\end{eqnarray}$$
both of which represent circularly convolving
 $\boldsymbol{x}$
with
 $\boldsymbol{u}_{j,n}$
. In (A 4),
 $\boldsymbol{u}_{j,n}^{\circ }\in \mathbb{R}^{N}$
is
 $\boldsymbol{u}_{j,n}$
periodised to the length of
 $N$
, i.e.
 $u_{j,n,t}^{\circ }=\sum _{l=-\infty }^{\infty }u_{j,n,t+lN}$
, where elements outside of the
 $L_{j}$
coefficients of
 $\boldsymbol{u}_{j,n}$
are zero. In practice,
 $\boldsymbol{u}_{j,n}$
with a length of
 $L_{j}<N$
is commonly used;
 $\boldsymbol{u}_{j,n}^{\circ }$
is then derived by appending
 $N-L_{j}$
number of zeros to
 $\boldsymbol{u}_{j,n}$
. Equation (A 4) can be easily converted to the matrix form of (2.2) using the transform matrix
 $\unicode[STIX]{x1D650}_{j,n}$
as
 $$\begin{eqnarray}\displaystyle \boldsymbol{w}_{j,n} & = & \displaystyle \left[\begin{array}{@{}c@{}}u_{j,n,(1-1)\;\text{mod}\;N}^{\circ },u_{j,n,(1-2)\;\text{mod}\;N}^{\circ },\ldots ,u_{j,n,(1-N)\;\text{mod}\;N}^{\circ }\\ \displaystyle u_{j,n,(2-1)\;\text{mod}\;N}^{\circ },u_{j,n,(2-2)\;\text{mod}\;N}^{\circ },\ldots ,u_{j,n,(2-N)\;\text{mod}\;N}^{\circ }\\ \displaystyle \vdots \\ \displaystyle u_{j,n,(N-1)\;\text{mod}\;N}^{\circ },u_{j,n,(N-2)\;\text{mod}\;N}^{\circ },\ldots ,u_{j,n,(N-N)\;\text{mod}\;N}^{\circ }\end{array}\right]\left[\begin{array}{@{}c@{}}x_{1}\\ \displaystyle x_{2}\\ \displaystyle \vdots \\ \displaystyle x_{N}\end{array}\right]\nonumber\\ \displaystyle & = & \displaystyle \unicode[STIX]{x1D650}_{j,n}\boldsymbol{x}.\end{eqnarray}$$
Note that there is a mixed use of indexing in this work: the wavelet scale
 $n$
starts with 0 and the rest of the notations start with 1. The former is consistent with wavelet transforms laid out by Percival & Walden (Reference Percival and Walden2000). The latter is in keeping with commonly used modal analyses summarised by Taira et al. (Reference Taira, Brunton, Dawson, Rowley, Colonius, McKeon, Schmidt, Gordeyev, Theofilis and Ukeiley2017). Besides conciseness and improved readability, the matrix-based formulations devised in this work can be more efficiently executed than the conventional pyramid algorithm, which inevitably involves nested for-loops.
A.3 Transfer function and squared gain
The transfer function of the composite wavelet filter
 $\boldsymbol{u}_{j,n}$
is defined as
 $$\begin{eqnarray}{\mathcal{T}}_{\boldsymbol{u}_{j,n}}(f)=\mathop{\sum }_{l=1}^{L_{j}}u_{j,n,l}\exp (-2\unicode[STIX]{x03C0}if(l-1))\end{eqnarray}$$
and its squared gain as first mentioned in § 2.2 is just
 $$\begin{eqnarray}{\mathcal{G}}_{\boldsymbol{u}_{j,n}}(f)=|{\mathcal{T}}_{\boldsymbol{u}_{j,n}}(f)|^{2}.\end{eqnarray}$$
which is periodic with a period of 1. Therefore only within
 $[0,1/2]$
of the gain is plotted in figure 1. For MODWPT, it can be shown that
 $$\begin{eqnarray}\mathop{\sum }_{n=0}^{2^{j}-1}{\mathcal{G}}_{\boldsymbol{u}_{j,n}}=1\end{eqnarray}$$
for any given decomposition level
 $j\geqslant 1$
(as implicitly shown in figure 1
a). This is the basis for both the energy and additive decompositions of
 $\boldsymbol{x}$
expressed by (2.3) and (2.7), respectively. From the definition of the wavelet detail
 $\boldsymbol{d}_{j,n}$
in (2.6), it can be regarded as circularly convolving
 $\boldsymbol{x}$
twice with
 $\boldsymbol{u}_{j,n}$
, i.e. applying a transfer function equivalent to
 ${\mathcal{G}}_{\boldsymbol{u}_{j,n}}$
on
 $\boldsymbol{x}$
. Therefore, the composite filter for obtaining
 $\boldsymbol{d}_{j,n}$
has a squared gain of
 ${\mathcal{G}}_{\boldsymbol{d}_{j,n}}={\mathcal{G}}_{\boldsymbol{u}_{j,n}}^{2}=|{\mathcal{T}}_{\boldsymbol{u}_{j,n}}(f)|^{4}$
. Similarly, the squared gain of the detail bundle
 $\boldsymbol{b}_{j,n_{0}}^{(k)}$
as used in figure 2 is then
 $$\begin{eqnarray}{\mathcal{G}}_{\boldsymbol{b}}=\left(\mathop{\sum }_{n=n_{0}}^{n_{k-1}}{\mathcal{G}}_{\boldsymbol{u}_{j,n}}\right)^{2}.\end{eqnarray}$$
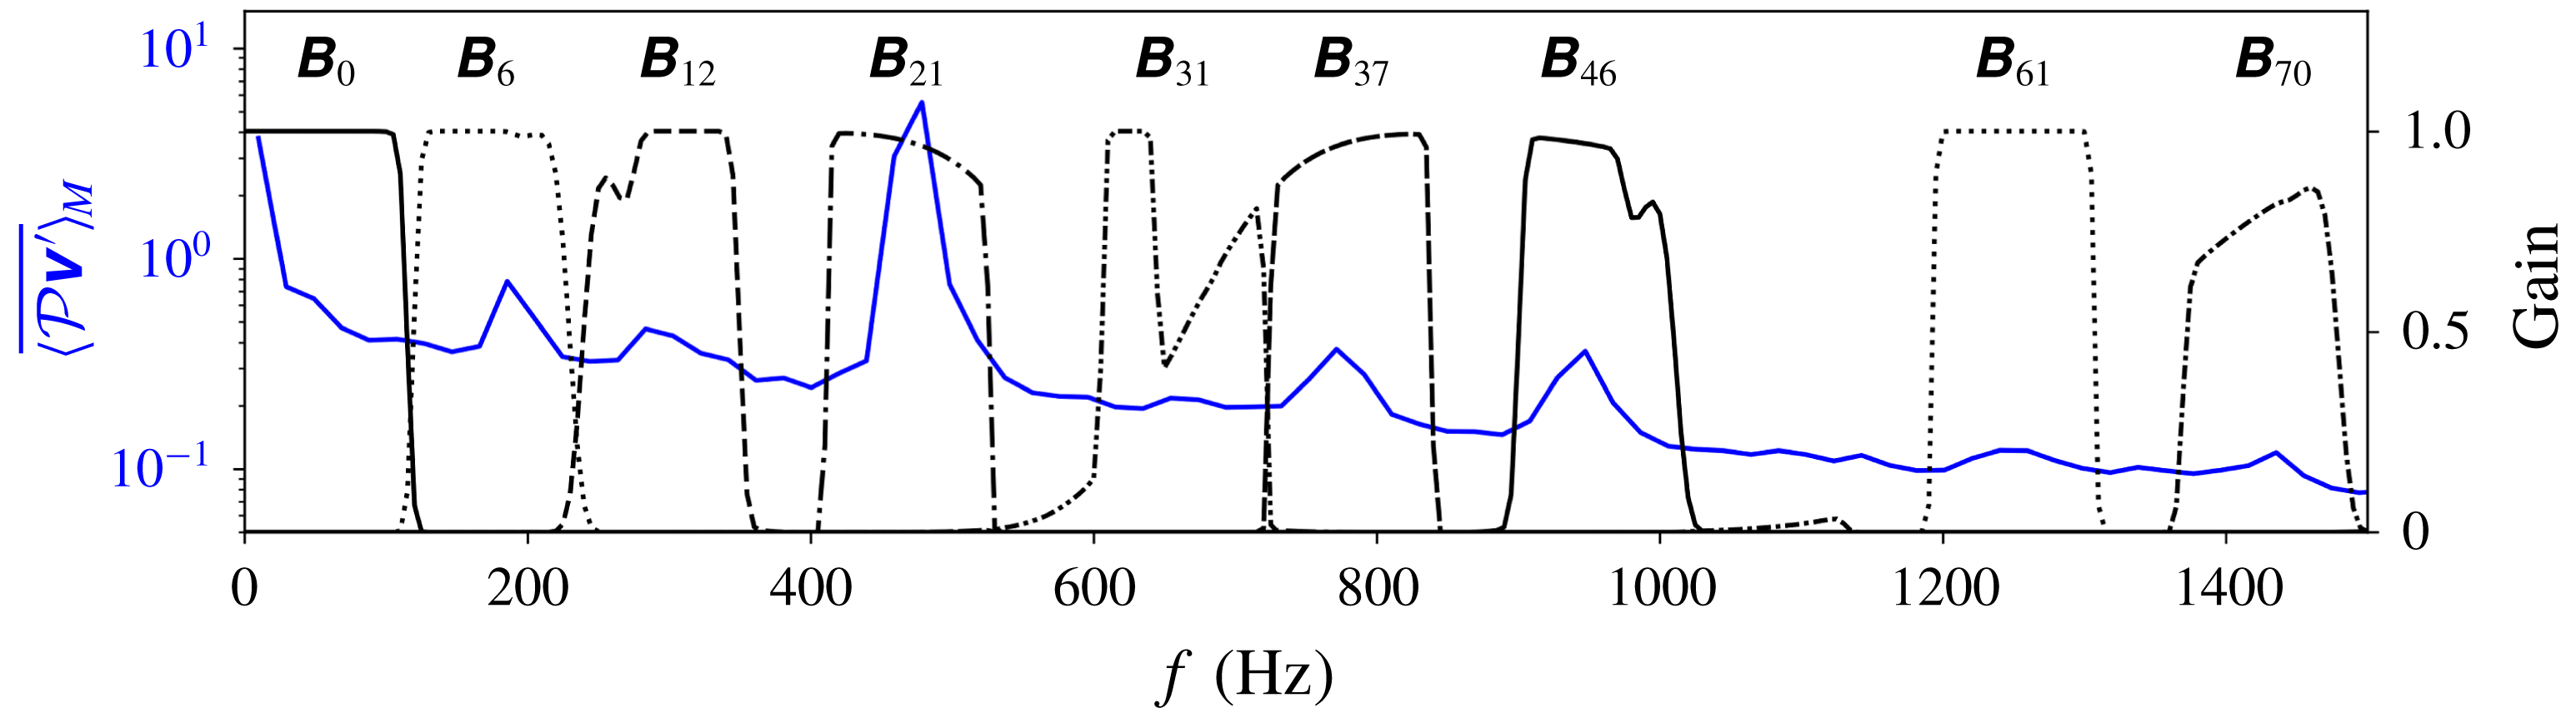
As mentioned in §§ 2.2 and 2.3, the scales (
 $n$
) from WPT usually have non-ideal bandpasses and sometimes highly irregular gain shapes. It is therefore important to examine them when designing the detail bundles. Figure 15 plots the gains of the detail bundles used in this work as summarised in table 1, calculated using (A 9). The power spectrum from figure 4(c) for Dataset no. 1 is also plotted in the background for reference. Detail bundles were first designed to capture and isolate the primary dynamics including the shift/switch modes (
 $\unicode[STIX]{x1D63D}_{0}$
), TA oscillations (
 $\unicode[STIX]{x1D63D}_{12}$
) and PVC (
 $\unicode[STIX]{x1D63D}_{21}$
and
 $\unicode[STIX]{x1D63D}_{46}$
). The rest were then constructed around them to minimise overlap. As can be seen, many of the detail bundles do not resemble ideal bandpasses, especially in the case of
 $\unicode[STIX]{x1D63D}_{31}$
and
 $\unicode[STIX]{x1D63D}_{70}$
with quite notable distortions. However, by comparing the MRPOD modes and those from normal POD as shown in figures 8 to 10, the dynamic components are adequately isolated and their amplitudes sufficiently captured.
Black lines: gain shapes of alternative detail bundles. Blue line: the power spectrum from figure 4(c) for Dataset no. 1.

If the influence of minor dynamics is subdued due to a short-lived M-flame such as in Dataset no. 2 (see figure 4), one could relax the criterion (i) of detail bundle design listed in § 3.3 to allow more than one dynamics in the detail bundles to achieve more uniform gains, as demonstrated in figure 16. However, due to the inclusion of multiple peaks, the extraction of individual dynamics from MRPOD may become non-trivial and require additional procedures for mode pair identification such as detailed in (Sieber et al. Reference Sieber, Paschereit and Oberleithner2016) and also employed in our previous work in Stöhr et al. (Reference Stöhr, Oberleithner, Sieber, Yin and Meier2018). Nevertheless, this demonstrates the flexibility of constructing detail bundles especially for other applications where the dynamic components are naturally sparse in the spectral domain.
Note that since WPT results in an rigid even division of the spectral domain, the possibilities for constructing detail bundles are not unlimited. In case a higher customisability of the bandpasses is required, one could use standard finite impulse response (FIR) filters to implement MRA and MRPOD in a manner similar to the WPT-based MRPOD employed in this work. This alternative approach is discussed in detail in appendix D. A python implementation of the MRPOD method presented in this work will be hosted and maintained on Github with the project name of mrpod.
A.4 Wavelet filter and noise rejection
Influence of wavelets and broadband noise on MODWPT-based reconstructions: (a) a time series
 $\boldsymbol{x}$
is synthesised to be composed of a damping wave
 $\boldsymbol{x}_{1}$
and broadband noise; (b) the power density spectra of the corresponding
 $\boldsymbol{x}$
,
 $\boldsymbol{x}_{1}$
and noise; (c) the scaling functions of LA(32) and D(32) used for reconstruction; (d) comparisons between reconstructed and the original
 $\boldsymbol{x}_{1}$
.

Although a short wavelet (e.g. up to eight coefficients) may introduce artefacts into the reconstructed signal with DWT or DWPT, as discussed in Percival & Walden (Reference Percival and Walden2000), the choice of wavelet becomes much less critical with the combination of a long wavelet (e.g. more than 20 coefficients) and MODWPT (due to no downsampling). To demonstrate this, the effectiveness of LA(32) was compared with a standard Daubechies D(32) of the same length on a noise-laden synthesised time series
 $\boldsymbol{x}=\boldsymbol{x}_{1}+\text{noise}$
. Figure 17(a) plots from top to bottom
 $\boldsymbol{x}$
and its main component
 $\boldsymbol{x}_{1}$
, a damping wave with the same characteristic frequency of PVC at 469 Hz and the broadband noise. Note that the synthesised time series has the same sample size (8000) as the dataset in this work. Only a segment is shown here for readability. As can be seen, the signal-to-noise (S/N) ratio (with regard to
 $\boldsymbol{x}_{1}$
) is approximately
 $2:1$
at the beginning of this time segment, drops to
 $1:1$
and
 $1:2$
in the middle and eventually becomes 0 towards the end. The power spectral density of these components is shown in figure 17(b). In order to extract
 $\boldsymbol{x}_{1}$
from the noisy
 $\boldsymbol{x}$
, the same detail bundle used for PVC in this work, i.e.
 $\boldsymbol{b}_{8,21}^{(6)}$
, was constructed with either the LA(32) or the D(32) wavelet, whose coefficients (scaling function
 $\boldsymbol{g}$
) are plotted in figure 17(c). While LA(32) is relatively symmetric with respect to the mid-length, D(32) is asymmetric with most of its non-zero elements in the second half of the wavelet filter. From the results shown in figure 17(d), it is clear that there is virtually no difference between LA(32) and D(32). The same was observed with other wavelet filters of similar length. In terms of noise rejection,
 $\boldsymbol{x}_{1}$
could be nearly perfectly reconstructed even at low S/N locations, except for the period after 0.34 s where the
 $\boldsymbol{x}_{1}$
diminishes to zero. This is due to the fact that the bandpass-like filtering effect from MODWPT does not naturally distinguish between physical and non-physical components in the signal. However, quite a significant amount of noise out of the bandpass is still suppressed. This would be further improved with MRPOD, as POD generates energy-ranked modes, which can work effectively against random noise in the dataset. This is also demonstrated in the POD of
 $\unicode[STIX]{x1D63D}_{21}$
shown in figure 8, where the two PVC modes correspond to approximately 90 % of the total kinetic energy, the rest (non-physical modes) are noise that occurs within the same bandwidth of
 $\unicode[STIX]{x1D63D}_{21}$
.
A.5 Boundary conditions
Influence of boundary conditions on MODWPT-based reconstructions: (a,b) comparison between synthesised time series
 $\boldsymbol{z}$
and its detail bundle
 $\boldsymbol{b}_{8,0}^{(6)}$
computed using the default circular boundary condition; (c,d) same comparison but with
 $\boldsymbol{b}_{8,0}^{(6)}$
computed using the reflection boundary condition; (e) the effect of reflection boundary condition on the temporal coefficients plotted in figure 12(a). Solid and dashed lines are the coefficients derived from circular and reflection boundary conditions, respectively.

The circular filtering during wavelet transform essentially expands the time series into a periodic sequence with a period of its length
 $N$
. Such circularity assumption inevitably influences the boundary regions of the wavelet coefficients and details, especially if the beginning of the time series deviates significantly from the end. This is demonstrated in figure 18(a) by comparing a time series
 $\boldsymbol{z}$
with its detail bundle
 $\boldsymbol{b}_{8,0}^{(6)}$
that encloses the frequency feature used to synthesise
 $\boldsymbol{z}$
. Their absolute difference
 $|\unicode[STIX]{x1D6E5}|=|\boldsymbol{z}-\boldsymbol{b}_{8,0}^{(6)}|$
is shown underneath in figure 18(b). The length of
 $\boldsymbol{z}$
is chosen to be 8000, the same as the data series from the measurement presented in § 3. It is also generated to deliberately start and end with substantially unequal values such that a direct circular expansion would not be appropriate. This is reflected in the up to 50 % error in the reconstruction using the default circular boundary condition. Such issue can be largely lessened by imposing a reflection boundary condition on the time series before applying a wavelet transform, i.e. by extending the time series using its own reflection along the time axis, such that the resulting new series has a length of
 $2N$
and starts and ends on the exact same value. The reconstructed wavelet detail bundle can then be truncated back to the length of
 $N$
. The results of implementing a reflection boundary condition on the same time series
 $\boldsymbol{z}$
are plotted in figure 18(c,d), showing significant reduction of reconstruction errors near the beginning and the end of the time series.
For the experimental data series examined in § 3, since they start and end either in V- or M-flame as evident from figure 4, the circularity assumption is expected to hold well. Figure 18(e) compares the temporal coefficients of the first two POD modes of
 $\unicode[STIX]{x1D63D}_{0}$
shown in figure 12(a) derived from the default circular boundary condition (solid lines) to the ones with a reflection boundary condition (dashed lines). As can be seen, only the first and last 100 or so data points are slightly affected by the circularity assumption. As a result, a reflection boundary condition is not implemented in the analysis presented in § 3 due to its substantially higher computational cost.
It should be pointed out that the influence of the boundary conditions is determined by the wavelet size
 $L$
and the decomposition level
 $j$
. A commonly adopted conservative measure is to keep the maximum decomposition level
 $j_{\text{max}}$
below
 $\ln [N/(L-1)+1]$
, such that at least one wavelet coefficient at
 $j$
is not affected by the boundary conditions. However, with the introduction of the detail bundles in this work, the effective decomposition level is much lower than the initial
 $j$
, resulting in a rather limited influence from the boundary conditions on the reconstructed data series.
A.6 Computational cost
As noted in § 2.4, the proposed MODWPT-based modal analysis was programmed entirely in Python to take advantage of the large library of matrix operations offered in the Numpy package. Other than directly importing wavelet filters (
 $\boldsymbol{g}$
) available via the Pywavelet package, one could design and supply custom wavelets as well. For the construction of detail bundles, in order to further speed up execution, the program allows admission of varying decompositions
 $j$
and scales
 $n$
, such that a detail bundle at
 $j=8$
could be more efficiently computed using the parent scales of corresponding lower levels (e.g.
 $j=6$
and
 $j=7$
). The majority of the CPU time was taken to construct the transform operator
 $\unicode[STIX]{x1D739}\unicode[STIX]{x1D64F}$
(Step 5 in the Algorithm provided in § 2.5) by calling wavelet filters (
 $\boldsymbol{u}$
) of the target scales from a library of composite filters. Since both the composite filters and the transform operators are universal and data independent, they could be shared among datasets with the same sample size, as is the case in this work. A breakdown of the computational cost for the datasets of the sample size of
 $8000\times 11\,352$
from the bistable flow field on a Dell Precision Tower 3620 (Win7 64bit, Intel Core i7-6700 @ 3.4 GHz, 8 GB RAM) is provided in table 2.
Breakdown of computational cost involved in MODWPT of datasets with a sample size of
 $8000\times 11\,352$
on a Dell Precision Tower 3620 (Win7 64bit, Intel Core i7-6700 @ 3.4 GHz, 8 GB RAM). Loading data from and saving results on hard disks are excluded.

The time to construct the transform operator scales with the number of scales (
 $n$
) involved. For
 $\unicode[STIX]{x1D63D}_{0}$
,
 $\unicode[STIX]{x1D63D}_{6}$
,
 $\unicode[STIX]{x1D63D}_{12}$
,
 $\unicode[STIX]{x1D63D}_{46}$
and
 $\unicode[STIX]{x1D63D}_{70}$
, two scales from
 $j=6$
and 7 were used instead of the equivalent six scales at
 $j=8$
. For
 $\unicode[STIX]{x1D63D}_{31}$
, three scales were needed from
 $j=6$
and 8. For
 $\unicode[STIX]{x1D63D}_{21}$
,
 $\unicode[STIX]{x1D63D}_{37}$
and
 $\unicode[STIX]{x1D63D}_{61}$
, however, at least four scales from
 $j=7$
and 8 were required. As can be seen, it took a total of 162.7 s to construct the library of composite filters (
 $\boldsymbol{u}$
) and the transform operators for all the nine detail bundles listed in table 1, which needed only to be calculated once and were used for all the datasets presented in this work. The CPU time required for the actual computation of a detail bundle was 8.2 s (basic matrix multiplication). When averaged over all four datasets that were analysed for this work, the effective cost per detail bundle came to approximately 12.7 s, amounting to approximately 10 % additional computational time compared to conventional POD. On the other hand, due to the large sample size (8000), Step 6b of directly filtering the
 $8000\times 8000$
cross-correlation matrix is not computationally efficient on the same PC. However, with reducing sample size, this method would become more efficient than Step 6a from the MRPOD Algorithm provided in § 2.5. Note also that CPU time could be further reduced if parallel computing is explicitly enforced for constructing the library of
 $\boldsymbol{u}$
and analysing different datasets.
Appendix B. MRPOD modes of other datasets
When comparing the spatial POD modes of
 $\unicode[STIX]{x1D651}^{\prime }$
and
 $\unicode[STIX]{x1D63D}_{21}$
for Dataset no. 1 in figure 8, it is clear that conventional POD can already extract fairly well the coherent helical structures in spite of the interference from other dynamics (namely PVC-TA and PVC
 $+$
TA). This is mainly attributed to the fact that Dataset no. 1 contains long lasting M-flame periods and thus PVC. This is however not the case with a data series containing only a short-lived M-flame, such as Dataset no. 2.
PVC modes extracted from
 $\unicode[STIX]{x1D651}^{\prime }$
and
 $\unicode[STIX]{x1D63D}_{21}$
from Dataset no. 2, with columns: (a) spatial modes; (b) PSD and (c) phase portraits of the temporal coefficients.

Shift and switch modes from Datasets no. 2–4, with columns: (a) spatial modes; (b) PSD; and (c) phase portraits of the temporal coefficients.

Figure 19 compares the PVC modes extracted from POD of
 $\unicode[STIX]{x1D651}^{\prime }$
and
 $\unicode[STIX]{x1D63D}_{21}$
from Dataset no. 1 with less than 0.1 s (1000 frames) of M-flame period (see figures 4 and 12). When all the 8000 frames of the data series were included in the analysis, conventional POD does a poor job of extracting coherent spatial and temporal modes of PVC, as shown in figure 19. On the other hand, MRPOD from
 $\unicode[STIX]{x1D63D}_{21}$
demonstrates remarkable coherence, consistent with the case in figure 8, where the M-flame period lasts for a total of almost 0.4 s (4000 frames). By comparing the PSD of temporal coefficients shown in figure 19(b) and those in figure 8(b) for
 $\unicode[STIX]{x1D651}^{\prime }$
, it is clear that POD does not always lump the same dynamics into a single mode. On the other hand for MRPOD, by imposing a well-defined bandpass, it guarantees consistency and comparability when analysing different data series taken in the same turbulent flow system.
In order to show that MRPOD can also perform well for non-periodic dynamics independent of the temporal compositions (V- and M-flame durations) of the datasets, shift and switch modes were calculated from
 $\unicode[STIX]{x1D63D}_{21}$
of Datasets no. 2–4. The results are shown in figure 20. When compared with those from Dataset no. 1 in figure 10, both the spatial modes and their temporal coefficients exhibit highly consistent structures despite the differences in the compositions of V- and M-flame periods in these datasets: (i) the switch mode
 $\unicode[STIX]{x1D753}_{2}$
compensates the shift mode
 $\unicode[STIX]{x1D753}_{1}$
by exerting a strong influence on the backflow in the IRZ that extends to the inlet; (ii) larger fluctuations in
 $\boldsymbol{a}_{2}$
during V-flame (except for Dataset no. 4, which contains almost no stabilised periods of V-flame), (iii) transient coupling between the shift and switch modes reflected as ‘bridges’ in the phase portrait between V- and M-flame periods (i.e. green and blue islands of coefficients, respectively).
Appendix C. DWPT-based MRPOD
The classical DWPT is an orthonormal transform that is closely associated with MODWPT. Its wavelet coefficient
 $\hat{\boldsymbol{w}}_{j,n}$
can be derived by downsampling and rescaling the MODWPT coefficient
 $\boldsymbol{w}_{j,n}$
as
 $$\begin{eqnarray}{\hat{w}}_{j,n,t}=2^{j/2}w_{j,n,2^{j}(t+1)-1},\quad t=1,2,\ldots ,N/2^{j}.\end{eqnarray}$$
Analogous to (A 4), the wavelet coefficients could also be calculated directly from periodised composite wavelet filters
 $\hat{\boldsymbol{u}}_{j,n}^{\circ }$
(
 $=2^{j/2}\boldsymbol{u}_{j,n}^{\circ }$
, i.e. rescaling the composite filter used for MODWPT),
 $$\begin{eqnarray}{\hat{w}}_{j,n,t}=\mathop{\sum }_{l=1}^{N}\hat{u} _{j,n,[2^{j}(t+1)-1-l]\;\text{mod}\;N}^{\circ }x_{l},\quad t=1,2,\ldots ,N/2^{j}.\end{eqnarray}$$
Similar to (A 5), the transform matrix for DWPT
 $\hat{\unicode[STIX]{x1D650}}_{j,n}\in \mathbb{R}^{2^{j}\times N}$
could then be derived. The matrix operations outlined in §§ 2.4 and 2.5 can be used to obtain detail bundles as well as conducting multiresolution POD based on DWPT.
On one hand, as an orthonormal transform, the wavelet coefficients and details of DWPT are orthogonal to one another,
 $$\begin{eqnarray}\hat{\boldsymbol{d}}_{j,n}^{\text{T}}\hat{\boldsymbol{d}}_{j,m}=\left\{\begin{array}{@{}ll@{}}\hat{\boldsymbol{w}}_{j,n}^{\text{T}}\hat{\boldsymbol{w}}_{j,n}, & n=m,\\ 0, & \text{otherwise}.\end{array}\right.\end{eqnarray}$$
By extension, the detail bundles derived based on DWPT are also orthogonal to one another, as long as they do not contain the same scale
 $n$
. In combination with MRPOD, this offers the possibility of constructing an optimal basis of POD modes for a data series that are ranked by both their kinetic energy and their dynamic relevance. On the other hand, since the wavelet details are essentially obtained by upsampling the wavelet coefficients in the case of DWPT, they do not benefit from the zero-phase filter and the better bandpass as in the case of MODWPT (see the discussions in § 2.2 and appendix A).
PVC modes from
 $\unicode[STIX]{x1D63D}_{21}$
computed based on DWPT with the same
 $j$
,
 $n$
and wavelet filter as in the case of MODWPT-based MRPOD shown in figure 8, for the same Dataset no. 1.

Figure 21 reproduces the PVC modes captured by
 $\unicode[STIX]{x1D63D}_{21}$
in figure 8 for the same Dataset no. 1 but with DWPT-based MRPOD. The same
 $j=8$
and group of
 $n$
(from 21 to 26) as well as the same wavelet LA(32) are used for constructing the wavelet bundle. The data series were padded to a length of 8192 with equal number (96) of zeros at the beginning and end. The results were then truncated to the original length of 8000. From the PSD, the wavelet bundle does not completely isolate the PVC feature but rather includes the peak corresponding to PVC
 $+$
TA as well, due to the leakage issue in the gain of the composite wavelet filter discussed in § 2.2. This interference also ‘smudges’ the phase portrait. When compared with the phase portrait obtained by MODWPT in figure 8, the PVC appears much less coherent temporally during M-flame and the cascading transition periods observable in figure 8 also become unclear. Similar issues were present with other detail bundles constructed based on DWPT. MODWPT is thus undoubtedly superior with regard to spectral purity, which was one of the fundamental prerequisites outlined at the inception of this work.
It should be pointed out that WPT-based MRPOD should be tailored based on the target of interest. If coexisting dynamics are not closely packed in the spectral domain, as in the case of the bistable flame, DWPT could turn out equally suitable for carrying out the decomposition and reconstruction of the data series, with added bonuses such as orthogonality among non-overlapping wavelet bundles and a notable reduction of computational cost (due to downsampling).
Appendix D. MRA based on FIR filters
In this work, the wavelet basis for an MRA was chosen mainly for the following reasons:
(i) The standard wavelets have shown remarkable effectiveness in capturing intermittencies in turbulent flows (Ruppert-Felsot et al. Reference Ruppert-Felsot, Farge and Petitjeans2009; Indrusiak & Möller Reference Indrusiak and Möller2011; Rinoshika & Omori Reference Rinoshika and Omori2011; Mancinelli et al. Reference Mancinelli, Pagliaroli, Di Marco, Camussi and Castelain2017; Kim et al. Reference Kim, Bassenne, Towery, Hamlington, Poludnenko and Urzay2018).
(ii) A large library of wavelet filters (as well as methods) are easily accessible via either the Wavelet toolbox in Matlab or Pywavelet in Python.
Despite its relative ease of use, as mentioned in § A.3, wavelet basis only allows a rigid frequency splitting and the constructed subbands may deviate significantly from an ideal bandpass. As an alternative, one could use a combined FIR-filter/window approach to achieve a generalised and highly customisable MRA (Mendez et al. Reference Mendez, Balabane and Buchlin2019), which could potentially benefit the analysis of certain turbulent flows by offering a flexible frequency splitting and a superior bandpass behaviour.
Performance comparison between FIR-based bandpass filters and MODWPT detail bundles: (a) a time series
 $\boldsymbol{x}$
is synthesised to be composed of a low-frequency non-periodic dynamics
 $\boldsymbol{x}_{0}$
, an intermittent coherent dynamics
 $\boldsymbol{x}_{1}$
and broadband noise; (b) the power density spectra of the corresponding
 $\boldsymbol{x}$
,
 $\boldsymbol{x}_{0}$
,
 $\boldsymbol{x}_{1}$
and noise; (c) reconstructions of
 $\boldsymbol{x}_{0}$
and
 $\boldsymbol{x}_{1}$
.

Without rigorously carrying out filter designs to divvy up the entire resolvable spectrum for a full MRA, two bandpass filters were constructed to compare with the detail bundles for isolating the slow-varying shift mode and the PVC. The results are shown in figure 22. A time series
 $\boldsymbol{x}$
shown in column (a) is synthesised to consist of two major components
 $\boldsymbol{x}_{0}$
and
 $\boldsymbol{x}_{1}$
that mimic the shift mode and PVC respectively as well as a broadband noise to emulate turbulent noise. Their corresponding PSDs are shown in column (b) for reference. The detail bundles
 $\boldsymbol{b}_{0}$
(short for
 $\boldsymbol{b}_{8,0}^{(6)}$
) and
 $\boldsymbol{b}_{21}$
(short for
 $\boldsymbol{b}_{8,21}^{(6)}$
) used in this work for extracting the shift mode and PVC were applied to
 $\boldsymbol{x}$
to extract
 $\boldsymbol{x}_{0}$
and
 $\boldsymbol{x}_{1}$
. The gain shapes of the two detail bundles are shown as red solid lines on top of the PSD of
 $\boldsymbol{x}$
in figure 22(b). The FIR bandpass filters were designed using the firwin function of the Signal module from the popular Scipy package to match as closely as possible the gains of the detail bundles by varying the lengths of filters. In order to cancel phase delays and align the temporal features (as automatically achieved in MODWPT), the FIR bandpass filters were applied twice to forward and backward filter the time series (using the filtfilt in the Signal module). As can be seen, both detail bundles and bandpass filters capture well the temporal features of
 $\boldsymbol{x}_{0}$
and
 $\boldsymbol{x}_{1}$
, in a nearly identical manner.
Note that the computational cost of constructing either of the above FIR subbands for the whole dataset of
 $8000\times 11\,352$
ran up to 80 s, which is of the same order as that of detail bundles and can be further reduced by lowering the order of the filters given that the spectral overlap with adjacent subbands is acceptably small. For the analyses in this work, although FIR bandpass filters would likely outperform
 $\unicode[STIX]{x1D63D}_{31}$
(containing a minor dynamic component), MODWPT-based MRA has proven adequate for handling most of the dynamic components of interest and is not expected to hinder their modal interpretation.


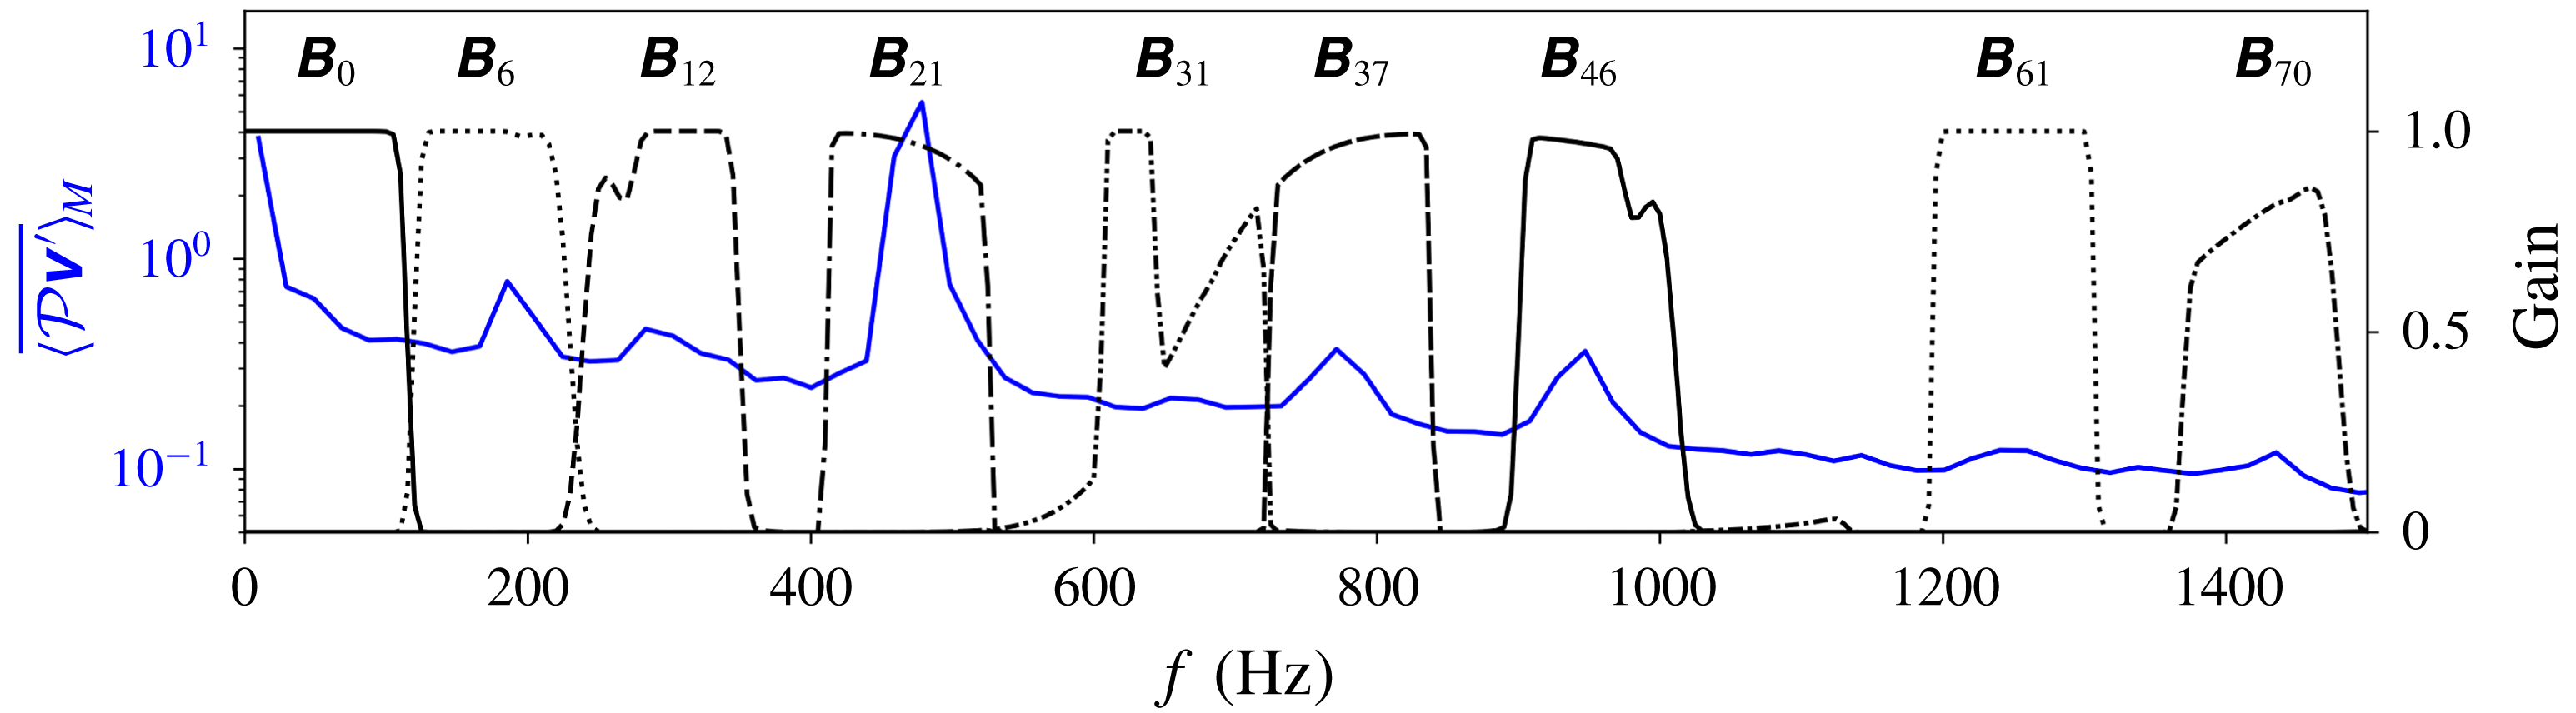


 Open access

