Introduction
Mechanical properties of nanolayered metals have been widely investigated in the past two decades. The outstanding strength [Reference Mara, Bhattacharyya, Dickerson, Hoagland and Misra1], thermal stability [Reference Misra, Hoagland and Kung2], and radiation resistance [Reference Demkowicz, Hoagland and Hirth3] of these structures make them promising engineering materials. In addition, metallic nanolayers provide a controlled and systematic approach to probing the mechanical behavior of materials and interfaces at the nanoscale [Reference Wang, Zhou, Shao and Misra4]. In particular, nanolayers prepared by physical vapor deposition enables the precise control of layer thicknesses and provide a sharp interface to study size effects and interface-dominated plastic behavior [Reference Li, Wang, Misra and Huang5].
Earlier studies in the field have focused on crystalline/crystalline nanolayers (will be referred to as C/C nanolayers). The strength of C/C nanolayers is usually much higher than the strength of their constituents. This high strength and its increase with decreasing layer thickness can be explained by the Hall–Petch behavior for layer thicknesses down to ∼100 nm. For thinner layers, dislocation pile-up is no longer the dominant phenomenon, and the strengthening trend deviates from the Hall–Petch behavior. In this regime, the strength can be modeled by confined layer slip [Reference Phillips, Clemens and Nix6], by taking into account some additional factors such as interface stress and dislocation core spread [Reference Misra, Hirth and Hoagland7].
The concept of nanolayered metals has recently been applied to amorphous/crystalline (A/C) nanolayers, where one of the constituent layers is a metallic glass. Outstanding ductility can be achieved in A/C nanolayers by using metallic glass constituents that are brittle in the bulk form [Reference Wang, Li, Hamza and Barbee8, Reference Liu, Du, Lin, Pei and Huang9]. The presence of crystalline layers effectively hinders the catastrophic propagation of shear bands in the amorphous layers and prevent brittle failure, especially when the layer thickness is comparable to the length scale necessary for shear localization [Reference Wang, Li, Hamza and Barbee8]. Compatibility of the flow strengths of the amorphous and the crystalline layers was shown to promote co-deformation, which also improves the ductility of the nanocomposite [Reference Liu, Du, Lin, Pei and Huang9, Reference Liu, Huang, Chou, Lai, Lee and Nieh10].
The strength of A/C nanolayers tends to lie in between those of their constituents, and an increase in strength with decreasing layer thickness is a common observation [Reference Zhang, Liu, Chen, Chen, Liu, Zhang and Sun11, Reference Fan, Xue, Wang, Yu, Wang and Zhang12]. In most studies, the flow stress of the crystalline layer is lower than that of the metallic glass layer, and as a result, the strength and size effects are dominated by the response of the crystalline layers. Interestingly, application of the modified confined layer slip model [Reference Phillips, Clemens and Nix6] to the softer crystalline layers predicts the strength of these composites well [Reference Zhang, Liu, Chen, Chen, Liu, Zhang and Sun11]. So far, the studies about the size effects in A/C nanolayers have focused on systems formed by FCC crystalline layers and a harder amorphous layer [Reference Zhang, Liu, Chen, Chen, Liu, Zhang and Sun11, Reference Fan, Xue, Wang, Yu, Wang and Zhang12, Reference Guo, Jägle, Yao, Maier, Korte-Kerzel, Schneider and Raabe13]. However, there has been no study to date investigating the size effect of amorphous/HCP crystalline nanolayers (A/HCP). Recent studies in C/C nanolayers with HCP/BCC configuration have demonstrated that the geometric strengthening due to the limited number of slip planes in HCP can result in anomalous strengthening [Reference Ham and Zhang14, Reference Callisti and Polcar15]. Therefore, A/HCP nanolayers can serve as an effective model system to gain further insight into the mechanical behavior of metallic glasses and HCP metals in confined geometries.
In this work, we experimentally investigated the structure–property relationships in CuZr/Zr and CuTi/Ti A/HCP nanolayers. CuTi/Cu A/FCC nanolayers were also considered for comparison purposes. The microstructural investigations combined with nanoindentation hardness provided insight into the size-independent strength of A/HCP nanocomposites, and the results were interpreted by utilizing the modified confined layer slip model.
Results
Microstructure
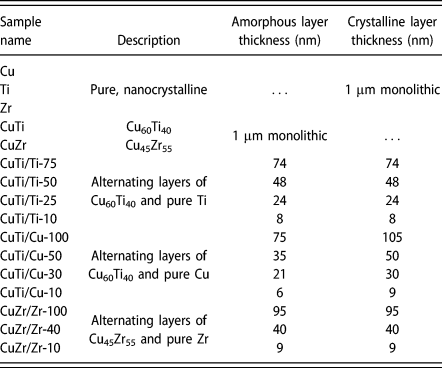
We prepared thin film samples of pure metal, metallic glass, and A/C nanolayered composites. Pure metal samples were Zr and Ti films, and monolithic metallic glass samples had a composition of Cu60Ti40 and Cu45Zr55. Three different types of nanolayered A/C composites were prepared, namely, Cu60Ti40/Ti, Cu60Ti40/Cu, and Cu45Zr55/Zr. A series of samples with different layer thicknesses in the range 10–100 nm were deposited for each case. We refer to the monolithic metallic glass samples as CuTi and CuZr and nanolayered samples as CuTi/Ti-X, CuTi/Cu-X, and CuZr/Zr-X where X denotes the nominal thickness of the crystalline layers in nanometers. Table I shows a list of samples prepared and their naming convention together with the measured average layer thicknesses for each case.
List of the samples prepared for this study. Naming convention uses the nominal layer thickness of the crystalline layers. Actual layer thicknesses were measured by TEM and/or SEM cross-sections.

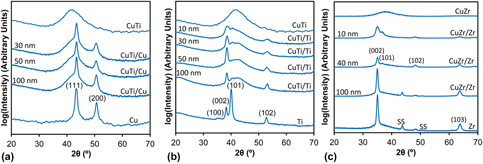
Figure 1 shows the X-ray diffraction (XRD) results of all samples. Pure Cu and Ti exhibit several sharp peaks indicating their polycrystalline structure. XRD patterns of the CuTi and CuZr monolithic films show wide humps that are characteristic of a fully amorphous structure. All nanolayered films show a combination of the amorphous humps and sharp peaks as a result of the reflections from crystalline and amorphous layers combined. However, the XRD patterns of the nanolayered samples are not a direct superposition of the pure metal and metallic glass patterns, indicating that confinement in a layered geometry changes the grain morphology and texture.
XRD data of (a) CuTi/Cu, (b) CuTi/Ti, and (c) CuZr/Zr [Reference Abboud, Motallebzadeh, Verma and Özerinç21] nanolayers, and those of monolithic metallic glasses and pure metals. Layer thicknesses of nanolayered samples are indicated on the left of the spectra. SS refers to the stainless steel substrate for the case of CuZr/Zr.

Figure 1(a) compares the CuTi/Cu nanolayers with pure crystalline Cu and CuTi metallic glass. Pure Cu shows strong reflections from (111) and (200). The (111) peak has a much higher intensity, and comparing the relative intensities with those of powder diffraction data (ICDD PDF Card No. 004-0836 [Reference Kabekkodu16]) suggests that there exists a (111) texture. The same Cu peaks are present in the patterns of CuTi/Cu, suggesting that Cu confined in the layered geometry also exhibits a similar texture. On the other hand, the peaks widen with decreasing layer thickness, suggesting grain refinement.
Figure 1(b) presents the corresponding data for the CuTi/Ti nanolayers and pure Ti. The XRD pattern of Ti indicates an HCP structure, with reflections from (101), (002), and (102) in the order of decreasing intensity. The pattern resembles that of powder diffraction (ICDD PDF Card No. 044-1294 [Reference Kabekkodu16]), suggesting that the grain orientations are random to a great extent. However, when it comes to nanolayered CuTi/Ti, the (101) peak almost disappears, and the (002) and (102) peaks dominate. This dramatic change in the XRD pattern indicates that the confinement of Ti in a layered geometry promotes a strong texture, with the basal planes of the HCP crystals becoming mostly aligned with the interface. When the layer thickness changes from 100 to 50 nm, the (002) intensity increases, suggesting an increase in the texture. However, with a further decrease in the layer thickness, the (002) intensity starts to decrease, and the (101) peak appears again with a relatively low intensity, suggesting that the texture becomes relatively weaker. Ti has been reported to exhibit an FCC structure in the thin film form [Reference Chakraborty, Kumar, Ranjan, Chowdhury and Singh17], especially when confined in between other FCC elemental layers [Reference Van Heerden, Josell and Shechtman18, Reference Banerjee, Dregia and Fraser19]. However, we did not observe any FCC Ti in our samples, as verified by XRD (also see TEM results discussed later). Banerjee et al. [Reference Banerjee, Dregia and Fraser19] observed an FCC structure only for layer thicknesses below 2 nm, which suggests that our layers are too thick to observe this phenomenon.
Figure 1(c) shows the results for the CuZr and CuZr/Zr samples. (002) exhibits the highest intensity in the CuZr/Zr, showing that the preferred texture in Zr is similar to that of Ti in the CuTi/Ti samples. The (002) and (103) reflections become stronger with increasing layer thickness accompanied by a decrease in the intensity of (101). These trends indicate that the (002) texture is relatively stronger for the 100 nm layers when compared to the 10 nm layers.
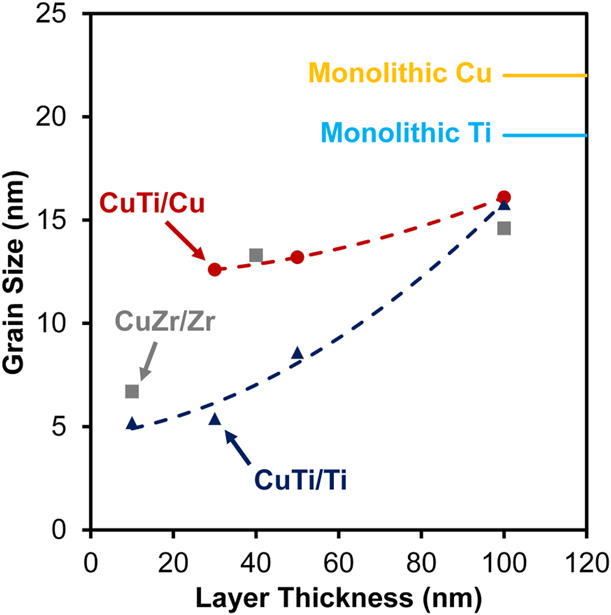
Figure 2 shows the estimated grain sizes for all samples. The calculations utilized Scherrer equation based on the (111) peaks of Cu and (002) peaks of Ti and Zr. Grain sizes are the largest for the monolithic pure films and monotonically decrease with decreasing layer thickness, which is a trend commonly encountered in magnetron-sputtered layered films [Reference Callisti and Polcar15].
Grain sizes estimated from the Scherrer equation using the (111), (002), and (002) peaks for Cu, Ti, and Zr layers, respectively. Solid lines indicate the grain sizes of the monolithic pure films. Grain sizes are the largest for monolithic films and monotonically decrease with decreasing layer thickness.
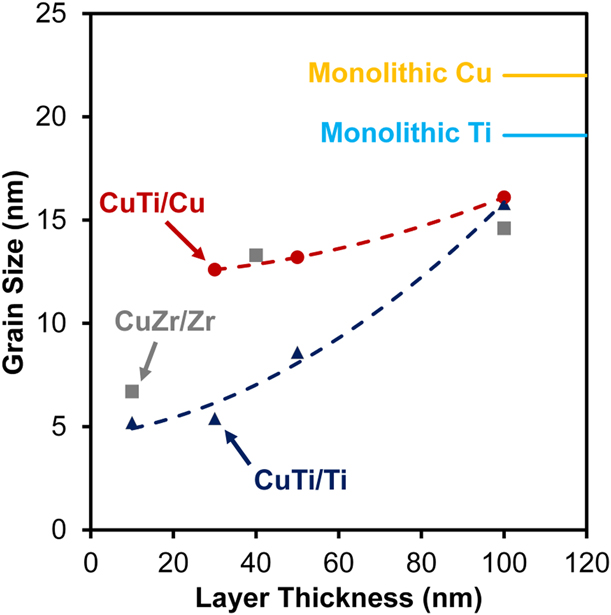
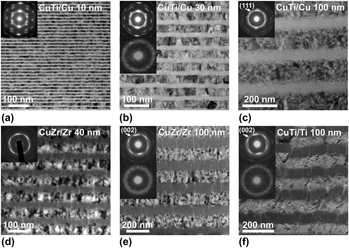
Figure 3 shows the bright field TEM images of selected samples. Figures 3(a)–3(c) show CuTi/Cu samples with nominal layer thicknesses of 10, 30, and 100 nm. The crystalline layers exhibit a columnar grain growth commonly encountered in sputtered films [Reference Özerinç, Tai, Vo, Bellon, Averback and King20]. The diffraction patterns shown in the top insets are from multiple layers and indicate a (111) texture perpendicular to interfaces. The crystalline and amorphous layer thicknesses are not the same, and CuTi layers possess a thickness that is ∼70% of those of the crystalline layers. As we will discuss in the subsequent sections, the plasticity is dominated by the crystalline layers for these samples, and we refer to these samples by the thickness of their respective crystalline layers.
Bright field cross-sectional TEM images of (a) CuTi/Cu-10, (b) CuTi/Cu-30, (c) CuTi/Cu-100, (d) CuZr/Zr-40 [Reference Abboud, Motallebzadeh, Verma and Özerinç21], (e) CuZr/Zr-100 [Reference Abboud, Motallebzadeh, Verma and Özerinç21], and (f) CuTi/Ti-100. The insets on the top left corners show diffraction patterns taken from a region including multiple layers. The second insets below are nanodiffraction patterns corresponding to the respective amorphous layers.

Figures 3(d) and 3(e) show CuZr/Zr-40 and CuZr/Zr-100, with alternating layers of nanocrystalline Zr and amorphous CuZr [Reference Abboud, Motallebzadeh, Verma and Özerinç21]. Similar to the CuTi/Cu, columnar grain growth is observed. The top insets show diffraction patterns from areas that include multiple layers and indicate that there exists a texture with the [001] direction being perpendicular to the layers. The results are in agreement with the XRD patterns, where (002) reflections were pronounced.
Figure 3(f) shows the cross-section of the CuTi/Ti-100 sample with a more pronounced waviness. The waviness is a consequence of the less uniform growth of the crystalline Ti layers, where a small roughness introduced at a layer propagates to subsequent layers and gets amplified with an increasing number of layers. Such waviness is occasionally encountered in magnetron-sputtered nanolayers [Reference Callisti and Polcar15]. While such morphology can potentially affect the results of micropillar compression experiments [Reference Guo, Jägle, Yao, Maier, Korte-Kerzel, Schneider and Raabe13] and interfacial shear strength measurements [Reference Mao, Özerinç, King, Averback and Dillon22], it is less likely to alter the nanoindentation hardness response, which induces a complicated stress state below the indenter. Previous studies show that the deformation of such wavy layers can be successfully modeled by the modified confined layer slip [Reference Callisti and Polcar15].
The second insets below the composite diffraction patterns in Figs. 3(b), 3(e), and 3(f) are taken from an individual metallic glass layer, and the diffuse ring shape verifies the fully amorphous nature of the respective CuTi and CuZr layers.
Mechanical properties
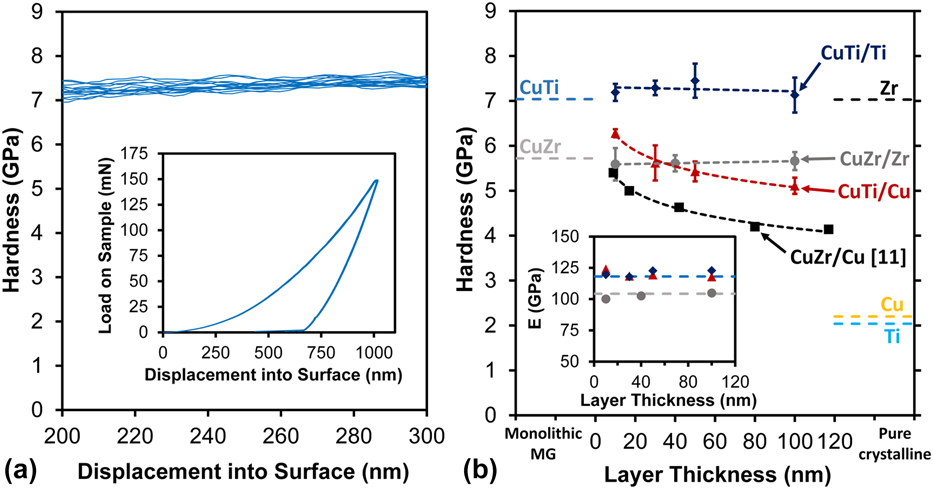
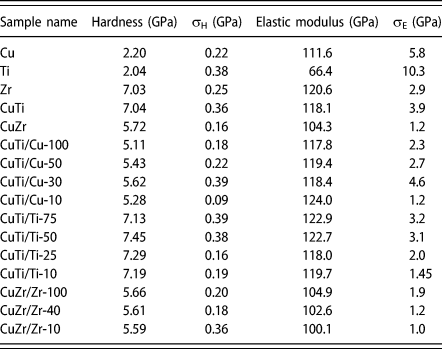
Figure 4(a) demonstrates example nanoindentation data for CuTi/Ti-30. The inset shows the load–displacement curves of individual indentations exhibiting very good repeatability, and the main figure shows the hardness calculated as a function of depth using continuous stiffness measurements. Figure 4(b) summarizes the average hardness and elastic modulus measurements of all samples. The average hardness and elastic modulus values were taken at a depth of ∼200 nm into the films where the data show a plateau indicative of the zone least affected from the tip imperfection and the substrate. Results of pure metal and monolithic metallic glass samples are shown by dashed lines, whereas markers indicate the properties of the respective nanolayers. Pure nanocrystalline Ti, Cu, and Zr have hardness values of 2.04 ± 0.38 GPa, 2.2 ± 0.22 GPa, and 7.03 ± 0.25 GPa, respectively. The hardness of CuZr metallic glass is 5.72 ± 0.16 GPa, which lies in between those of pure Cu and Zr. On the other hand, CuTi has a hardness of 7.04 ± 0.36 GPa, that is much higher than those of its constituents.
(a) Hardness of CuTi/Ti-30 as a function of indentation depth, as determined by the continuous stiffness measurement technique. Each curve corresponds to an individual indentation. The inset shows corresponding load–displacement data, demonstrating the repeatability of the results. (b) Average hardness of all samples as measured by nanoindentation. Dashed lines indicate the hardness of monolithic metallic glasses (MG) on the left and pure crystalline metals on the right. Markers are experimental data and dotted lines are curve fits to the data for guiding the eye. Inset shows the elastic modulus data of monolithic metallic glasses and nanolayered samples using the same marker and color convention used in the main figure.
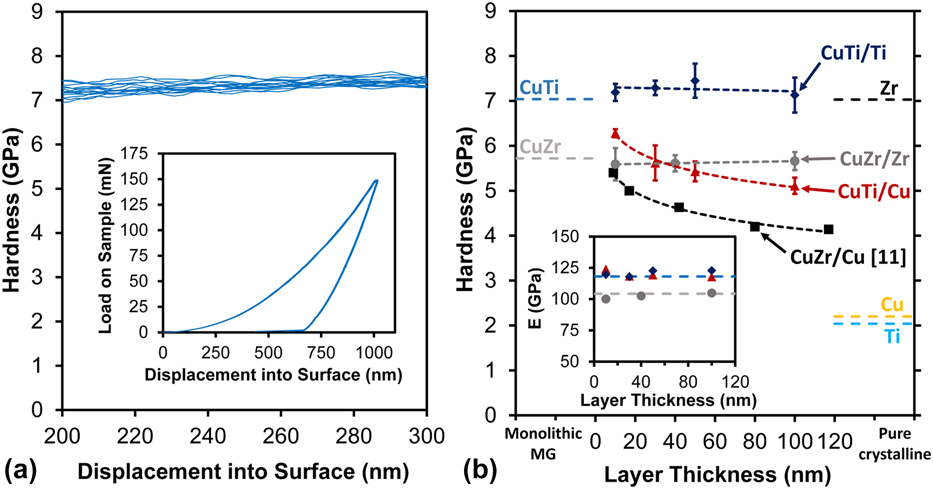
When it comes to the layered samples, there exist two different trends. CuTi/Ti and CuZr/Zr hardness values do not vary with layer thickness, whereas CuTi/Cu hardness monotonically decreases with increasing layer thickness. CuTi/Ti hardness is virtually the same as that of CuTi metallic glass, and CuZr/Zr exhibits a similar behavior with a hardness almost identical to that of CuZr metallic glass. The figure also shows the CuZr/Cu data from the literature [Reference Zhang, Liu, Chen, Chen, Liu, Zhang and Sun11], which shows decreasing hardness with increasing layer thickness. The layer-thickness-dependent hardness behavior is very similar for our CuTi/Cu samples and for CuZr/Cu results previously reported [Reference Zhang, Liu, Chen, Chen, Liu, Zhang and Sun11].
The inset of Fig. 4(b) shows the elastic modulus values of all samples. CuTi and CuZr have elastic moduli of 118.1 ± 3.9 GPa and 104.3 ± 1.2 GPa, respectively. The elastic moduli of the layered samples are very close to those of the corresponding monolithic metallic glass films. The variation of modulus with layer thickness is within 2.0% for CuTi/Cu, 1.7% for CuTi/Ti, and 1.9% for CuZr/Zr, which are comparable to the standard deviations of the data. Table II summarizes the mechanical properties measured for all samples.
Summary of hardness and elastic modulus results based on nanoindentation measurements.

Discussion
Overall, the hardness values of the pure films and the monolithic metallic glasses are in agreement with the literature values. The hardness of nanocrystalline Cu was measured as 2.2 GPa, which is very close to the results reported for sputtered nanocrystalline Cu with a similar texture and grain size [Reference Özerinç, Tai, Vo, Bellon, Averback and King20]. Nanocrystalline Zr, on the other hand, usually exhibits hardness values in the range 4–6 GPa [Reference Cordero, Knight and Schuh23], rendering the measured 7 GPa somewhat higher. This high hardness can be attributed to the strong texture of the Zr films in our case. For example, the yield strength of (002) textured nanocrystalline Zr micropillars can reach 2.6 GPa [Reference Liu, Huang, Chou, Lai, Lee and Nieh10], and using a Tabor factor of 2.7 [Reference Tabor24], the hardness can be estimated as 7 GPa, which is in good agreement with our findings. The hardness of nanocrystalline Ti can vary in the range 1.5–6 GPa depending on the grain size, texture, and impurity levels [Reference Cordero, Knight and Schuh23], and the relatively low hardness of the Ti films in this study might be due to the lack of texture.
Monolithic CuZr is one of the most frequently studied thin film metallic glasses in the literature [Reference Chu, Jang, Huang, Chou, Yang, Ye, Wang, Lee, Liu, Liaw, Chen, Lee, Li and Rullyani25], and its hardness can vary in the range 4.5–7.5 GPa depending on the composition [Reference Wang, Zeng and Li26, Reference Apreutesei, Steyer, Joly-Pottuz, Billard, Qiao, Cardinal, Sanchette, Pelletier and Esnouf27]. Our results are in very good agreement with the findings of Wang et al. [Reference Wang, Zeng and Li26], where the hardness of Cu50Zr50 was measured as ∼6 GPa. CuTi metallic glass, on the other hand, is a relatively less explored system, and the literature about its mechanical properties is quite limited. CuTi prepared by melt-spinning has a hardness of 8.5 GPa [Reference Gr[zcirc]eta, Stubiĉar, Cowlam and Trojko28], somewhat higher than our measurement of ∼7 GPa. Metallic glasses prepared by vapor deposition are usually expected to be softer than their rapidly solidified counterparts, as melt-spinning results in slower cooling rates and a more ordered structure with less free volume when compared to sputtering [Reference Chou, Huang, Chang and Nieh29].
When it comes to the nanolayered samples, CuZr/Zr and CuTi/Ti show a drastically different behavior when compared to CuTi/Cu, which provides insight into the deformation mechanisms of A/C composites. First, the behavior of CuTi/Cu will be considered, which is in agreement with the previous findings. The hardness of CuTi/Cu increases with decreasing layer thickness, a behavior commonly observed in many C/C [Reference Misra, Hirth and Hoagland7, Reference Callisti and Polcar15, Reference Misra, Verdier, Lu, Kung, Mitchell, Nastasi and Embury30, Reference Huang and Spaepen31, Reference McKeown, Misra, Kung, Hoagland and Nastasi32, Reference Zhang, Zhang, Wang, Lei, Zhang, Niu, Liu, Zhang and Sun33] and A/C [Reference Zhang, Liu, Chen, Chen, Liu, Zhang and Sun11, Reference Fan, Xue, Wang, Yu, Wang and Zhang12] nanolayered systems. In C/C systems, the observed size effect down to layer thicknesses of ∼100 nm is analogous to grain boundary strengthening, where the interfaces act as obstacles to dislocation motion [Reference Misra, Verdier, Lu, Kung, Mitchell, Nastasi and Embury30]. For layer thicknesses in the range 10–100 nm, strength continues to increase; however, the dislocation pile-up behavior that mediates the strengthening is no longer dominant, and the flow stress can be estimated through a modified confined layer slip model [Reference Misra, Hirth and Hoagland7]. At layer thicknesses below 10 nm, dislocations start to cross the layer interfaces, and the strength tends to reach a plateau [Reference Misra, Hirth and Kung34].
The plastic response of A/C nanolayers differs from those of C/C layers, as amorphous materials do not contain dislocations. In metallic glasses, the plasticity is mediated by shear transformation zones (STZ) and shear bands formed by their percolation [Reference Pan, Inoue, Sakurai and Chen35]. In most A/C nanolayers studied, the bulk strength of the metallic glass component is higher than that of the crystalline phase, and as a result, the softer crystalline layer yields first upon loading. When loading is perpendicular to the layers, compressive stresses develop in the crystalline layers upon deformation, as a result of their confinement in between hard amorphous layers. This compressive stress will gradually increase the effective flow stress of the crystalline layer. The dislocations terminating at the interface will eventually trigger the formation of STZs in the metallic glass layers and will promote the co-deformation of all layers [Reference Wang, Zhou, Shao and Misra4]. The strength of CuTi/Cu samples can then be interpreted by comparing the hardness of monolithic CuTi and Cu, which are ∼7 GPa and 2.2 GPa, respectively. As nanoindentation-induced deformation corresponds to an average strain level of ∼8% [Reference Fischer-Cripps36], the hardness of the nanocomposite is expected to reflect a combination of Cu that yields initially and that of CuTi that deforms subsequently. Both our hardness results for CuTi/Cu and reported values for CuZr/Cu [Reference Zhang, Liu, Chen, Chen, Liu, Zhang and Sun11] lie in between the hardness values of the constituents, in agreement with this explanation.
The strengthening of CuTi/Cu with decreasing layer thickness can be attributed to the strengthening of the Cu layers, as metallic glasses do not show a strong size effect [Reference Schuster, Wei, Hufnagel and Ramesh37, Reference Kuan, Chou, Liu, Du and Huang38]. With decreasing layer thickness, average grain size decreases and the number of interfaces increases, both of which increase the total volume fraction of the boundaries that impede dislocation motion in Cu. Furthermore, the disordered structure of the metallic glass layers with a high level of free volume promotes dislocation starvation at the boundaries of Cu, potentially resulting in additional strengthening. The combined effects of these are reflected in our experimental results for CuTi/Cu, where there is a monotonic increase in hardness with decreasing layer thickness.
The hardness of CuTi/Cu can be quantitatively modeled by using the modified confined slip (CLS) model [Reference Misra, Hirth and Hoagland7], which takes into account the effects of dislocation core spreading, interface stress, and interactions between the array of dislocations. According to the model, the normal stress required to propagate a glide loop of Burgers vector b within a single Cu layer can be estimated as
 $${\sigma _{{\rm{cls}}}} = {{M\mu b} \over {8\pi \left( {{h / {\sin \left( \varphi \right)}}} \right)}}\ln \left( {{\alpha \over {{b_{{\rm{Cu}}}}}}{h \over {\sin \left( \varphi \right)}}} \right)\left( {{{4 - \nu } \over {1 - \nu }}} \right) - {f \over h} + {{\mu b} \over {L\left( {1 - \nu } \right)}}\quad .$$
In this equation, M is the Taylor factor, µ is the effective shear modulus, b is the length of the Burgers vector, ν is Poisson’s ratio, and h is the layer thickness. φ is the angle between the glide plane and the interface, therefore, h/sin(φ) gives the effective thickness of the layer along the glide plane. α is the core cutoff parameter (<1) where smaller values indicate a wider dislocation core. f is the interface stress caused by the elastic deformation of the interface region and assists the deformation process for compressive geometries, which is the case for nanoindentation. Finally, L is the spacing between the parallel array of glide loops. By using Eq. (1) with a Tabor factor of 2.7, the hardness of the layers can be estimated as H = 2.7σcls.
The modified CLS model was originally utilized to explain the deviations from the Hall–Petch behavior in Cu/Nb incoherent nanolayers [Reference Misra, Hirth and Hoagland7]. In later studies, the model has been successfully applied to a number of incoherent C/C nanolayers to predict the strength and its size dependence [Reference Callisti and Polcar15, Reference Lu, Kotoka, Ligda, Cao, Yarmolenko, Schuster and Wei39, Reference Hou, Zhang, Li, Wang, Wu, Liu, Zhang and Sun40]. As the plastic deformation starts in the softer layers, the application of the model to the softer layers provides a more accurate estimation of the yield strength. A/C nanolayers tend to have a weak interface [Reference Liu, Huang, Fong, Ju, Du, Pei and Nieh41], which is similar to incoherent C/C nanolayers in this aspect. Although the amorphous layers do not contain dislocations, they can act as dislocation sinks and sources [Reference Wang, Li, Hamza and Barbee8]. Therefore, application of the modified CLS model to the crystalline layer of A/C composites is reasonable as long as the crystalline layer is softer than the amorphous phase. This approach has so far resulted in good agreement with the experimental results of the A/C nanolayers [Reference Zhang, Liu, Chen, Chen, Liu, Zhang and Sun11, Reference Guo, Jägle, Yao, Maier, Korte-Kerzel, Schneider and Raabe13].
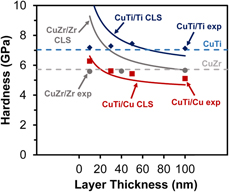
For CuTi/Cu, considering the deformation of the Cu layers, b Cu = 0.26 nm, ν = 0.34, and φ = 70.5° (the angle between the (111) slip plane and the interface). α defines the extent of core spreading, and unfortunately, there is no available quantitative data for A/C interfaces. For Cu/Nb nanolayers, molecular dynamics simulations suggest an α value of 0.2 [Reference Hoagland, Kurtz and Henager42], while α = 0.45 predicts the literature data for CuZr/Cu layers better [Reference Zhang, Liu, Chen, Chen, Liu, Zhang and Sun11]. When it comes to the interface stress, A/C interfaces have f values approximately in the range 0.5–1.1 J/m2 [Reference Cammarata43, Reference Bernstein, Aziz and Kaxiras44]. Glide loop spacing, L, is related to the strain in the layers by ε = b/L. The average strain in the plastically deforming region under a Berkovich indenter is ∼8% [Reference Tabor24], which corresponds to an L of ∼3.2 nm. A relatively larger L value in the range 5–15 nm usually predicts the experimental results better, which can be attributed to the low strain hardening in crystalline nanolayers [Reference Huang and Spaepen31, Reference Mara, Sergueeva, Misra and Mukherjee45]. Based on these previous findings and utilizing the parameters previously used for modeling CuZr/Cu nanolayers [Reference Zhang, Liu, Chen, Chen, Liu, Zhang and Sun11], Fig. 5 shows the predictions of the modified CLS model for CuTi/Cu, using α = 0.45, f = 1.1 J/m2, L = 5 nm, and µ = 20.3 GPa. There is a relatively good agreement between the model predictions and the experimental data for CuTi/Cu. The higher experimental hardness values for layer thicknesses of 50 and 100 nm can be attributed to the polycrystalline structure of the layers. CuTi/Cu-50 and CuTi/Cu-100 have average grain sizes of 9 and 16 nm, respectively, and the high density of grain boundaries within the layers can act as additional obstacles to dislocation motion as predicted by molecular dynamics simulations [Reference Zhu, Li, Huang and Liu46].
Comparison of the predictions of the modified confined layer slip (labeled as “CLS”) model with the experimental data (labeled as “exp”). Dashed lines indicate the hardness of the monolithic metallic glasses.

For CuTi/Ti and CuZr/Zr, predictions of the modified CLS model can be determined similarly. For CuTi, we keep the parameters governing the interface behavior the same and adopt the remaining parameters from the previous work on Mg/Ti nanolayers [Reference Lu, Kotoka, Ligda, Cao, Yarmolenko, Schuster and Wei39]; b Ti = 0.29 nm, ν = 0.32, φ = 60°, α = 0.45, f = 1.1 J/m2, and L = 9 nm. CuZr/Zr can be modeled similarly, where b Zr = 0.32 nm, ν = 0.34, φ = 60°, and we keep α, f, and L the same as those of CuTi/Ti.
Figure 5 shows that CLS model predictions are quite different than the experimental results. First of all, the predicted hardness of the nanolayers CuTi/Ti and CuZr/Zr, which resembles the flow strength of the crystalline layers (Ti, and Zr), is considerably higher than the measured hardness of the corresponding monolithic metallic glasses (CuTi, and CuZr, respectively). In addition, the modified CLS model predicts increasing hardness with decreasing layer thickness, whereas the experimental data indicate a thickness-independent strength.
The difference between the model predictions and the experimental results can be explained by considering the relative strengths of the crystalline and amorphous layers. Modified CLS model prediction corresponds to the effective flow stress of the crystalline layer, and for CuTi/Ti and CuZr/Zr, it is higher than the hardness of the corresponding metallic glass layer. Therefore, during indentation of CuTi/Ti and CuZr/Zr, metallic glass layers are expected to deform before the crystalline layers, as opposed to CuTi/Cu, where crystalline layers deform first. Then the strength of the composite and any associated size effect are expected to be dominated by the response of the metallic glass. As the metallic glass layers are of amorphous nature, it is not possible to apply the CLS model. Nevertheless, the results of layer-thickness-independent hardness can be interpreted qualitatively. First of all, metallic glasses do not show a strong size effect when compared to the significant smaller-is-stronger behavior observed in crystalline materials. Compression studies on Pd-based bulk metallic glasses showed that the micropillar specimens with diameters in the range 2–20 µm are only ∼10% stronger than their bulk counterparts [Reference Schuster, Wei, Hufnagel and Ramesh37]. A similar behavior is observed in confined geometries: a Zr-based/Pd-based amorphous/amorphous nanolayered film was reported to have a hardness of only 15% higher than the average of its constituents [Reference Kuan, Chou, Liu, Du and Huang38]. These variations are much smaller when compared to crystalline metals; as an example, nanolayered Cu/Nb’s strength can reach three times that of nanocrystalline Cu [Reference Mara, Bhattacharyya, Dickerson, Hoagland and Misra1]. Therefore, the size-independent behavior of the metallic glasses can explain the virtually constant hardness of CuTi/Ti and CuZr/Zr.
In addition to the modified CLS-model-based analyses, the results can also be interpreted by the deformation behavior of HCP crystals. During the nanoindentation of CuTi/Ti and CuZr/Zr, basal planes are mostly perpendicular to the loading and the operation of the basal and prismatic slip is limited. The result is the operation of the pyramidal slip planes. Cantilever bending measurements on single crystal Zr have shown that the critical resolved shear stress (CRSS) in the pyramidal planes can be more than two times higher than those of basal and prismatic planes [Reference Gong, Benjamin Britton, Cuddihy, Dunne and Wilkinson47]. Therefore, a geometric strengthening is expected in Zr layers, which will force the metallic glass layers to deform first. Ti also has a high CRSS for pyramidal slip [Reference Gong and Wilkinson48], and this can explain the high strength of CuTi/Ti layers when compared to the relatively low hardness of our nanocrystalline Ti that lacks texture. Such anomalous geometric strengthening has previously been observed in Mg/Nb HCP/BCC nanolayers with strongly textured Mg layers [Reference Ham and Zhang14]. On the other hand, CuTi/Cu samples with FCC crystalline layers are not expected to exhibit such extrinsic strengthening, due to the higher number of available slip planes in FCC crystals. As a result, Cu layers are softer than CuTi in the CuTi/Cu samples, and we observe the usual size dependence governed by the modified CLS model.
Conclusion
We investigated the structure–property relationships of two amorphous/HCP crystalline nanolayered systems, CuTi/Ti and CuZr/Zr. As opposed to most crystalline/crystalline and amorphous/crystalline nanolayers reported to exhibit strengthening with decreasing layer thickness in the literature, amorphous/HCP nanolayers maintained virtually the same hardness for layer thicknesses in the range 10–100 nm. Furthermore, the hardness values of CuTi/Ti and CuZr/Zr were virtually the same as those of monolithic CuTi and CuZr, respectively. By using the modified confined layer slip model, we estimated that the crystalline layers, Ti and Zr, have higher effective flow strengths than those of the corresponding metallic glasses, CuTi and CuZr, respectively. As a result, the softer metallic glass layers govern the strength and size effects of CuZr/Zr and CuTi/Ti nanolayers, in agreement with our experimental findings. We also explored a nanolayered amorphous/FCC crystalline composite of CuTi/Cu as a third model system and demonstrated the commonly observed strengthening with decreasing layer thickness. In this case, the softer Cu layer with a large number of slip planes mediate the strength and its size dependence.
The layer-thickness-independent strength observed for amorphous/HCP crystalline nanolayers gives important insights into the mechanical behavior of metallic glasses and crystalline metals at the nanoscale and provides a convenient model system for future studies about the effects of layer thickness on other mechanical properties such as tensile strength, ductility, and fracture toughness.
Experimental
A magnetron sputterer (VAKSİS, Ankara, Turkey) deposited the films of 1 µm nominal thickness on oxidized single crystal silicon substrates at an Ar pressure of 2.2 × 10⁻³ torr. The only exception was CuZr/Zr samples, which were deposited on polished stainless steel substrates. The base pressure of the sputtering chamber was below 1 × 10⁻⁷ torr before deposition. Sputtering targets were 2″ diameter and 1/4″ thickness elemental disks of 99.99% purity (Kurt J. Lesker, Jefferson Hills, Pennsylvania). We calibrated the deposition rates by using a ZYGO 7200 optical profilometer (Zygo, Middlefield, Conencticut). The sputtering power was adjusted to keep the deposition rates at ∼10 nm/min. A Quanta 400F (FEI Company, Hillsboro, Oregon) scanning electron microscope (SEM) equipped with an energy-dispersive X-ray spectroscopy (EDS) detector (Oxford Instruments, Abingdon, U.K.) verified the compositions of the monolithic metallic glasses.
The microstructures of the films were analyzed by X-ray diffraction (XRD) and transmission electron microscopy (TEM). An Ultima IV diffractometer (Rigaku, Tokyo, Japan) analyzed the samples in the glancing angle mode where the angle between the incoming beam and the sample surface was 1°. A Nova 600 Nanolab focused ion beam (FEI Company, Oregon) prepared the TEM samples using the lift-out technique. A JEM 2100 HRTEM (JEOL, Tokyo, Japan) imaged the samples at 200 kV. A Gatan Model 794 Slow Scan CCD and a Gatan 833 Orius SC200D CCD cameras (Gatan Inc., Pleasanton, California) were used to take the images.
An Agilent G200 nanoindenter (Agilent Technologies, Santa Clara, California) equipped with a diamond Berkovich tip performed the indentation measurements on all samples. The measurements employed the continuous stiffness measurement technique [Reference Li and Bhushan49]. Sixteen indentations were performed on each sample, and the results presented are the average values.
Acknowledgments
This research is supported by the Scientific and Technological Research Council of Turkey—CAREER Award #116M429 and METU-BAP Project GAP-302-2018-2662. We would like to thank Dr. Amir Motallebzadeh and Dr. Özgür Duygulu for their support in nanoindentation and electron microscopy, respectively. We would like to thank METU Central Laboratory, Koç University KUYTAM, and Bilkent University UNAM for their support with the use of the characterization instruments.