Management Implications
We found high genetic diversity of Alternanthera philoxeroides (alligatorweed) across the United States that is structured geographically. Two of the chloroplast haplotypes (genotypes) we found correspond to two previously described narrow-stem (NSA) and broad-stem (BSA) biotypes that are reported to respond differently to both biological control and herbicides. The other genotypes we found may also differ in their invasiveness (e.g., varying growth rates) or may respond differently to control measures. The control of these different haplotypes should be tested with currently available herbicides and biological control agents. These studies may encourage foreign exploration for additional agents that are better adapted to specific haplotypes and climates. Managers may need to consider that different areas will need different management strategies. Some states have mainly a single invasive haplotype that may respond more uniformly to a single control strategy, while other states and river basins have a variety of haplotypes and therefore may require a variety of control strategies depending on population genetics and specific locality. The markers we developed in this study could be used to quickly determine which haplotypes are present in a given area.
Introduction
The distribution of genetic diversity in invasive plants can have important management implications. Different genotypes of the same species and inter- or intraspecific hybrids can require different control methods due to differing growth potential or resistance to particular agents or herbicides (Bultemeier et al. Reference Bultemeier, Netherland, Ferrell and Haller2009; LaRue et al. Reference LaRue, Grimm and Thum2013; Manrique et al. Reference Manrique, Cuda, Overholt, Williams and Wheeler2008; Michel et al. Reference Michel, Arias, Scheffler, Duke, Netherland and Dayan2004; Thum et al. Reference Thum, Wcisel, Zuellig, Heilman, Hausler, Tyning, Huberty and Netherland2012; Williams et al. Reference Williams, Friedman, Gaskin and Norton2014). Investigations into the distribution of genetic diversity across the invasive range can potentially shed light on whether management efforts will need to be tailored to specific regions or whether an overall broad strategy can be employed (Benoit and Les Reference Benoit and Les2013; Thum et al. Reference Thum, Chorak, Newman, Eltawely, Latimore, Elgin and Parks2020). For example, the aquatic invader hydrilla (Hydrilla verticillata L. f. Royle) is widespread in the United States, but management must be tailored to the infested area, because there are multiple introduced biotypes with different geographic distributions (Jacono et al. Reference Jacono, Richerson, Howard Morgan and Pfingsten2020); introduced biological control agents differ in their effectiveness between biotypes (Grodowitz et al. Reference Grodowitz, Nachtrieb, Harms and Freedman2010); and herbicide-tolerant strains have emerged in some areas, requiring alternative herbicides for effective control (Netherland and Jones Reference Netherland and Jones2015). Understanding and comparing the distribution of genetic diversity in native and invasive ranges can also shed light on the number of introductions and evolutionary processes acting during invasion (founder effects, bottlenecks, etc.) and identify source regions in the native range to facilitate the exploration for biological control agents and the design of appropriate host-specificity plant tests (Croxton et al. Reference Croxton, Andreu, Williams, Overholt and Smith2011; Gaskin et al. Reference Gaskin, Bon, Cock, Cristofaro, De Biase, De Clerck-Floate, Ellison, Hinz, Hufbauer, Julian and Sforza2011; Ward et al. Reference Ward, Gaskin and Wilson2008; Williams et al. Reference Williams, Overholt, Cuda and Hughes2005, Reference Williams, Harms, Grodowitz and Purcell2018).
Alligatorweed [Alternanthera philoxeroides (Mart.) Griseb.] is native to the Parana and Paraguay River regions in Argentina, Paraguay, Uruguay, and southeastern Brazil (Sosa et al. Reference Sosa, Julien and Cordo2004). It was introduced into the United States around 1900, most likely through contaminated ship ballast, and quickly spread throughout waterways in the southern United States and California (Zeiger Reference Zeiger1967). The species has also been introduced to Asia, Europe, Australia, Central America, the Caribbean, and other regions in South America. The plant can grow in both terrestrial and aquatic habitats and is a serious threat to waterways, agriculture, and natural habitats due to its rapid growth rate and ability to outcompete native species (Buckingham Reference Buckingham, Driesche, Blossey, Hoddle, Lyon and Reardon2002).
Phenotypic plasticity for growth form and sex in A. philoxeroides is common and has been documented for aquatic versus terrestrial habitats and between different soil types (Geng et al. Reference Geng, Pan, Xu, Zhang, Li, Chen, Lu and Song2007; Kay and Haller Reference Kay and Haller1982; Liu et al. Reference Liu, Deng, Liu, Wang, Ye, Wang, Cao and Shen2011). In the United States, two biotypes have been recognized, one with a broad stem and long, narrow leaves (BSA) and one with a narrow stem and short, broad leaves (NSA), which are differentiated at allozyme loci and are not a phenotypic response to different environmental conditions (Kay and Haller Reference Kay and Haller1982; Wain et al. Reference Wain, Haller and Martin1984). These biotypes may correspond to two forms described in South America, A. philoxeroides philoxeroides and A. philoxeroides angustifolia (Sosa et al. Reference Sosa, Julien and Cordo2004, Reference Sosa, Greizerstein, Cardo, Telesnick and Julien2008). A study utilizing nuclear inter-simple sequence repeats (ISSRs) found that populations in the United States have much higher genetic diversity compared with populations in China and genetic diversity similar to samples from the plant’s native range in Argentina (Geng et al. Reference Geng, van Klinken, Sosa, Li, Chen and Xu2016). Geng et al. (Reference Geng, van Klinken, Sosa, Li, Chen and Xu2016) suggest a single clonal lineage was introduced into China, while multiple lineages were introduced into the United States.
Alternanthera philoxeroides ploidy is difficult to study due to a large number of small chromosomes, but the presence of aneuploidy and low pollen viability in a number of samples in the native range suggests A. philoxeroides exists as a complex of hybrids (Sosa et al. Reference Sosa, Greizerstein, Cardo, Telesnick and Julien2008; Telesnicki et al. Reference Telesnicki, Sosa, Greizerstein and Julien2011). In Argentina, the species exists as tetraploid (4n = ca. 68) or hexaploid (6n = ca. 102), while in China, individuals are hexaploid (6n = 102) (Cai et al. Reference Cai, Wei and Chen2009; Krug and Sosa Reference Krug and Sosa2019; Sosa et al. Reference Sosa, Greizerstein, Cardo, Telesnick and Julien2008). Based on estimates of genome size, A. philoxeroides may be pentaploid in the United States (Chen et al. Reference Chen, Xiong, Pan, Shen, Geng, Xu, Chen and Zhang2015). The ploidy of A. philoxeroides may be important from a control standpoint, because increased ploidy has been suggested to contribute to invasiveness for a number of taxa by increasing adaptive potential or plasticity to environmental conditions and management actions (Pandit et al. Reference Pandit, White and Pocock2014; te Beest et al Reference te Beest, Le Roux, Richardson, Brysting, Suda, Kubesova and Pysek2012). However, for A. philoxeroides, female alligator weed flea beetles (Agasicles hygrophila Selman and Vogt, Coleoptera: Chrysomelidae) prefer to oviposit, and larvae have better performance on hexaploids than tetraploids in the native range (Krug and Sosa Reference Krug and Sosa2019). Therefore, the role of polyploidy in A. philoxeroides invasion success and management remains unclear.
Three biological control agents were introduced into the United States in 1964 to 1971 to control A. philoxeroides (Spencer and Coulson Reference Spencer and Coulson1976). These agents, especially A. hygrophila, have significantly reduced infestations in the southern United States (Cofrancesco Reference Cofrancesco1988; Spencer and Coulson Reference Spencer and Coulson1976). Nevertheless, there is still widespread variability in control efficacy that may have a climatic or genetic basis. Because A. hygrophila cannot survive colder winter temperatures in the northern part of A. philoxeroides range in the United States, it must migrate annually from overwintering locations in the South (Coulson Reference Coulson1977). This leads to annual variation in the timing of A. hygrophila activity in more northern A. philoxeroides populations and contributes to the observed variability in control in those regions (Harms and Cronin Reference Harms and Cronin2020). Additionally, the two A. philoxeroides biotypes (BSA and NSA) in the United States appear to differ in their susceptibility to herbivory by A. hygrophila (Kay and Haller Reference Kay and Haller1982; Pan et al. Reference Pan, Jia, Fu and Li2013) and they respond differently to some herbicides (Kay Reference Kay1992). To what extent observed variability in control may be due to presence of these different genotypes or others has not been well studied.
Here we report on the largest A. philoxeroides genetic study to date, conducted across the entire invaded range of the United States to help inform future management of this species. We characterized the genetic structure of A. philoxeroides in the United States using chloroplast (cpDNA) markers, to better understand the invasion history of A. philoxeroides and explore whether this genetic diversity can be linked to geographic patterns, climate, morphology, and ploidy, which could have important management implications. Chloroplast markers are particularly well suited for phylogeographic studies, and so these data will also provide the basis for identifying the specific source regions in South America, which may lead to the discovery of new biological control agents more closely matched to particular genotypes (e.g., Cuda et al. Reference Cuda, Christ, Manrique, Overholt, Wheeler and Williams2012; Schaal et al. Reference Schaal, Gaskin and Caicedo2003; Williams et al. Reference Williams, Overholt, Cuda and Hughes2005, Reference Williams, Harms, Grodowitz and Purcell2018). The response of plants to management such as biological control agents and herbicides is expected to be related to nuclear DNA variation rather than cpDNA haplotypes per se. In clonally reproducing populations, however, cpDNA variation will be linked to nuclear DNA, and cpDNA haplotypes may therefore provide a good marker for distinguishing biotypes, as they are for invasive H. verticillata in the United States (Madeira et al. Reference Madeira, Coetzee, Center, White and Tipping2007). Alternanthera philoxeroides produces viable seed in the native range but is believed to spread only through fragmentation and vegetative growth in the invasive range (Geng et al. Reference Geng, Pan, Xu, Zhang, Li, Chen, Lu and Song2007; Sainty et al. Reference Sainty, McCorkelle and Julien1998; Thayer and Pfingsten Reference Thayer and Pfingsten2020; Ye et al. Reference Ye, Li, Cao and Ge2003). Seedlings have never been found in the invasive range, and although seeds are produced, they do not appear viable, so cpDNA haplotypes could potentially be useful as markers to indicate which management efforts will be most effective for a given area.
We specifically ask: (1) Is cpDNA diversity consistent with high genetic diversity and the presence of multiple introductions into the United States? (2) Does genetic diversity in A. philoxeroides reflect geographic and climatic patterns? (3) Do genotypes correspond to the previously described NSA and BSA biotypes? (4) Do genotypes correspond to previously described ploidy levels in A. philoxeroides? These data will provide a better understanding of the genetic variability across the invasive range in the United States that can be used in future studies to determine whether genotype differences may be correlated with growth rates and effectiveness of different control methods.
Materials and Methods
Sampling
Alternanthera philoxeroides tissues (n = 375 samples) were collected during 2017 to 2020 at locations in the United States. Most samples were collected by the authors (66 sites), but in several cases (33 sites), we received material from collaborators. Sampling locations were identified through a variety of means, including chance encounters while driving, directed searching from online databases, museum herbarium records, or local knowledge. Plants within sites were chosen for sampling at random, and collections were spaced apart by several meters to avoid sampling the same plant. At each site, one to eight plants were sampled. The uppermost two leaf-pairs were removed and placed in a sealable plastic bag with silica gel desiccant. Once dry, samples were frozen until they could be processed.
Genetics
We extracted DNA from all samples using the IBI Scientific MINI Genomic DNA kit (Plants) (Dubuque, IA) as per the manufacturer’s instructions. We amplified and sequenced three chloroplast (cpDNA) regions (rpL16, trnS-G, trnL intron, and trnL-F spacer), using primers reported in Shaw et al. (Reference Shaw, Lickey, Beck, Farmer, Liu, Miller, Siripun, Winder, Schilling and Small2005) for 24 samples. Polymerase chain reactions (PCR) (10 µl) contained 10 to 50 ng of DNA, 0.5 µM of each primer, and 1X AccuStartTM II PCR SuperMix (2X) (Quanta Biosciences, Gaithersburg, MD). Reactions were cycled in an ABI 2720 thermal cycler (Thermo Fisher Scientific, Waltham, MA). The cycling parameters were one cycle at 95 C for 10 min, followed by 30 cycles of 30 s at 94 C, 30 s at 55 C, 60 s at 72 C, and then a final extension at 72 C for 5 min. Products were sequenced bidirectionally with the PCR primers using BrightDye® Terminator Cycle Sequencing Kit (MCLAB, South San Francisco, CA). The only polymorphisms between samples in these cpDNA regions were differences in the size of mononucleotide repeats. Unique sequences have been deposited in GenBank (NCBI accession numbers MW015925–MW015933). We therefore designed primers around these repeat regions (5′ – 3′) rpL16F–TGGAATCATAGTGGATTGTCAAA, rpL16R–CAATTCATTGGGAAGGATGG; trnS-GF–AAGTAACAAAGATTCAACGAATTCAA, trnS-GR–AGGCCGTGGGAATACTCCTT; trnFfF–CTTCTCTCGCATCATCTTCTCA, trnFfR–GTCCCTCTATCCCCAAAAGC. Each forward primer was labeled with 6-FAM. All three cpDNA regions were amplified in a single multiplex reaction. PCRs (10 µl) contained 10 to 50 ng of DNA, 0.1 µM of each primer, and 1X AccuStartTM II PCR SuperMix (2X). The cycling parameters were one cycle at 95 C for 10 min, followed by 30 cycles of 30 s at 94 C, 30 s at 60 C, 30 s at 72 C, and then a final extension at 60 C for 30 min on an ABI 2720 thermal cycler. The resulting multiplexes were diluted 20X with dH2O. For each sample, 1.0 µl of diluted product was loaded in 10 µl of HIDI formamide with 0.1 µl of LIZ-500 size standard (Thermo Fisher Scientific) and electrophoresed on an ABI 3130XL Genetic Analyzer. Genotypes were then scored and binned using GENEMAPPER v. 5.0 (Thermo Fisher Scientific). Positive controls for each haplotype were run in all amplification batches to control for slight size shifts (~ ±0.5 bp) that can occur between runs. Reamplification of 10% of all samples, including the less common genotypes, gave identical results.
Leaf Morphology and Plant Architecture
Plants were collected from field locations during 2017 to 2018 and then clonally propagated three to four times in a common garden before morphological measurements. Plants from each population were cultured separately in 20-L plastic buckets with municipal-delivered tap water supplemented with slow-release Osmocote® fertilizer (15-9-2; Scotts Miracle-Gro, Marysville, OH). For morphology/plant architecture measurements, plants were recultured in a standard nutrient solution. Genotyping was conducted using the original plant material collected from the field.
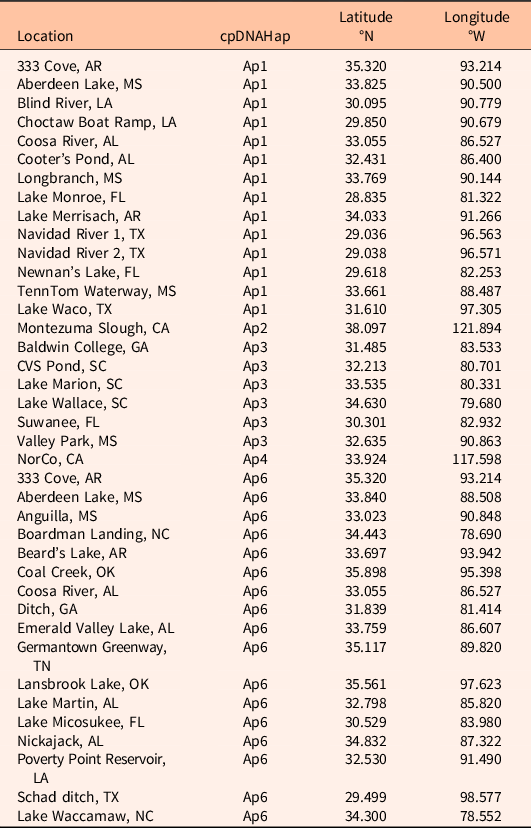
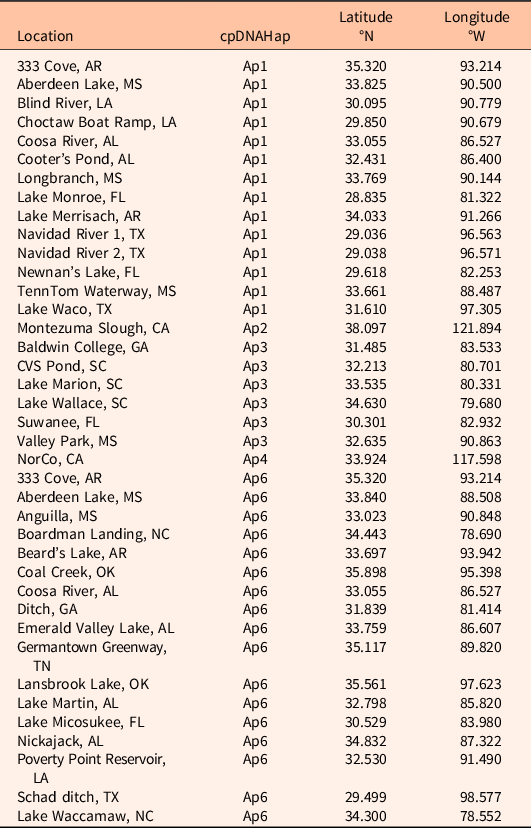
To assess differences in leaf shape, stem diameter, and stem branching, plants were grown hydroponically in a temperature-controlled greenhouse at the U.S. Army Engineer Research and Development Center, Vicksburg, MS. Six replicate clones from 39 populations (Table 1) were placed into net pots (12.7-mm diameter) filled with washed expanded clay rocks (8- to 16-mm diameter). Net pots were placed individually within white 4-L polyethylene food containers, and charcoal-filtered tap water was added to each container. After 1 wk, the water was replaced with 1.5 L of half-strength Hoagland’s nutrient solution. Six weeks after adding nutrients, measurements were taken on all plants. We collected four leaves from each plant (n = 24 leaves per population), imaged them on a flatbed scanner, and then measured their dimensions (length and width) using ImageJ image analysis software (National Institutes of Health, Bethesda, MD). Leaf shape was calculated as the length-to-width ratio. Outer stem diameter of each plant was measured in millimeters at the widest location on the stem. Branching was measured as the total number of side branches off the main stem.
Alternanthera philoxeroides locations used for morphological leaf measurements.
Ploidy
Shoot cuttings from five haplotypes (Ap 1, 2, 3, 4, and 6) were cultured hydroponically in flasks within an incubator until new roots emerged for collection. Root tips were excised from actively growing adventitious roots, fixed for 2 h in 3:1 ethanol: acetic acid, and stored in 70% ethanol until analysis. Fixed root tips were stained with Schiff reagent using the Feulgen reaction. Five evaluations were performed for each of the population samples using meristematic cells from preserved root tip tissue that were “squashed” between cover slips and microscope slides in 45% acetic acid. Slides were examined directly under phase-contrast optics at 1,000× (oil immersion) using a Zeiss Axiostar Plus microscope (Zeiss Microscopy, Jena, Germany). Images were photographed with an Infinity 2-1 digital camera (Lumenera, Ottawa, Canada) using Image-Pro Insight v. 9.0 software (Media Cybernetics, Bethesda, MD). Composite images, including 10 to 30 images in sequence, from 6 to 8 cells per squash were then evaluated for chromosome counts. Ploidy level was assigned based on chromosome numbers.
Statistical Analyses
We merged sampling sites that were within the same river system or lake to increase sample sizes within sites. This resulted in 90 sites with 3 to 13 samples (mean 4.1 ± 0.18 SE samples per site). Haplotype diversity (h) and analysis of molecular variance (AMOVA) were calculated in GenAlEx v. 6.5 (Peakall and Smouse Reference Peakall and Smouse2006, Reference Peakall and Smouse2012). Haplotype diversity is the probability that two randomly selected samples are different haplotypes. A TCS haplotype network (Clement et al. Reference Clement, Posada and Crandall2000; Templeton et al. Reference Templeton, Crandall and Sing1992) was constructed using POPART (Leigh and Bryant Reference Leigh and Bryant2015) to visualize similarities among haplotypes.
To explore the spatial distribution of common A. philoxeroides haplotypes in the United States, we used an information theoretic approach. We excluded rare haplotypes (Ap2, 4, 5) from this exploration, because they only occurred in a few locations, suggesting they are recent introductions or post-introduction mutations and have not yet spread to their potential extent. We extracted climate data for A. philoxeroides collection locations from the first five principal components (PCs) of the 35 bioclimatic variables in the CliMond 1975H data set (Bio36, Bio37, Bio38, Bio39, Bio40) (Kriticos et al. Reference Kriticos, Jarošik and Ota2014). The PCs are described in Kriticos et al. (Reference Kriticos, Jarošik and Ota2014) and explain more than 90% of the variation in the original CliMond data set. PCs were used to obtain climate information for each survey location and as potential explanatory variables for distribution of haplotypes, assessed through model selection.
We used the Akaike information criterion adjusted for small sample size (AICc) to select the most informative multinomial logistic regression model from the full set of candidate models (Burnham and Anderson Reference Burnham and Anderson2003). For the full model, haplotype was the nominal response variable, and latitude, longitude, and each climate PC were included as covariates. None of the PCs were strongly correlated with latitude or longitude (i.e., r > 0.90), so all were included in the full model. We used multinomial logistic regression to test whether haplotype identity was related to latitude, longitude, or any of the five climate PCs. Top models (i.e., those with substantial support; Burnham and Anderson Reference Burnham and Anderson2003) were those with AICc values within 2 of the model with the lowest AICc value. AICc weights are also reported, which represent the relative strength of support that a model is the best given the data and other candidate models. Spearman rank correlation was used to test for associations between the relative abundance of haplotypes and latitude.
The effects of haplotype on leaf shape, stem diameter, and branching were modeled in R (R Core Team 2013) using generalized linear mixed models. Source population was treated as a random effects variable. Branching count data were not normally distributed and thus were modeled using a Poisson error distribution. Post hoc means separations were conducted using the Benjamini-Hochberg adjustment for multiple comparisons (Benjamini and Hochberg Reference Benjamini and Hochberg1995). All results displayed are untransformed means with standard error.
Results and Discussion
Genetic Diversity
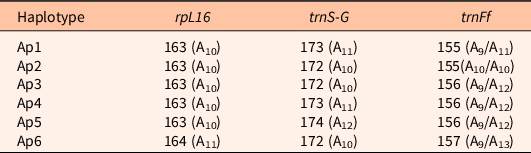
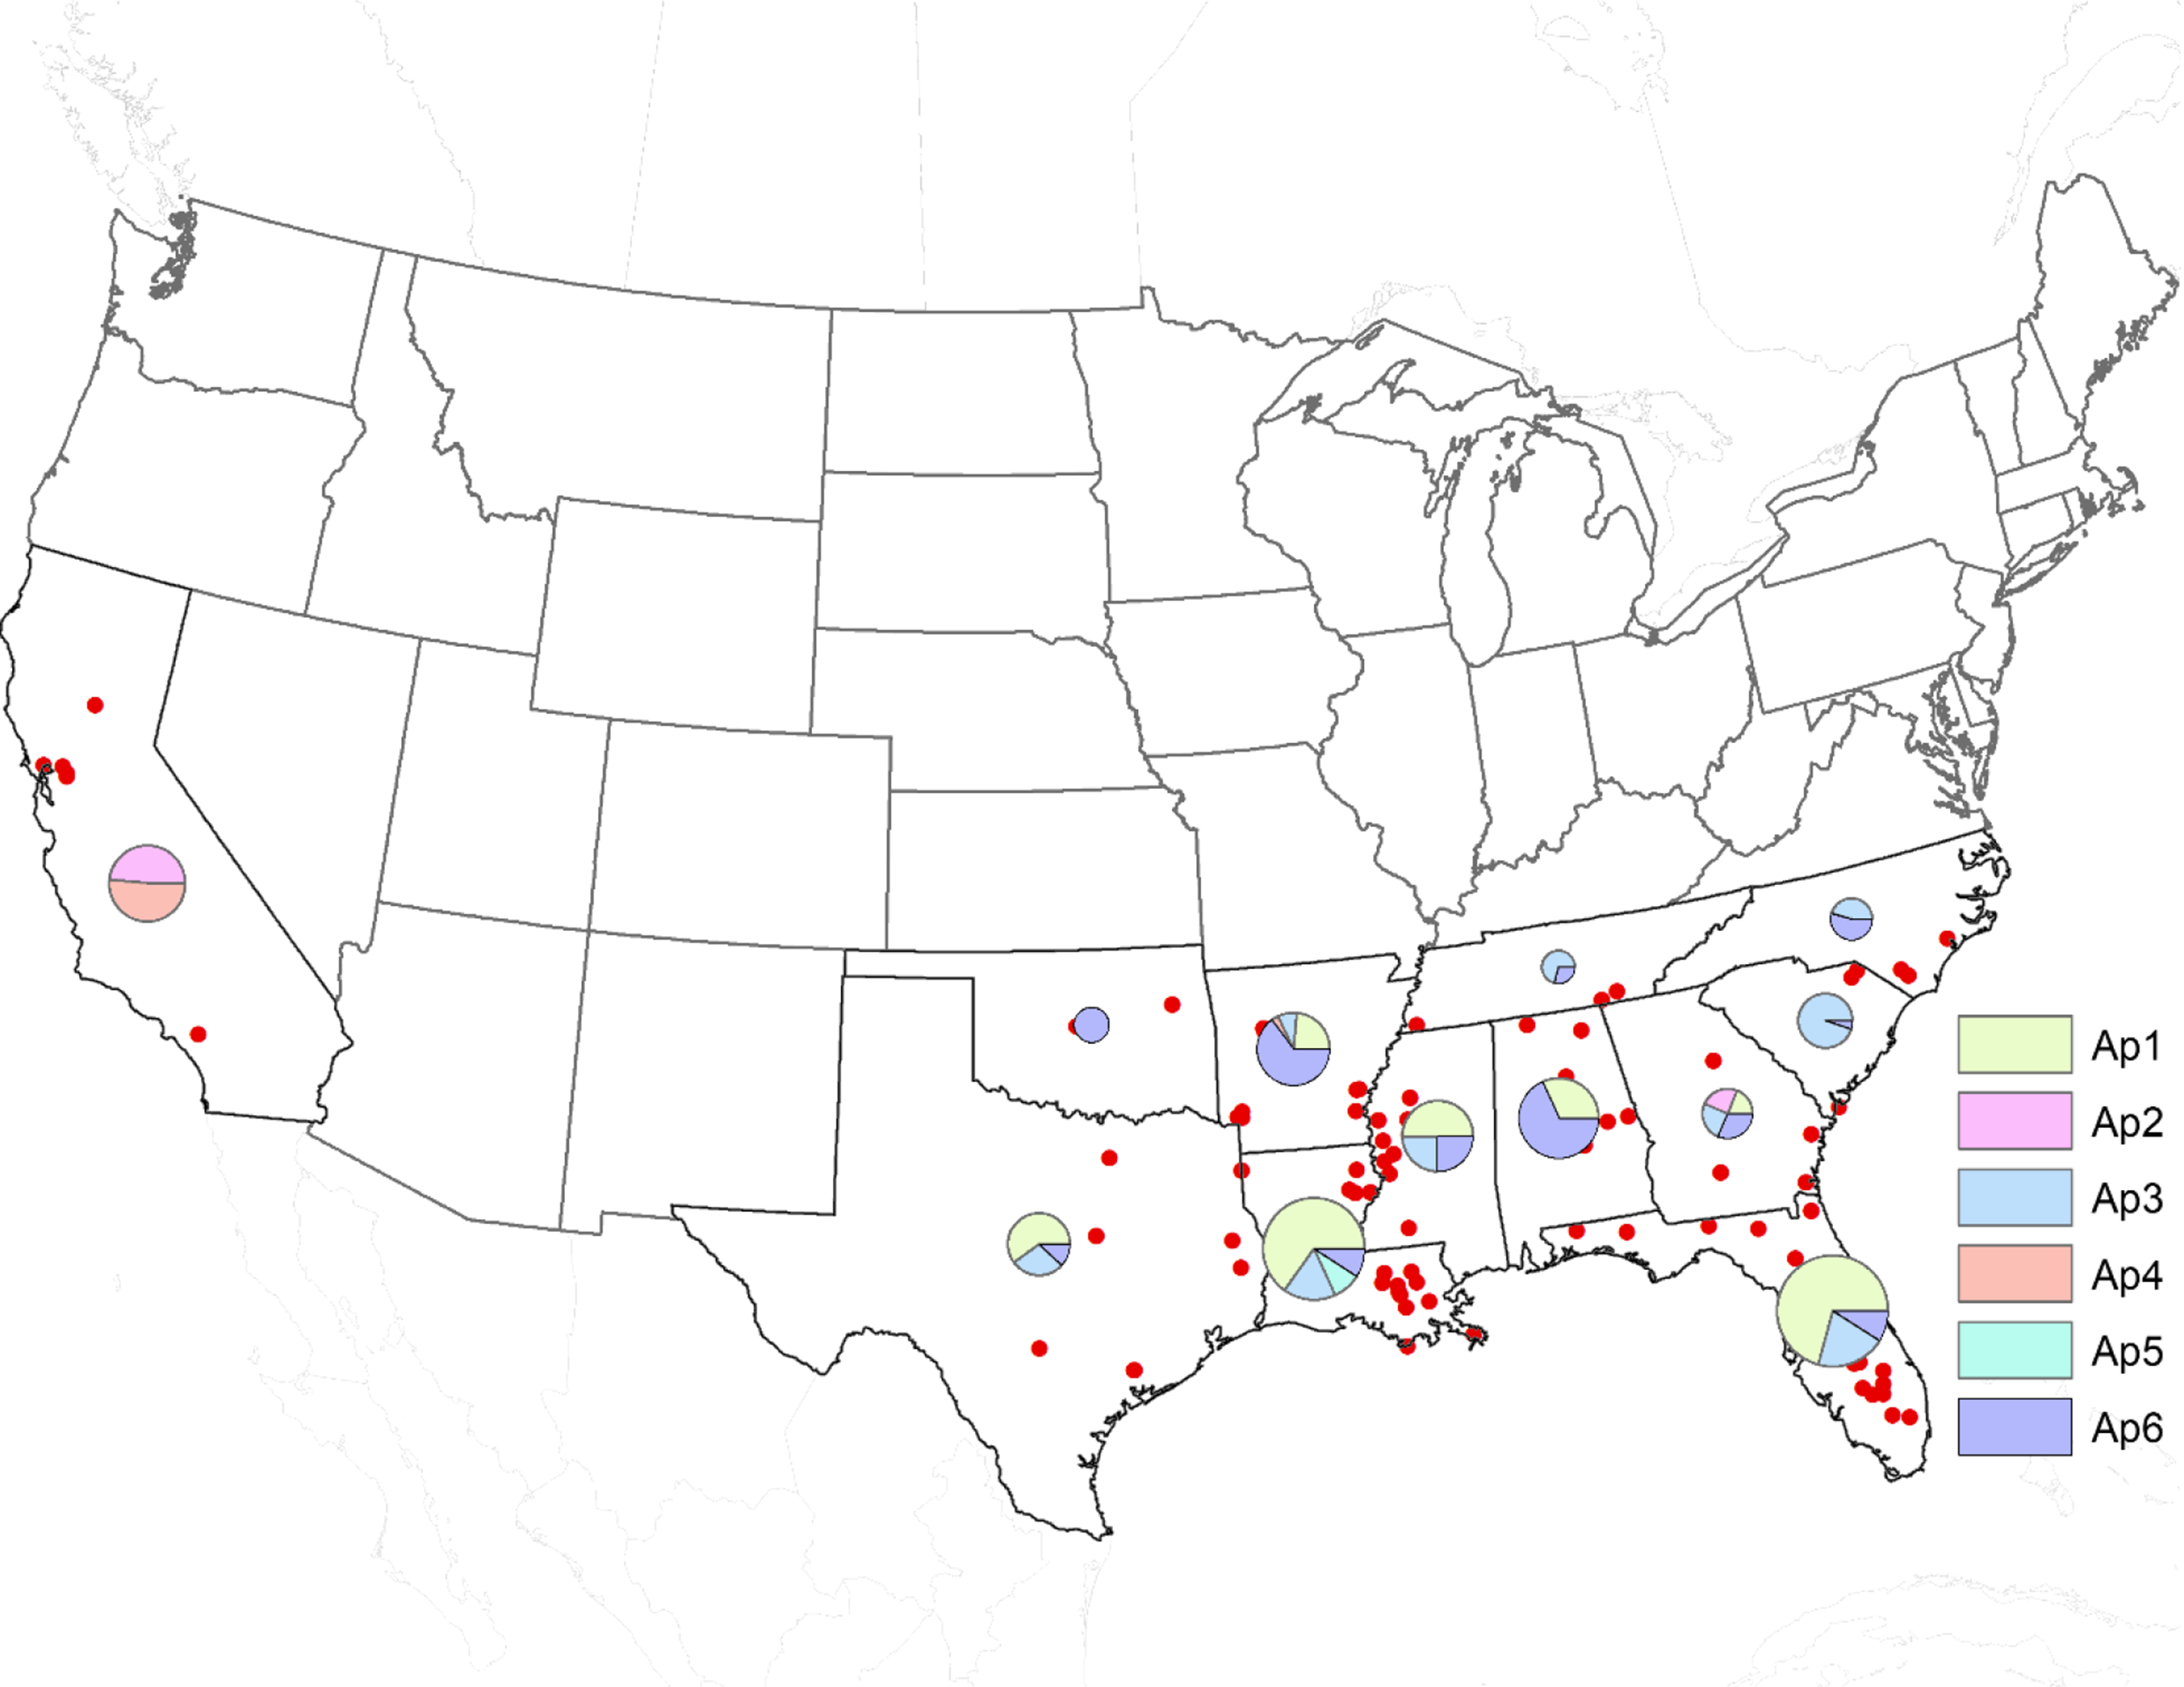
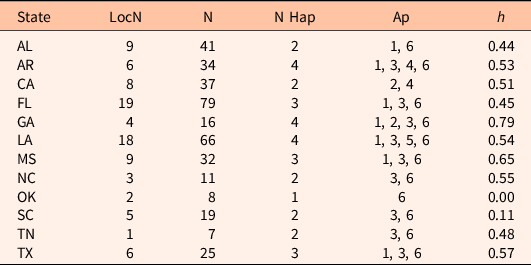
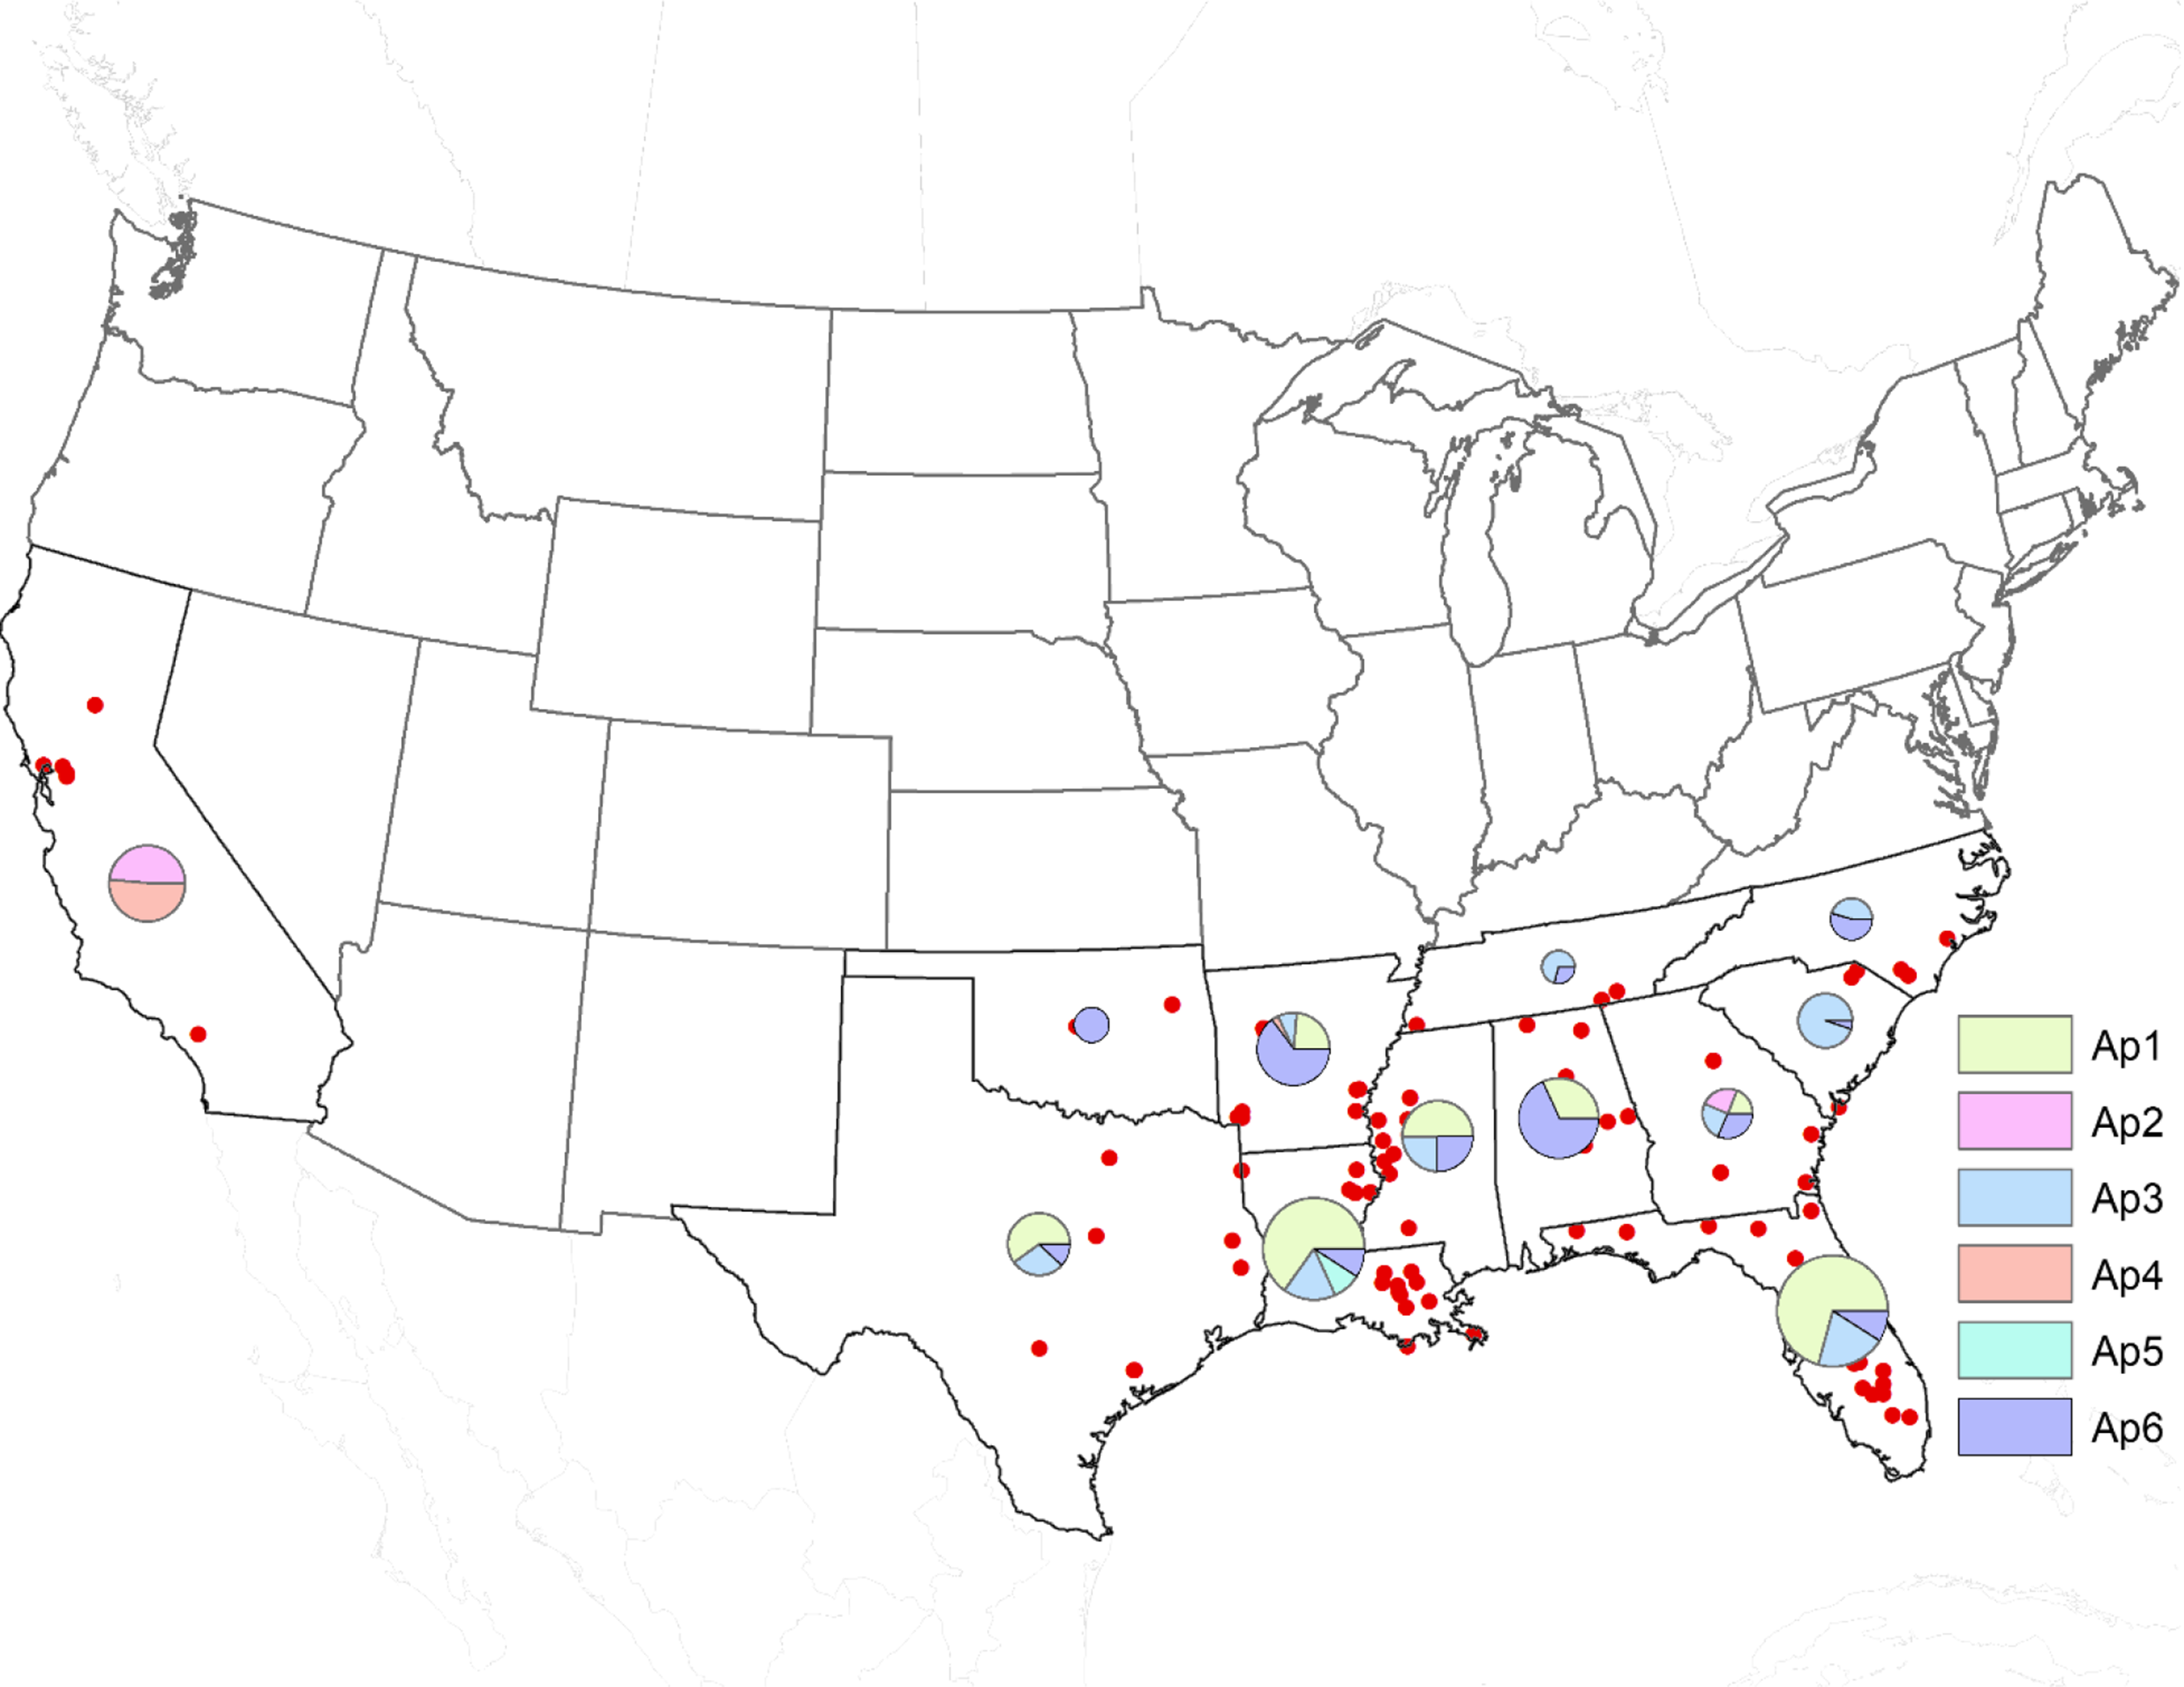
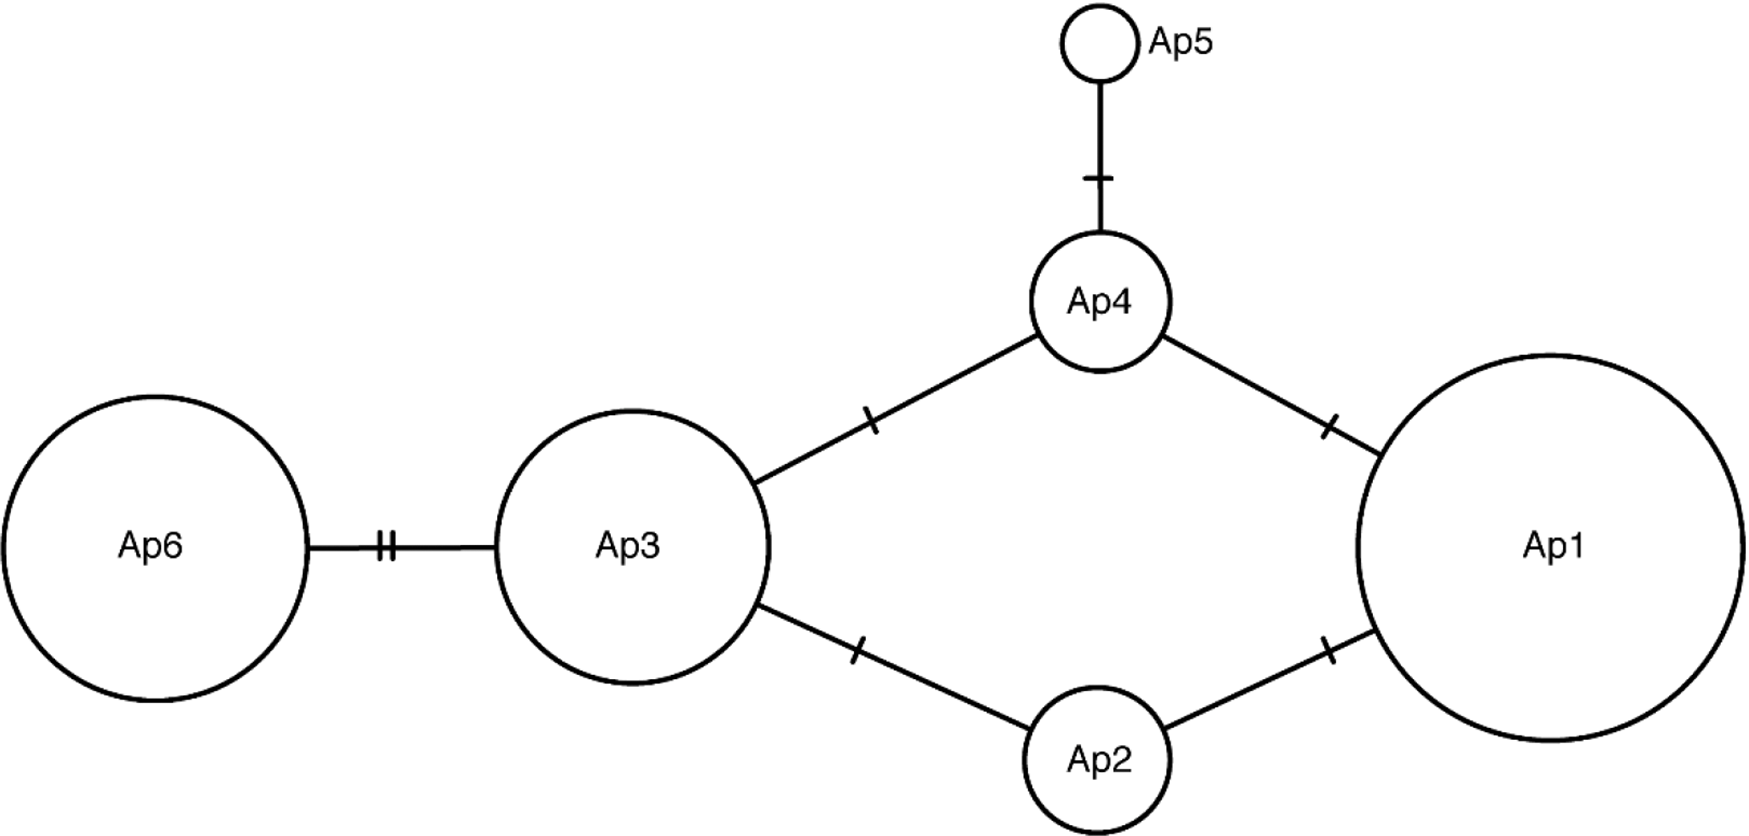
Six haplotypes were detected across the United States in 375 samples (Table 2; Figures 1 and 2). The majority of individuals had haplotypes Ap1, 3, and 6 (Figure 2). Most sites (74.4% of 90 sites) contained only a single haplotype, 24.4% contained two haplotypes, and 1.1% had three haplotypes. There was significant genetic structuring in the United States, as expected for a clonally spreading plant; AMOVA revealed that 20% of the variance was found within sites, 53% was found among sites (PhiPT = 0.80), and 27% was found among states (P = 0.001 in all cases). Haplotype diversity of A. philoxeroides within states was not correlated with the number of sampling sites (ρs = 0.09, P = 0.79). Haplotype diversity was lowest in South Carolina (h = 0.11) and highest in Georgia (h = 0.79) and averaged 0.48 ± 0.06 (SE) across states (Table 3). The lower Mississippi River and Arkansas River drainages together have high A. philoxeroides diversity, with five of the six haplotypes present (h = 0.64). This high number of haplotypes and diversity across different states suggests this plant was introduced multiple times. Other invasive clonally spreading aquatic weeds in the United States have fewer haplotypes. Hydrilla verticillata has three haplotypes in the United States and was introduced on three separate occasions (Madeira et al. Reference Madeira, Coetzee, Center, White and Tipping2007; Tippery et al. Reference Tippery, Bugbee and Stebbins2020) and hygrophila [Hygrophila polysperma (Roxb.) T. Anderson] has a single haplotype in the United States and appears to belong to a single clonal lineage (Mukherjee et al. Reference Mukherjee, Williams, Gitzendanner, Overholt and Cuda2016).
Six chloroplast haplotypes of Alternanthera philoxeroides in the United States.a
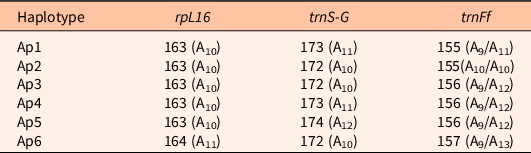
a Haplotypes are composed of three chloroplast regions. Their respective size in base pairs and their corresponding mononucleotide repeats are given. The trnFf region encompasses two separate mononucleotide repeats.
Sampling localities and chloroplast haplotypes for Alternanthera philoxeroides in the United States. The colored pie diagrams indicate the relative abundance of haplotypes (Ap1–6) in each state, and the red dots are sampling localities.
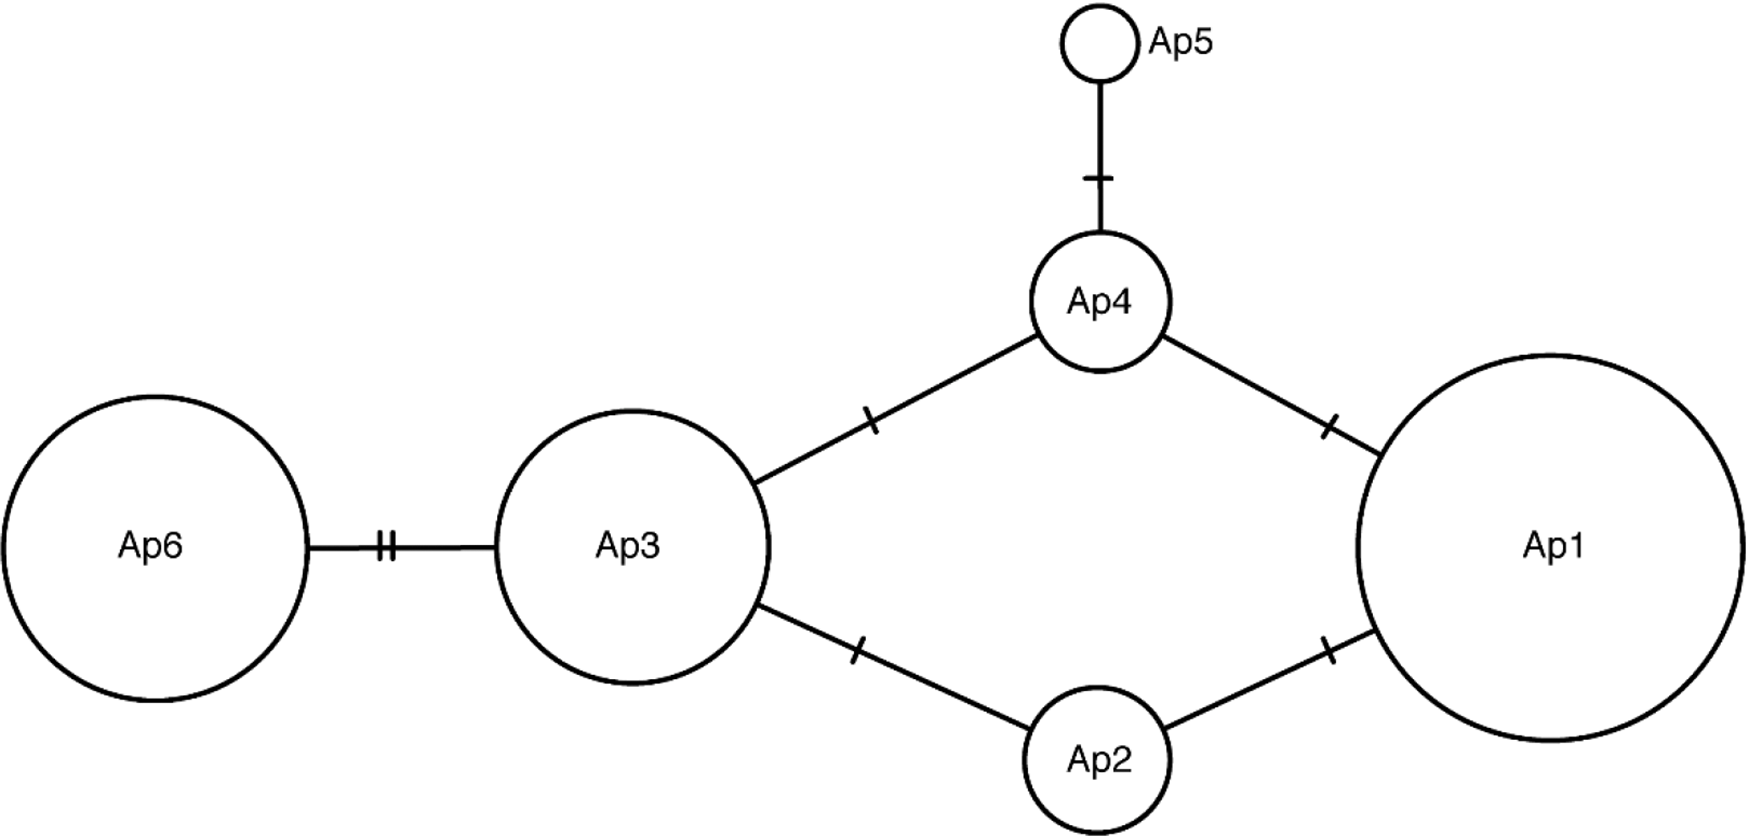
Haplotype TCS network for Alternanthera philoxeroides. Size of circles is related to relative abundance of each haplotype. Cross hatches on lines indicates one mononucleotide base difference between haplotypes.
Alternanthera philoxeroides genetic diversity in states at chloroplast loci.a
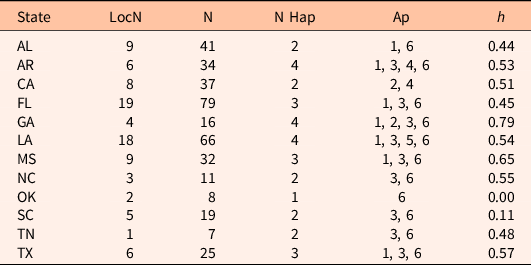
a Abbreviations: LocN, number of sampling sites; N, total sample size; NHap, number of haplotypes in each state; Ap, numbers correspond to haplotypes; h, haplotype diversity.
Some A. philoxeroides haplotypes are widespread (Ap1, 3, 6) and some appear to be relatively localized (Ap2, 4, 5), which is also consistent with a pattern of multiple introductions. California is also relatively distinct from the southeastern United States, although the two haplotypes in California were also found at one site each in the southern United States, suggesting they may have been moved between these areas. Haplotype Ap4 was found in historic invasion sites in southern California and in one sample from Arkansas, and Ap5 was found at three sites in Louisiana (Figure 1). Haplotype Ap2 was most common at recently invaded sites in northern California, suggesting a new introduction rather than dispersal from Ap4 populations in southern California, and Ap2 was also found in four samples from a single site in Georgia (Figure 1). The phylogeographic structure of A. philoxeroides in the entire native range will need to be described to better evaluate the introduction history and determine possible source regions.
Geographic and Climatic Patterns
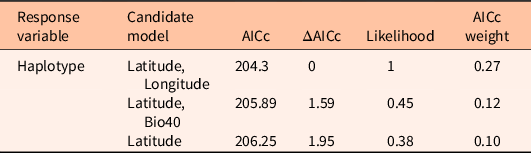
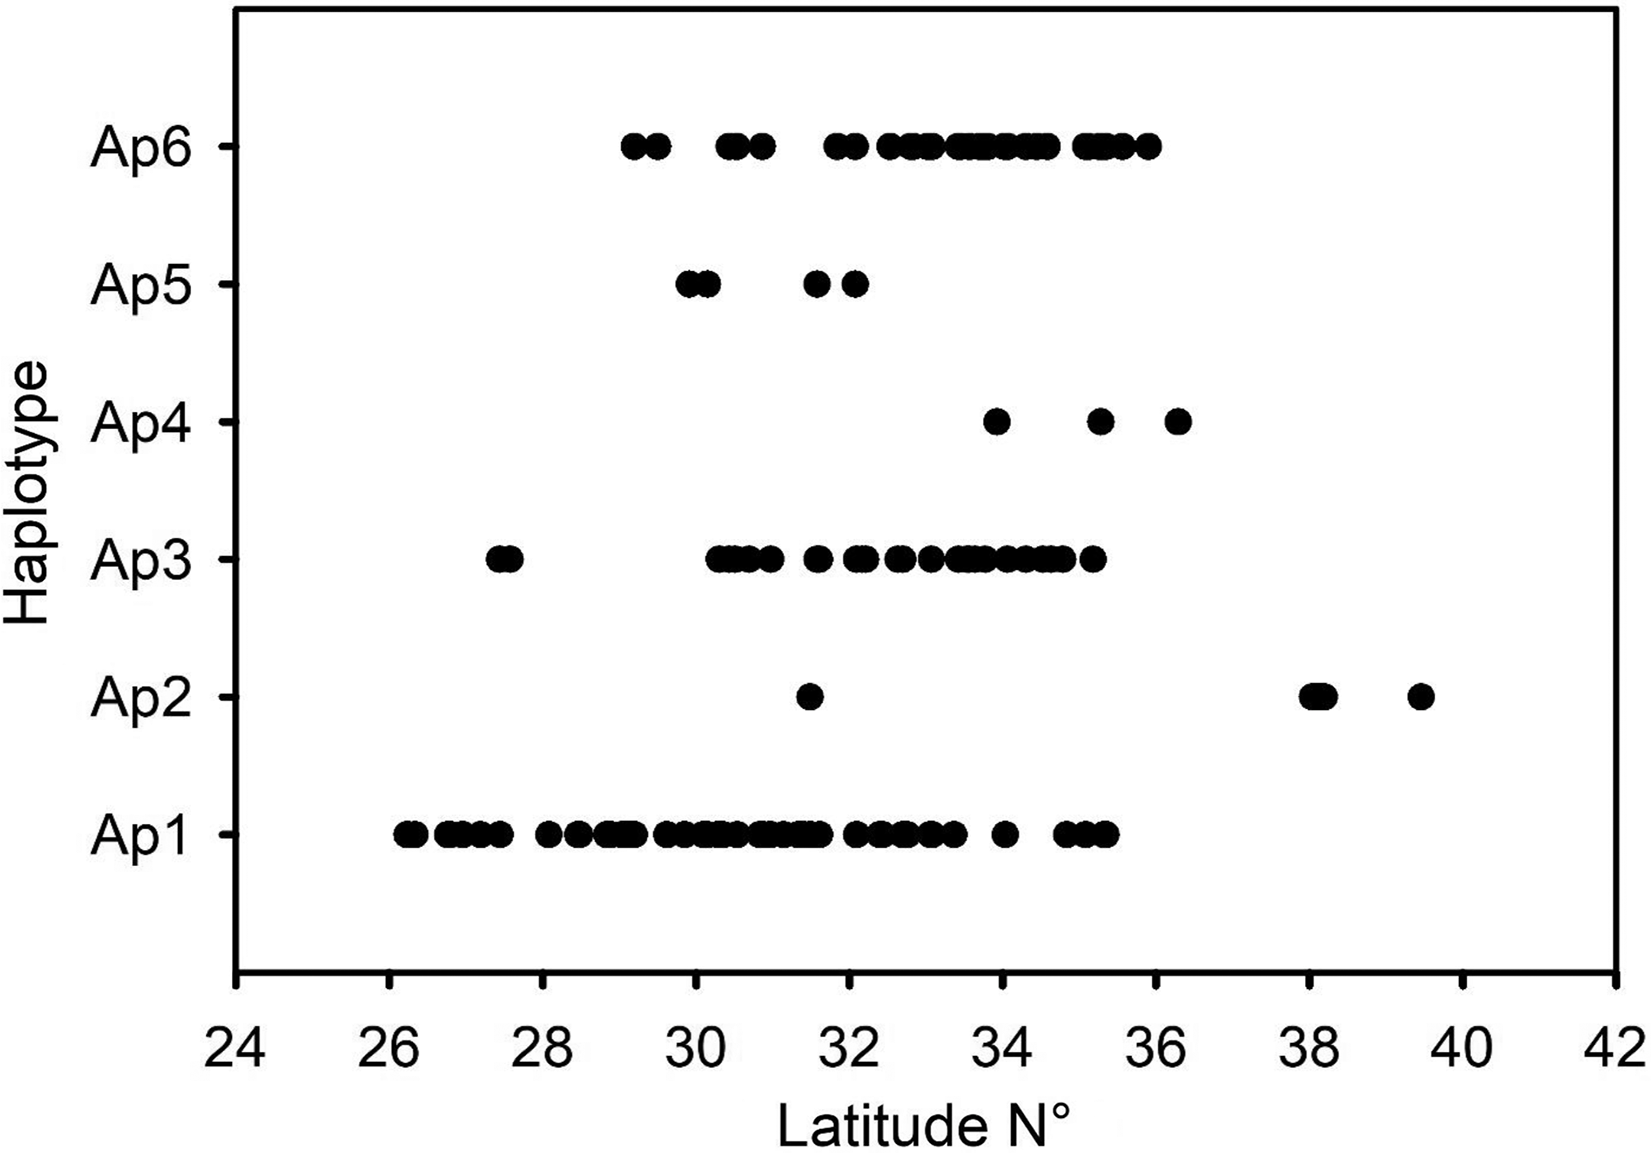
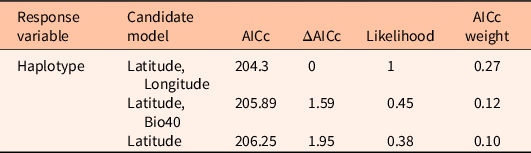
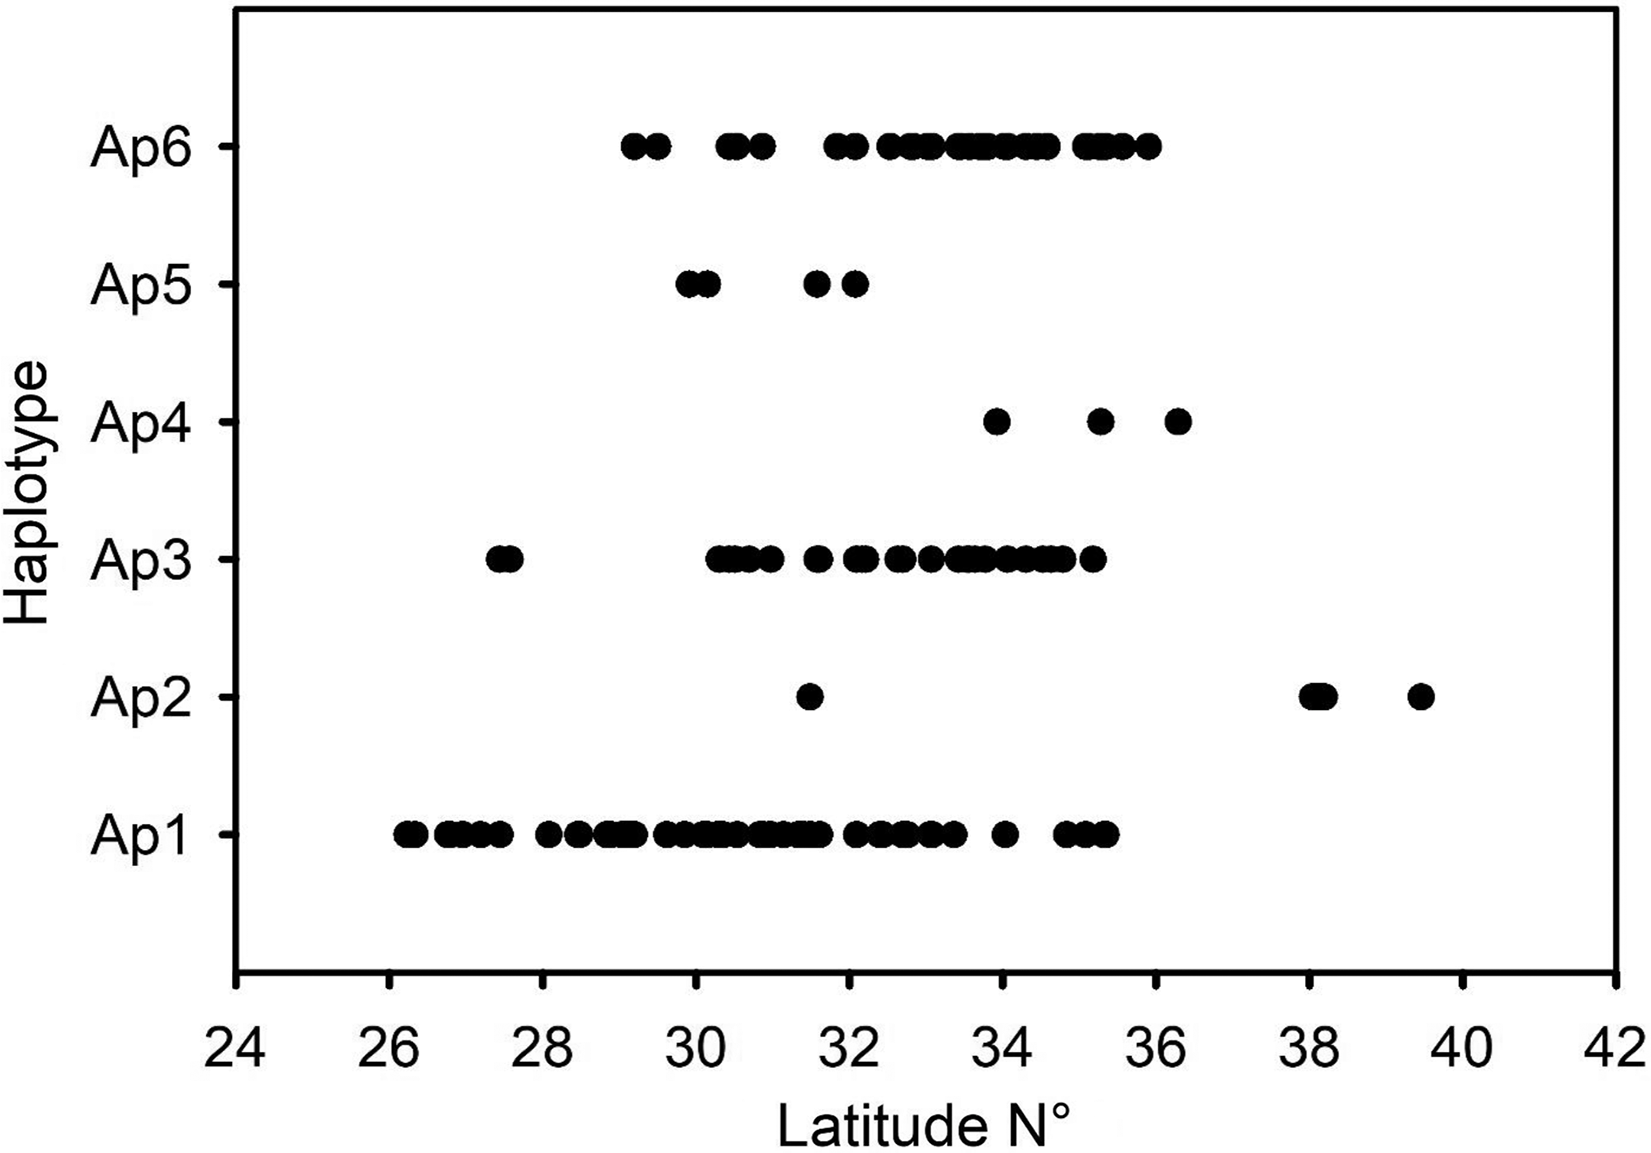
Latitude, longitude, and Bio40 were influential in explaining variation in the three most common haplotypes (Ap1, 3, 6) (Table 4; Figure 3). Three equally plausible models were identified by AICc (Table 4), and latitude was included in all three. The top model had only latitude and longitude (AICc weight = 0.27) and had twice the support of the next model, which had latitude and Bio40 (AICc weight = 0.12), and nearly three times the support of the third-best model, which had latitude only (AICc weight = 0.10). Latitude was common to all three models and was due to the relative abundance of haplotype Ap1 being negatively correlated to latitude (ρs = −0.88, P = 0.0008) and haplotype Ap6 being positively correlated with latitude (ρs = 0.96, P = 0.0005). Ap3 was widespread from Texas to Florida and did not covary with latitude. Latitudinal patterns in haplotypes may be related to introduction histories, historical control efforts, or environmental differences and deserve further study. Longitude may be related to differences across the southeastern United States in haplotype composition that may represent different introduction histories. Bio40, which appeared in one of the models, represents radiation during the warmest quarter (Bio26) and maximum weekly radiation (Bio21) (Kriticos et al. Reference Kriticos, Jarošik and Ota2014). Maximum radiation levels appear to be relatively high in the southeastern United States but lower in Florida and the East Coast (Kriticos et al. Reference Kriticos, Jarošik and Ota2014). Further studies will be necessary to determine whether A. philoxeroides haplotypes differ in their growth patterns under high and low radiation levels.
Top best-fit models explaining variation in Alternanthera philoxeroides haplotype, based on Akaike information criterion adjusted for small sample size (AICc) selection.
Dot plot of Alternanthera philoxeroides haplotype distribution in relation to latitude in the United States. Although all haplotypes are represented here, only common haplotypes 1, 3, and 6 were used in model selection.
Leaf Morphology and Plant Architecture
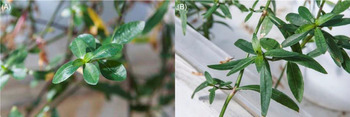
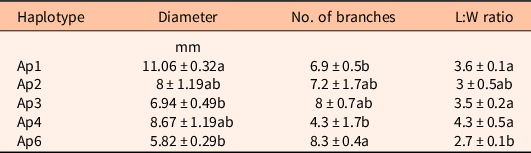
Alternanthera philoxeroides haplotypes Ap1 and Ap6 were clearly distinguished by all three morphological measurements in the study, with haplotypes Ap2, Ap3, and Ap4 displaying somewhat intermediate characteristics. The leaves of Ap1, Ap3, and Ap4 plants were more lanceolate in appearance, with significantly greater length-to-width ratios (3.6 ± 0.1, 3.5 ± 0.2, and 4.3 ± 0.5 cm, respectively) compared with the more ovate leaves of Ap6 (2.7 ± 0.1 cm) (Wald X 2 = 30.78; df = 4; P < 0.001) (Figure 4; Table 5). Stem diameters of Ap1 were approximately twice as large as those of Ap6, consistent with descriptions of broad- and narrow-stemmed biotypes (Wald X2 = 154.18; df = 4; P < 0.001). Branching from the main stem was significantly less frequent in Ap1 compared with Ap6; however, neither displayed branching that differed significantly from that of the intermediate haplotypes (Wald X2 = 12.60; df = 4; P < 0.013) (Table 5). Morphologically, Ap1 and 6 also correspond to descriptions of A. p. angustifolia, with a more northern distribution in South America, and A. p. philoxeroides, with a more southern distribution (Sosa et al. Reference Sosa, Julien and Cordo2004). These native ranges are also consistent with Ap1 being more common in more southern regions and Ap6 being more common in more northern regions of the United States. Whether Ap1 and 6 actually correspond to the two forms in the native range needs to be verified by genetically testing samples from the native range.
Narrow-stem (NSA)/Ap6 (A) and broad-stem (BSA)/Ap1 (B) Alternanthera philoxeroides biotype/haplotype.

Least squares means ± standard error for stem diameter, stem branching (total number of side branches off of main stem), and leaf shape (length:width ratio) for Alternanthera philoxeroides haplotypes. a
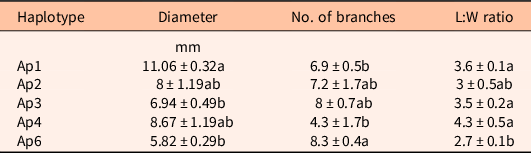
a Different letters indicate significant differences between haplotypes for a given measured variable.
Ploidy
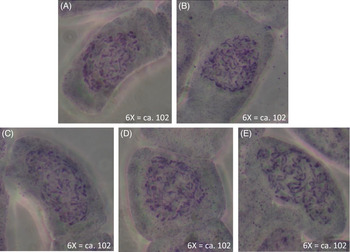
Invasiveness in plants is associated with both smaller genomes and high ploidy levels (Pandit et al. Reference Pandit, White and Pocock2014; Suda et al. Reference Suda, Meyerson, Leitch and Pysek2015; te Beest et al. Reference te Beest, Le Roux, Richardson, Brysting, Suda, Kubesova and Pysek2012). All chromosome counts from populations with haplotypes Ap 1, 2, 3, 4, and 6 were 6n = 102, indicating the invasive A. philoxeroides cytotype in the United States is hexaploid (Figure 5). Invasive A. philoxeroides populations in China are also hexaploid, consistent with invasive populations having higher ploidy levels. Chen et al. (Reference Chen, Xiong, Pan, Shen, Geng, Xu, Chen and Zhang2015) used flow cytometry to quantify genome size in four plants from Argentina, two from the United States (NSA and BSA), and one from China. Alternanthera philoxeroides in China had a genome size similar to that of a population in Argentina that is also known to be hexaploid (Sosa et al. Reference Sosa, Greizerstein, Cardo, Telesnick and Julien2008). Another sample from Argentina that was thought to be hexaploid had a DNA content that was similar to that of known tetraploids in Argentina, and the U.S. samples had genome sizes that suggested they were pentaploid. These results suggest that genome size in this species can vary within a ploidy level. The presence of hexaploids in the United States and China may be an advantage for control with A. hygrophila (Krug and Sosa Reference Krug and Sosa2019). Whether genome size per se might also impact biological control agents or is related to invasiveness in this species is unknown and deserves further study.
Representative composite images of Alternanthera philoxeroides cells with stained chromosomes: (A) haplotype Ap1 (Coosa River, AL); (B) haplotype Ap2 (Suisun Marsh, Montezuma Slough, CA); (C) haplotype Ap3 (Lake Wallace, SC); (D) haplotype Ap4 (Visalia, CA); and (E) haplotype Ap6 (Lake Micosukee, FL).

Conclusions
Most studies of A. philoxeroides to date have focused on differences between plants from the native and invaded range and explored development and performance of the biocontrol agent or plant defensive responses rather than biomass response (equivalent to successful control) of the plants to feeding (Liu et al. Reference Liu, Zhou, Pan, Zhang, Traw and Li2018; Pan et al. Reference Pan, Jia, Fu and Li2013; Zhang et al. Reference Zhang, Zhou, Pan, van Kleunen, Liu and Li2019). It will therefore be valuable to determine how effective the currently available biological control agents will be on the introduced haplotypes. Our data suggest that haplotypes Ap1 and 6 correspond to the NSA and BSA biotypes, which respond differently to both A. hygrophila herbivory and herbicides (Kay Reference Kay1992; Kay and Haller Reference Kay and Haller1982). Anecdotal observations in the native range also suggest that A. p. philoxeroides may be less commonly attacked by A. hygrophila than A. p. angustifolia (Sosa et al. Reference Sosa, Julien and Cordo2004). In combination with climatic limitations in some parts of the invaded range, genetic differences among haplotypes may lead to reduced control and encourage foreign exploration for additional agents that are better adapted to specific haplotypes and climates.
If future studies determine that genotypes differ in their invasiveness (e.g., varying growth rates) or respond differently to control measures, then it may be necessary to consider that different areas will need different management strategies. Florida and South Carolina, for instance, have mainly a single invasive haplotype, so plants may respond more uniformly to a single control strategy. In contrast, the Mississippi River drainage has a variety of haplotypes, and therefore may require a variety of control strategies depending on the population genetics and specific locality. The cpDNA genotyping we developed in this study provides a quick method to determine which haplotypes are present in a given area.
Acknowledgments
We thank the following people for assistance in sample collection or processing: Jim Cronin, Julie Nachtrieb, Aaron Schad, Lynde Dodd, Brett Hartis, Keith Thomas, Rachael Klopfenstein, Chris Beals, David Webb, Curtis Tackett, Diana Rashash, Tim Harris, David Lattuca, Chelsea Bohaty, Mariah McInnis, Ram Medrano, Al Cofrancesco, Rodrigo Diaz, Kurt Getsinger, Stacey Springfield, Derek Medina, Mike Pitcairn, and Robin Carter-Ervin. Daniella Biffi helped with laboratory work. Funding was provided by the U.S. Army Engineer Research and Development Center, Aquatic Plant Control Research Program. No conflicts of interest have been declared.