Comparisons of the frequency and duration of NBER-dated recessions and expansions indicate that post–World War II expansions are twice as long as their pre–World War I counterparts, with post–World War II recessions occurring less frequently. However, Christina Romer demonstrates that, contrary to modern NBER practices, the monthly peaks and troughs between 1884 and 1927 were derived using detrended data that dated prewar peaks earlier and troughs later vis-à-vis postwar turning points derived from data in levels.1
Indeed, Mark Watson shows that when post–World War II (henceforth, “postwar”) cycles are based solely upon nominal price data for commodities, crude materials, and financial instruments, subsequent differences in cyclical properties between the pre–World War I (henceforth, “prewar”) and postwar periods appear small.
Do the systematic dating errors that Romer documents for the post-1884 NBER chronology affect earlier peaks and troughs? How reliably could early NBER researchers judge if and when a recession occurred before the Civil War if they only had access to scattered press reports and “prices current” listings of commodity prices? Did persistent deflationary episodes lead the nineteenth-century NBER chroniclers to mistake declines in nominal aggregates for falls in real output?
In this article, I propose an alternative set of annual peaks and troughs between 1796 and 1914 by mapping to the absolute peaks and troughs in a new dataset: my annual index of U.S. industrial production.4
The resulting chronology alters more than 40 percent of the peaks and troughs, and removes those cycles long considered the most questionable. An important result of the new chronology is the lack of discernible differences in the frequency and duration of industrial cycles among the pre–Civil War, Civil War to World War I, and postwar periods.
REEVALUATING THE PREWAR NBER BUSINESS-CYCLE CHRONOLOGY
As is well known, Willard Thorp's Business Annals (published in 1926) marks the first step that the then-recently-formed National Bureau of Economic Research (NBER) took toward identifying business-cycle turning points. The Business Annals are a brief summary and interpretation of U.S. economic conditions in every year from 1790 through 1925 based upon contemporaneous business and popular press reports. Thorp compiled these by consulting extant newspapers and other trade publications held at the New York Public Library. In doing so, he formed an annual “phrase summary” across four broad categories: industry, commerce, and labor; money, security, and foreign exchange markets; agricultural production and farm prices; and non-economic phenomena, such as political events, wars, and catastrophes. He then qualitatively weighed the four narrative summaries to classify business conditions into one of four phase cycles: depression, revival, prosperity, and recession.5
For example, Thorp's phrase summary for 1813 is simply “prosperity,” but his assessment of 1847 is “revival; prosperity; panic; recession.” On several occasions, Thorp interjected adjectives to indicate the relative severity of a contraction, such as “deep depression” for 1894 or “mild depression” for 1911.
Thorp gave primacy to industrial and commercial activity in arriving at his aggregate assessment.
Thorp's anecdotal-based assessment of annual business conditions still underpins the conventional dating of recessions between 1790 and 1915. This is true because Wesley Mitchell mapped one-for-one Thorp's inflection years marked recessions and revival as “peaks” and “troughs,” respectively, to serve as the critical foundation for the NBER's business-cycle chronology.6
Mitchell, “Business Cycles” and Business Cycles, 387, Table 23. The term recession was a novel one suggested by Wesley Mitchell (Thorp's dissertation advisor at Columbia) to replace the more vague and confusing term crisis found in previously written and often-contradictory business annals unaffiliated with the NBER. Mitchell's use of the term recession marked the NBER's attempt at discriminating “periods of dull business” from the less obvious effects of financial panics during the nineteenth century.
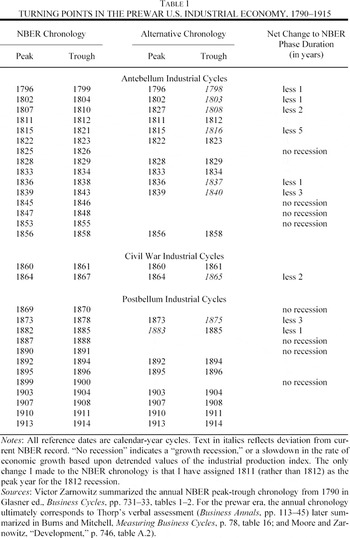
These are shown in the first two columns of
Table 1.
New Dates from New Data
I have constructed an alternative set of annual peaks and troughs for the 1796–1915 period as a basis for evaluating the reliability of Thorp's annual business cycles. The alternative chronology is based upon an entirely new annual dataset on U.S. industrial production in my recent article that is similar to the Federal Reserve Board's present-day industrial production series.7
Davis, “Quantity-Based Annual Index.”
The Davis index assembles 43 annual components in the manufacturing and mining industries that are consistently defined from 1790 until World War I.8
The relative importance of the 43 components in the Davis index changes over time by using two separate base years (1850 and 1880) and linking the overlapping series in chronological segments. The index possesses complete industry coverage after 1826, with moderate attrition back through 1790. The attribution of annual fluctuations in the aggregate index to any single component series may vary from year to year based upon additional factors, including data attrition and the emergence of new products. See Davis, “Quantity-Based Annual Index … An Empirical Appraisal” and “Quantity-Based Annual Index” for complete details.
It is a comprehensive industrial output measure in so far as its components directly or indirectly represent close to 90 percent of the value added produced by the U.S. industrial sector during the nineteenth century. Changes in this index reflect only fluctuations in real output.
I adopted my dating algorithm from Romer to develop an alternative prewar chronology of annual peaks and troughs for the U.S. industrial sector.9
Romer, “Remeasuring Business Cycles.”
Because I consult annual data to date peaks and troughs, the methodology is quite simple: A year immediately preceding an absolute decline in the aggregate level of Davis's industrial production index defines a peak, and the last consecutive decline following a peak defines a trough.
10 I had to exclude the long U.S. expansion from 1790 through 1796 from the analysis because the validity of Thorp's 1790 trough cannot be addressed without an index that spans the 1780s.
The new, alternative prewar chronology is listed in the middle columns of
Table 1.
Limitations of Approach
This simple approach in establishing peaks and troughs possesses at least four shortcomings compared to how the NBER currently identifies turning points. First, the present study consults only one annual series to date prewar cycles. By comparison, the modern NBER dates (including the annual ones) are based on a vast database of monthly series that gauge consumer and business activity across a wide array of manufacturing and nonmanufacturing industries.
Second, the Davis index for 1790–1915 may not be as reliable a cyclical measure as the Federal Reserve Board's (FRB) index of industrial production, which is considered among the most important coincident indicators of U.S. business cycles. Conceptually, the Davis and FRB indexes attempt to measure the same fundamentals, namely the level of physical production in the nation's manufacturing and mining industries. However, the FRB index, which begins in 1919, consists of a larger set of underlying components, ranging from 60 series in 1919 to more than 200 series by the 1950s.11
U.S. Board of Governors, Industrial Production, p. 63, Table 5.1.
Although there is no period of overlap between my series and the FRB industrial production index, I can gauge the relative cyclical sensitivities of the two series by regressing logarithmic growth rates in each index on a third industrial production index developed by Jeffrey Miron and Romer that partially spans both.12
Miron and Romer, “New Monthly Index.”
Regression analysis shows that the annual fluctuations in the Davis index (for the 1885–1915 period) and those in the FRB index (for the 1920–1940 period) are each less sensitive to the cyclical swings represented in the Miron-Romer index.
13 For the FRB index, the beta coefficient on log differences in the Miron–Romer index is 0.82, with a t-statistic of 7.14 and an adjusted R2 of 0.82. For the Davis index, the beta coefficient is 0.73, with a t-statistic of 7.72 and an adjusted R2 of 0.59. The smaller beta for the Davis index is likely due, in part, to the over-representation of raw materials among the 13 components in the Miron-Romer index.
The coefficients on the log differences in the Miron-Romer series are similar for the two indexes, suggesting that the Davis index is as appropriate a coincident indicator for the prewar period as the FRB index is for the post–World War I era.
A third limitation of the present study is that it relies on industrial production rather than a more comprehensive output measure such as GDP. This choice was made on grounds of reliability and consistency. Whereas improved estimates of postbellum U.S. GDP are available, similarly reliable estimates for the antebellum period are not.14
See, for example, Balke and Gordon, “Estimation.”
Although Robert Gallman compiled annual gross output estimates for the 1834–1859 period, the Gallman GNP series is heavily benchmarked, and annual observations in Gallman's commodity output series (the primary cyclical component of the GNP estimates) were interpolated on a hodge-podge of spliced sources. In fact, Gallman was never sufficiently confident of the reliability of his annual estimates to publish them, and he regularly chastised researchers who attempted to use them in an analysis of early American business cycles.
15 See Rhode, “Gallman's Annual Output Series”; and Davis, “Quantity-Based Annual Index … An Empirical Appraisal” and “Quantity-Based Annual Index” for details. Rhode (“Gallman's Annual Output Series,” p. 12) points out that a 1963 mimeograph from Robert Gallman containing the annual data circulated with the following disclaimer: “NOTE: These figures should not be regarded as reliable, annual estimates. They were derived for the purpose of computing decade averages and are supplied to interested technicians for testing, not for analysis as annual series.”
Peaks and troughs in my industrial production index are indicative of absolute peaks and troughs in broader economic conditions because the industrial sector has historically derived demand directly from nonindustrial occupations, particularly farmers, merchants, and the construction trades. This synchronous relationship between nonindustrial and industrial sectors is precisely why, even today, the Federal Reserve's industrial production index is classified as a coincident indicator of U.S. business cycles even though the industrial sector currently accounts for roughly the same share of U.S. GDP as it did in 1840.
A fourth limitation of this study is the reliance upon annual data to isolate cyclical turning points. Although it is true that Arthur Burns and Mitchell set the lower bound of a business cycle at no less than one year, they also noted that setting turning points from annual data may lead to measurement problems because yearly changes can obfuscate a minor cycle.16
Burns and Mitchell, Measuring Business Cycles.
For example, a small recession in the middle of a year may just show up in annual data as a year of weak growth, not as an actual decline. Although the present study's revised chronology does capture the brief prewar downturns of 1812 and 1861, other peaks and troughs could be distorted if the turning point occurred toward the middle of a calendar year.
Spurious NBER cycles
Table 1 reveals important similarities but also key differences between the NBER reference years and those peaks and troughs derived from my physical-output data. For one, the new industrial production index does not generate any “false signals” by furnishing a cycle that has not previously been identified by NBER economists. Rather, 21 cycles in my revised chronology correspond exactly with the incidence of NBER cycles.
The revised business-cycle dates, based upon my data, are notably more selective in isolating genuine contractions. The new chronology dismisses several NBER recessions as merely growth cycles. Overall, my new set of prewar peaks and troughs removes eight out of the 29 prewar NBER recessions because they are either growth cycles or entirely spurious selections.17
By convention I differentiate a growth cycle from a spurious one simply by examining whether the trend-adjusted series is falling. The index was detrended using a band-pass filter.
The revised dating removes four cycles from both the antebellum and postbellum period, suggesting that my identification of spurious cycles is not the result of time-series data reflecting the continued industrialization of the prewar American economy.
This article is not the first to question the validity of several postbellum downturns. The elimination of the four NBER postbellum recessions (1869–1870, 1887–1888, 1890–1891, and 1899–1900) is consistent with other postbellum output measures which suggest that these NBER recessions should be reclassified as growth cycles. The identification of these spurious recessions will not surprise many economic historians. Burns and Mitchell rank the 1887–1888 contraction as the mildest of the prewar period.18
Burns and Mitchell, Measuring Business Cycles, p. 403.
Rendigs Fels goes further in stating that “the only difference of opinion to be found in the literature is whether it should be recognized as a cyclical contraction at all.”
19 Fels, American Business Cycles, p. 142.
Similar contentions have been long voiced with respect to the apparently minor 1869–1870, 1890–1891, and 1899–1900 recessions.
20 Hull, Industrial Depressions; Fels, American Business Cycles; Mishkin, “Asymmetric Information”; Romer, “Remeasuring Business Cycles”; and Temin, “Causes.”
Indeed, Thorp affixes the word “brief” in front of each of these three contractions.
The alternative chronology in Table 1 also identifies four spurious recessions for the antebellum period: 1825–1826, 1845–1846, 1847–1848, and 1853–1855. According to my industrial production index, the NBER reference cycles for 1826 and 1855 are, in fact, growth cycles. Moreover, whereas certain commodity-producing industries are stagnant in my data set in 1854 and 1855, many durable goods manufacturers posted tremendous growth. This is particularly the case for merchant shipbuilding, where a construction boom in clipper ships resulted in the highest gross tonnage built at any time during the nineteenth century.
Recessions for 1845–1846 and 1847–1848 appear even more dubious than the growth cycles of 1826 and 1855. Expansion in industrial activity during the purported NBER troughs of 1846 and 1848 was apparently robust and broad based. Growth rates in the Davis index are 15.0 percent and 8.3 percent, respectively. Such industrial strength confirms what numerous studies have previously suspected regarding these questionable dates adjoining the Mexican War. Otto Lightner notes that the cycles of the late 1840s were “short and not so thorough and widespread in its effects,” and Leonard Ayres argues that there was “no real depression” during the period.21
Lightner, History, p. 139); and Ayres, Turning Points, p. 11.
Victor Zarnowitz examines closely the scant statistics available for the mid-1840s and 1850s and concludes “it is possible that in terms of production, all that happened was a phase of below-average growth rather than an actual decline of cyclical proportions.”
22 Zarnowitz, Business Cycles, chap. 7, 220–23.
A Robustness Check: Breadth Versus Depth
Although absolute rises and declines in an aggregate output measure constitute a necessary first step toward locating cyclical turning points, Burns and Mitchell also emphasized that future business cycles should consider the breadth of changes in economic activity.23
Burns and Mitchell, Measuring Business Cycles.
The word “future” is emphasized because Romer finds that volatile movements in only one or two component series often drove the fluctuations in many nineteenth-century nominal business condition measures.
24 Romer, “Remeasuring Business Cycles.”
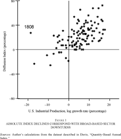
In order to examine whether this phenomenon plagues my new prewar chronology, I can compare the year-to-year changes in my index (i.e., “depth”) with a diffusion index of its components (i.e., “breadth”). A diffusion index is a common measure of the breadth in business activity because it represents the
net fraction of industries that are expanding.
25 More specifically, a diffusion index is calculated as the percentage of industries expanding less the percentage of industries contracting. A diffusion value of zero means that an equal number of industries are expanding and contracting.
The scatter plot in Figure 1 presents the growth and diffusion measures for each prewar year beginning in 1800. Figure 1 reveals an important regularity: the diffusion index is never negative when the Davis industrial production index rises. The blank lower right quadrant is reassuring because it is consistent with the NBER's modern-day concept of an expansion: real output is growing and the growth is broad based. Indeed, the diffusion index rises significantly above zero during an industrial depression in only one instance—the Embargo of 1808. It is now widely recognized that the Jeffersonian embargo had a dichotomous impact on the American manufacturing sector, stimulating import-competing “infant” industries such as textiles on the one hand, while hammering trade-dependent industries such as shipbuilding.26
Irwin and Davis, “Trade Disruptions.”
FIGURE 1 ABSOLUTE INDEX DECLINES CORRESPOND WITH BROAD-BASED SECTOR DOWNTURNS
Accurate Peaks and Inaccurate Troughs: Possible Factors
Closer inspection of the NBER and alternative reference years reveals systematic differences between the common cycles. The characteristics of the revisions in the officially measured peaks and troughs can be seen in the summary data of Table 2. The most salient feature of the revised chronology is that troughs are consistently dated earlier than those inferred from the Business Annals. Of the 21 common troughs, the revised chronology predates eight troughs and never generates a later bottom. Conversely, the revised peaks proposed by the Davis index agree with 20 of the 21 peaks shared by the NBER reference set.
Because such turning-point asymmetry exists before and after the Civil War, Thorp's Business Annals is the likely source of the historical dating biases. But why do these differences exist? Table 2 supports the contention that the popular and trade press of the prewar period were more likely to pinpoint the beginning of economic downturns accurately than upturns from subsequent bottoms.27
Other researchers examining the contemporaneous commentary of nineteenth-century business cycles have made similar observations. Zarnowitz (Business Cycles, p. 219) suggests that “after a strong expansion, a mild decline (or even only a slowdown, if sufficiently long and diffused) may cause as much discomfort and alarm as a larger decline coming from a weaker expansion. Hence it is possible that observers would tend to overstate the dimension of some movements in the former category, perhaps even mistaking at times a major retardation for a business contraction.” Indeed, Mitchell (Business Cycles, pp. 421–22) suggests that press reports tended to devote “less attention to the upward than the downward turning points of business cycles.”
In an era devoid of routine government economic reports, significant declines in production were easier for the casual observer to detect. Conversely, the
Annals were less successful in isolating troughs in industrial activity primarily because contemporary newspapers tended to portray business conditions as “still weak” following a downturn. The prevailing evidence suggests that Thorp tended to interpret such cryptic narratives as a “revival” from an economic bottom in his top-line conditions, even though they often seem (in retrospect) to have referred to a return-to-peak “revival” in business conditions. This may help explain why recessions appear more drawn out in the early chronology.
Another contributing factor to the systematic peak-trough revisions could stem from Mitchell's strict interpretation of Thorp's annual inflection points. It is not entirely clear, for instance, whether Thorp's notion of “revival” was to be interpreted as a bottom in economic activity, or a phase rebounding from a bottom. Because the two interpretations may not always agree in an annual setting, Mitchell may have introduced biases in the mapping that may have tended to elongate prewar annual recessions.
Another potential bias is the strong influence that fluctuations in wholesale and commodity prices apparently had on confirming turning points in the Business Annals. Thorp consulted a limited number of economic statistics (mostly wholesale prices) that were available during the 1790–1925 period to confirm his descriptive assessments.28
Thorp makes repeated reference to movements in wholesale commodity prices in his analysis, and in fact thanks Walter Smith, co-author of the seminal 1935 volume Fluctuations in American Business, 1790–1860, for providing him the price data. See p. 105 of Thorp's prefatory note, which, incidentally, is mistyped. Thorp thanks Smith for providing him with monthly wholesale price data for the period 1805–1824; the correct period is 1805–1924.
But were rises and declines in aggregate wholesale price indexes for the nineteenth century a reliable gauge of the state of the nation's business conditions? Over the 1790–1915 period, annual fluctuations in wholesale prices and industrial production are positively correlated, but the correlation coefficient is only approximately 0.4. One explanation for why the correlation was not higher may be the stark differences in the prewar trends of the price and output indexes. For instance, one can show that the Warren-Pearson wholesale price index is stationary over the nineteenth century.29
Augmented Dickey-Fuller tests reject the null hypothesis of a unit root in the price index at the 5 percent level.
Because Thorp closely tracked the local commentary on commodity prices, persistent price deflation during long stretches of the 1800s likely exacerbated the
Annals'
s tendency to elongate recessions.
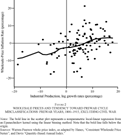
Figure 2 demonstrates that years characterized by vigorous industrial output growth (declines) were generally accompanied by inflation (deflation). Yet the fact that a nonparametric fit of
Figure 2's scatter plot crosses below the origin underscores an inherent bias in the prewar NBER chronology: periods of modest albeit positive real output growth (i.e, growth cycles) tended to be accompanied by price deflation.
FIGURE 2 WHOLESALE PRICES AND TENDENCY TOWARD PREWAR CYCLE MISCLASSIFICATIONS: PREWAR YEARS, 1800–1915, EXCLUDING CIVIL WAR
One could even argue that the biases that generated drawn-out prewar recessions in the NBER chronology were largely reinforcing. Because price quotations for various basic commodities (i.e., cotton, flour, iron) were widely circulated in nineteenth-century newspapers but traded quantities were not, it is probable that press reports were heavily influenced by price movements, particularly for farm products. The fact that Thorp consulted the same wholesale-price data in identifying prewar cycles—coupled with the fact that Mitchell often consulted indexes of business conditions heavily skewed with price components to “check” Thorp's assessments—suggests that prices played a key secondary role in setting nineteenth-century peak and trough years.
IMPLICATIONS OF THE REVISED PRE–WORLD WAR I CHRONOLOGY
General Implications
The new chronology contributes to our understanding of the characteristics of early American business cycles. Broadly, the prewar chronology alters (by either dropping or redating) roughly 40 percent (25 of 58) of the prewar NBER peaks and troughs. The largest changes in the duration of common cycles involve periods when wholesale prices dropped dramatically and persistently, such as following the War of 1812 and the financial panics of 1837 and 1873. The quantity-based production data display shorter contractions and shallower losses following these crises than those portrayed in the popular and trade press. One plausible explanation for the disparity may be that the media confused commercial crises with financial ones, because the latter were better characterized by falling commodity and security prices, rather than declines in real industrial activity.30
Temin, Jacksonian Economy; and Kindleberger, Manias.
Antebellum-Postbellum Comparisons
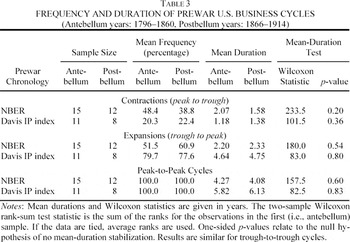
The revised chronology alters the summary statistics of prewar industrial expansions and contractions. To further examine whether cycle characteristics changed significantly before and after the Civil War, Table 3 presents the average frequency and duration of American business cycles. Specifically, I employ nonparametric tests to explore whether the mean phase and whole-cycle duration changed between the Civil War under both the old and new chronologies.31
Following Diebold and Rudebusch, “Have Postwar Economic Fluctuations,” the hypothesis of whether the mean duration of expansions, recessions, or entire peak-to-peak cycles are equal between two samples can be formally tested using a Wilcoxon rank-sum test.
The critical result of
Table 3 is that there is no appreciable change in the frequency or duration of prewar American cycles when one treats the Civil War as the sample break. Thus, the Wilcoxon tests confirm the conventional view that the frequency and duration of antebellum and postbellum business cycles were analogous. Because the spurious prewar NBER cycles that are removed here are equally distributed between the antebellum and postbellum eras, sample differences in prewar business cycles remain statistically unimportant. This result is consistent with the consonant business-cycle volatility in the two period, as reported in my recent work.
32 Davis, “Quantity-Based Annual Index.”
Another salient feature of Table 3 is that the new annual peaks and troughs reduce the average frequency of prewar recessions from nearly every other year in the NBER set, to one out of five years.33
More accurately, the revised chronology demonstrates that the U.S. industrial sector was in recession in 26 out of the 118 years (22 percent of the time) over the 1796–1914 period. Under the NBER chronology, the U.S. economy spent 54 of the 118 years in recession, or 46 percent of the time.
By removing dating inconsistencies from the conventional scale, the new peaks and troughs systematically double the mean duration of prewar expansions, while they truncate the average length of contractions by one-third.
Prewar Versus Postwar Cycles: Tentative Comparisons
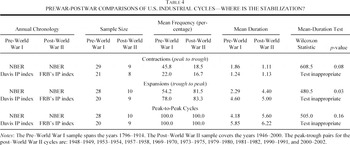
As it stands today, the NBER chronology suggests that the U.S. business cycle has significantly “stabilized” or “moderated” following World War II. This is clearly evident in the first row (entitled “NBER”) of the prewar-postwar comparisons in Table 4.
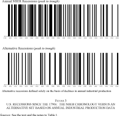
Yet, as is obvious from Figure 3, the extensive modifications to the annual prewar chronology could significantly alter historical comparisons made between prewar and postwar cycles. How does one (if at all) compare the new prewar cycles to a postwar NBER chronology that is undoubtedly based on more comprehensive information?
FIGURE 3 U.S. RECESSIONS SINCE THE 1790s: THE NBER CHRONOLOGY VERSUS AN ALTERNATIVE SET BASED ON ANNUAL INDUSTRIAL PRODUCTION DATA
Perhaps the most valid comparison would be to build an annual postwar chronology in a manner similar to how the alternative prewar chronology was established. Consequently, I have constructed an alternative annual postwar chronology simply by mapping to absolute peaks and troughs in the annual values of the FRB monthly industrial production index.34
It is worth noting that my alternative postwar chronology possesses a slightly lower frequency of recession and slightly longer expansions than would be the case had I “annualized” the monthly turning points. This is because the Federal Reserve's industrial production index expanded marginally in 1961, whereas the NBER determined that the recession officially ended in February of that year. As a result, my alternative postwar chronology should be more inclined to find “stabilization” in the U.S. business cycle when compared to its prewar counterpart than had I used the actual NBER monthly turning points for the postwar period.
recalculates the average frequency and mean expansion, contraction, and peak-to-peak whole-cycle durations for both the prewar period (1796–1914) and the postwar period (1946–2000) using the Davis and FRB indexes, respectively. Unlike for the case of the NBER prewar-postwar chronologies,
Table 4 does not explicitly test the null hypothesis that prewar-postwar differences are zero because I cannot guarantee that my index and the FRB index are strictly comparable over the long run.
35 Davis, “Quantity-Based Annual Index,” pp. 1191–92.
Comparing the summary statistics of the prewar and postwar cycles under the alternative (IP-based) chronology, I find that the proportion of time that the U.S. industrial sector has spent in recession has remained fairly constant over the past two centuries. The characteristics of industrial contractions, expansions, and peak-to-peak cycles appear largely unchanged among the pre-Civil War, Civil War to World War I, and postwar periods. This finding differs somewhat from those previously documented by Francis Diebold and Glenn Rudebusch and by Romer.36
Diebold and Rudebusch, “Have Postwar Economic Fluctuations”; and Romer, “Remeasuring Business Cycles.”
CONCLUSION
My goal has been to reexamine the dating of the NBER's prewar annual business cycle. The NBER series has the remarkable implication that the U.S. economy spent close to one-half of the 1796–1914 period in recession. Previous researchers have questioned the validity of the early set of American business-cycle dates, but have not been in a position to offer an alternative for the entire prewar period.37
Romer, “Remeasuring Business Cycles”; and Watson, “Business-Cycle Durations.”
This study broadens the scope of previous research by constructing an alternative set of turning points between 1796 and 1914 using my annual index of U.S. industrial production for the 1790–1915 period.38
Davis, “Quantity-Based Annual Index.”
In doing so, it contributes to our understanding of the characteristics of early American business cycles. Overall, the alternative prewar chronology alters (by either dropping or redating) roughly 40 percent of the annual prewar NBER peaks and troughs. As long suspected, the nineteenth-century NBER chronology recognizes several growth cycles as genuine contractions. Because the revised chronology removes spurious recessions that interrupted genuinely long booms (e.g., the 1820s, 1840s, and 1880s), the average phase duration of prewar expansions doubles and the length of full cycles rises one-half. The revised prewar peaks correspond closely with existing NBER peaks, but the new troughs are dated systematically earlier. I hypothesize on potential explanations for such systematic bias in the dating errors.
The new chronology also suggests avenues for future research. For instance, while Figure 3 suggests that much of the 1800s looks similar to the post–1945 period, the period from 1890 through 1940 looks noticeably more volatile. The era 1890–1930 (which some historians define as the prewar era) continues to have more frequent cycles than the postwar era even when the new dates are used, and the new dates offer no new insight as to what factors might have caused the increased volatility.
Taking a longer view, the article's extensive revisions to the prewar chronology tempers the widespread conventional view that, as early as World War II, U.S. recessions have occurred less frequently and U.S. expansions have lasted longer. Although the article's comparison between prewar and postwar cycles is limited by its reliance on a single annual index (as opposed to many monthly series) of industrial production (as opposed to a more comprehensive GDP measure), it does suggest that the most ardent proponents of U.S. macroeconomic stabilization should embrace a broader historical perspective before claiming decisive victory over the business cycle.