INTRODUCTION
The balanced fertilization of nitrogen (N), phosphorus (P) and potassium (K) has been recognized as an important agricultural practice to increase crop yields (Cai & Qin Reference Cai and Qin2006). Unbalanced fertilization (deficiency in one or two of the N, P and K nutrients) is also widely practised by farmers due to economic pressure. However, these fertilizer strategies have resulted in several environmental problems such as significant acidification of agricultural soils (Guo et al. Reference Guo, Liu, Zhang, Shen, Han, Zhang, Christie, Goulding, Vitousek and Zhang2010) and eutrophication in groundwater (Bennett et al. Reference Bennett, Carpenter and Caraco2001), as well as elevated greenhouse gas emissions (Ma et al. Reference Ma, Wu, Tremblay, Deen, Morrison, McLaughlin, Gregorich and Stewart2010). To alleviate these negative effects, mineral fertilizers are usually used in combination with organic amendments such as manure or crop residues. These organic materials supply a large amount of nutrients for crop growth to avoid the application of high levels of mineral fertilizers on the one hand (Diacono & Montemurro Reference Diacono and Montemurro2010) and maintain or increase soil carbon (C) contents to mitigate climate change on the other (Cai & Qin Reference Cai and Qin2006; Shen et al. Reference Shen, Yang, Yao, Wu, Wang, Guo and Yin2007). The use of crop residues as organic amendments to soils also significantly reduces smog pollution from open biomass burning (Cheng et al. Reference Cheng, Wang, Fu, Watson, Jiang, Fu, Chen, Xu, Yu, Chow and Hao2014).
Soil microorganisms are of critical importance to ecosystem functioning through their contributions to decomposition of organic matter, biogeochemical cycling of soil nutrients and aggregate formation (Paul & Clark Reference Paul and Clark1989). Many researchers have studied the influences of mineral fertilizers or organic amendments on biomass and composition of soil microbial communities (Börjesson et al. Reference Börjesson, Menichetti, Kirchmann and Kätterer2012; Geisseler & Scow Reference Geisseler and Scow2014). While some studies found that mineral fertilizers increased soil microbial biomass and diversity (Belay et al. Reference Belay, Claassens and Wehner2002; Zhong et al. Reference Zhong, Gu, Wang, Zhang, Lin, Huang and Shen2010), others did not report a significant fertilization effect (Sarathchandra et al. Reference Sarathchandra, Ghani, Yeates, Burch and Cox2001; Esperschütz et al. Reference Esperschütz, Gattinger, Mäder, Schloter and Fliessbach2007). The picture was more complex regarding the fertilization effect on soil microbial community composition (Geisseler & Scow Reference Geisseler and Scow2014). Nitrogen fertilization generally resulted in a community shift towards fungi (Böhme et al. Reference Böhme, Langer and Böhme2005; Esperschütz et al. Reference Esperschütz, Gattinger, Mäder, Schloter and Fliessbach2007), but a lower relative abundance of fungi in fertilized soils was also reported (Kirchmann et al. Reference Kirchmann, Schön, Börjesson, Hamnér and Kätterer2013). Williams et al. (Reference Williams, Börjesson and Hedlund2013) further pointed out that long-term mineral fertilization had little impact on soil microbial community composition due to the significant interaction of organic matter inputs. Organic amendments were generally found to increase soil microbial biomass and activity (Chu et al. Reference Chu, Lin, Fujin, Morimoto, Yagi, Hu and Zhang2007; Islam et al. Reference Islam, Chauhan, Kim, Kim and Sa2011), but the extent of the increase depended on the type and quantity of amendments. For example, Börjesson et al. (Reference Börjesson, Menichetti, Kirchmann and Kätterer2012) showed that sewage sludge treatment resulted in significantly higher microbial biomass than organic manure and straw in a clay loam soil. However, most of these studies examined either the effect of fertilizer application or of the application of organic amendments alone; uncertainties still remain about the combined effect of mineral fertilizers and organic amendments, especially crop residues, on soil microbial communities (Islam et al. Reference Islam, Chauhan, Kim, Kim and Sa2011). In addition, it is unclear whether soil microbial communities are influenced directly by mineral fertilization and organic input, or influenced indirectly by treatment-induced changes in soil properties. Williams et al. (Reference Williams, Börjesson and Hedlund2013) found that changes in microbial community composition were explained best by fertilizer-induced changes in soil properties at the field scale. Identifying the direct and indirect effects of applying mineral fertilizers and organic amendments to soils on microbial communities are critical for sustainable agriculture.
In the present study, soils were taken from a long-term fertilization experiment initiated in 1984. Studies based on long-term experiments make the outcomes even more important in terms of sustainability. The effects of applying mineral fertilizers and crop residues on biomass and composition of soil microbial communities were examined. Soil microbial communities were characterized by phospholipid fatty acid (PLFA) analysis, as this is a powerful technique to indicate the presence of specific microbial groups (Frostegård et al. Reference Frostegård, Tunlid and Bååth2011). The direct and indirect effects of residue return and fertilization on soil microbial communities were also investigated. The hypotheses for the present study were that: (1) fertilization would lead to significant changes in soil microbial communities, the extent of which depends on the amount of crop residues returned; and (2) changes in soil microbial communities would be more a result of treatment-induced variations in soil properties.
MATERIALS AND METHODS
Site description and experimental setup
The present study was conducted on a long-term fertilization trial initiated in the autumn of 1984 at the experimental field of Jilin Agricultural University, Jilin province, China (43°48′N, 125°23′E, 223 m a.s.l.). The climate was humid continental according to the Köppen-Geiger Climate Classification (Peel et al. Reference Peel, Finlayson and McMahon2007), with mean annual air temperature and precipitation of 4·8 °C and 615 mm, respectively. The soil was classified as Typic Hapludoll based on the USDA Soil Taxonomy (Soil Survey Staff 2010) with a clay loam texture.
The experiment was a randomized split-plot design with three replicates. The whole plot treatments were crop residues returned at 0, 2500 and 5000 kg/ha. The sub-plot treatments included no fertilizer (control), mineral N fertilizer (N), mineral P fertilizer (P), mineral K fertilizer (K), mineral NP fertilizer (NP), mineral NK fertilizer (NK), mineral PK fertilizer (PK) and mineral NPK fertilizer (NPK). The area of each sub-plot was 2 m2. Each sub-plot was surrounded by four concrete walls to a depth of 2 m. Mineral N, P and K fertilizers were applied as urea, superphosphate and K sulphate, respectively, at rates of 150 kg N/ha, 75 kg phosphorus pentoxide (P2O5)/ha and 75 kg potassium oxide (K2O)/ha every year. All mineral fertilizers were applied as starter fertilizer at planting. The plots were subjected to monoculture maize (Zea mays L.) with a target population of 60 000 plants/ha. Maize was planted with a manual planter in May and harvested in October. Maize residues from all plots were air-dried, mixed and cut into 60-mm segments. These segments were manually incorporated into soils across the 0–0·2 m depth with a shovel after crop harvest. Another soil management technique was spring ridging with a shovel before planting.
Soil sampling and chemical analysis
Four randomized soil cores (26·4 mm in diameter) per sub-plot were sampled from the 0–0·2 m depth with a T sampler on 8 May 2014 before planting. The 0–0·2 m depth was chosen since this is the working depth of soil management. Soil cores from the same sub-plot were amalgamated, placed in plastic bags and transported immediately to the laboratory in a cooler. A total of 72 soil samples (24 treatments × three replicates) were taken. After removal of visible roots and fresh litter material, the amalgamated samples were homogenized and passed through a 2-mm sieve. One part of the field-moist samples was air-dried and used for soil chemical analysis. The other part of the field-moist samples were freeze-dried and used immediately for PLFA analysis.
Soil pH was measured in a 1:2·5 soil/water suspension. Soil total C and N contents were determined by dry combustion on ground samples (100-mesh) with an elemental analyser (Vario EL III, Elementar Analysensysteme GmbH, Hanau, Germany). Because these soils were free of carbonates, the total C content was equivalent to soil organic C content. Available N, P and K contents were determined by alkali hydrolysable diffusion method, Olsen-P method and ammonium acetate extraction method, respectively (Lu Reference Lu2000).
Phospholipid fatty acid analysis
The PLFA extraction was conducted following the procedure of Bligh & Dyer (Reference Bligh and Dyer1959) with slight modifications as described by Zhang et al. (Reference Zhang, Li, Ren, Tian, Wang, He and Tian2014). Briefly, lipids were extracted from soils with a buffer mixture of chloroform–methanol–phosphate (1:2:0·8). Phospholipids were separated from neutral lipids and glycolipids on solid phase extraction columns (CNW Technologies GmbH, Düsseldorf, Germany). After methylation of the polar lipids, PLFA methyl esters were analysed on an Agilent 6850N gas chromatography (Agilent Technologies, Santa Clara, USA) equipped with an HP-5 capillary column (30 m × 0·32 mm × 0·25 µ m) and a flame ionization detector. The MIDI Sherlock Microbial Identification System (Microbial ID Inc., Newark, USA) was used to identify fatty acids. Nonadecanoic acid methyl ester (19:0, Sigma) was added as an internal standard and used to convert fatty acid peak areas to absolute abundance.
Thirty-five individual PLFAs consistently presented in the samples were used for data analysis. The sum of all PLFAs (C14–C20) was used to indicate total microbial biomass. The sum of a15:0, i15:0, i16:0, a17:0 and i17:0 was used to indicate Gram-positive bacteria (Gm+), and the sum of 16:1 2OH, 16:1ω7c, 16:1ω9c, cy17:0, 17:1ω8c, 18:1ω7c and cy19:0 was used to indicate Gram-negative bacteria (Gm–) (Zogg et al. Reference Zogg, Zak, Ringelberg, White, MacDonald and Pregitzer1997; Zhang et al. Reference Zhang, Li, Ren, Tian, Wang, He and Tian2014). The sum of 10Me16:0, 10Me17:0 and 10Me18:0 was used to indicate actinomycetes. 18:2ω6,9c was used to indicate fungi (Frostegård et al. Reference Frostegård, Tunlid and Bååth2011) and 20:4ω6,9,12,15c was used to indicate protozoa (Vestal & White Reference Vestal and White1989).
Statistical analysis
To test the main effects of residue return and fertilization as well as their interactions on soil chemical properties and sums and ratios of various microbial lipid groups, general linear model analysis of variance was conducted with residue return and fertilization as fixed factors and replicate as random factor. Tukey's honestly significant difference test was performed when the effects and interactions of residue return and fertilization were significant. Shapiro-Wilk and Bartlett's tests were used to test normality assumption and homogeneity of variance, respectively. Statistical analysis was performed with the software package SPSS 13·0 for Windows (SPSS Inc., Chicago, USA). Figures were generated by Sigmaplot 10·0 (Systat Software Inc., San Jose, USA).
To explore variation in soil microbial community composition among treatments, the mole percentages of individual PLFAs were subjected to principal component analysis (PCA) after standardizing to unit variance. To test significant effects of residue return, fertilization and their interactions on soil microbial community composition, a non-parametric multivariate analysis of variance (MANOVA) was conducted on the Bray–Curtis dissimilarity matrix with the ‘vegdist’ and ‘adonis’ functions in the ‘vegan’ library of the R program (version 3.1·2). To explore the PLFA data explained by a linear model of chemical variables, redundancy analysis (RDA) was carried out with the ‘rda’ function in the ‘vegan’ library of the R program. The ordination of the response variables (PLFA data) was constrained by multiple regression analysis of the explanatory variables (chemical data). The ordination graph shows response and explanatory variables as vectors. The proportion of explained variation was calculated by using adjusted R-squared values as described by Peres-Neto et al. (Reference Peres-Neto, Legendre, Dray and Borcard2006). The significance of explanatory variables was assessed by permutation tests (999 permutations) with the ‘anova.cca’ function in R. The RDA graph was generated by the R program.
To estimate the direct and indirect effects of residue return and fertilization on fungal and bacterial biomass, structural equation models were fitted to data with the ‘sem’ package in R. Soil pH, soil organic C, and ‘soil fertility’ were used as explanatory variables. ‘Soil fertility’ was indicated by total N, the ratio of C to N (C/N), available N, P and K. Bacterial biomass was indicated by Gm+ and Gm– biomass. Significance of the model fit was evaluated according to the following parameters: χ 2 value, P value, root-mean-square error of approximation (RMSEA) and goodness-of-fit index (GFI) (Hooper et al. Reference Hooper, Coughlan and Mullen2008).
RESULTS
Soil properties
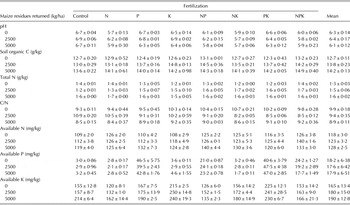
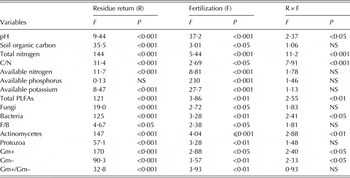
Compared with the control, P, K and PK treatments, the N, NP, NK and NPK treatments generally decreased soil pH regardless of crop residue treatments (P < 0·05, Table 1). Plots with residue returned at 5000 kg/ha also had significantly lower soil pH than plots with residue returned at 0 and 2500 kg/ha (P < 0·05, Table 1). Fertilization had no effect on soil organic C contents for plots with residues returned at 0 and 5000 kg/ha, but it significantly (P < 0·05) influenced those for plots with residues returned at 2500 kg/ha (Table 1). Soil organic C contents for plots with residues returned at 2500 kg/ha were significantly higher under the K and NP than the control and N treatments (P < 0·05, Table 1). Plots with residue return contained significantly higher soil organic C contents than plots without residue return (P < 0·05, Table 1). Fertilization generally decreased total N contents for plots without residue return, generally increased those for plots with residue returned at 2500 kg/ha, but had no effect on those for plots with residue returned at 5000 kg/ha (Table 1). The more crop residues that were returned, the higher total N contents were observed in the soils (P < 0·05, Table 1). The C/N ratios were higher (P < 0·05) in the NK than the control treatments for plots without residue return, lower (P < 0·05) in the P, NP, NK, PK and NPK than the control treatments for plots with residues returned at 2500 kg/ha, but similar among fertilization treatments for plots with residues returned at 5000 kg/ha (Table 1). The C/N ratios were highest for plots without residue return, medium for plots with residue returned at 2500 kg/ha and lowest for plots with residue returned at 5000 kg/ha (P < 0·05, Table 1). Available N contents were significantly higher (P < 0·05) in the N and NPK than the control and K treatments for plots without residue return, and significantly higher (P < 0·05) in the NPK than the control, P, K and NK treatments for plots with residues returned at 2500 kg/ha (Table 1). Available P contents were significantly higher (P < 0·05) in the P and PK treatments than the NP and NPK treatments, which were also significantly higher (P < 0·05) than the control, N, K and NK treatments regardless of how many residues were returned (Table 1). Available K contents were generally higher under treatments with K fertilizer than under treatments without K fertilizer (Table 1). Residue return significantly (P < 0·05) increased available N and K contents, but had no effect on available P contents (Table 2).
Selected soil characteristics after 30 years of different residue return and fertilization treatments

All values (means ± standard errors) are based on three replicates except these of the last column, which are based on eight replicates; control, no fertilizer; N, mineral N fertilizer; P, mineral P fertilizer; K, mineral K fertilizer; NP, mineral NP fertilizer; NK, mineral NK fertilizer; PK, mineral PK fertilizer; NPK, mineral NPK fertilizer.
ANOVA of residue return, fertilization and their interaction on soil variables
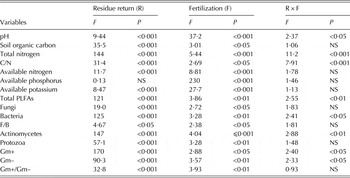
C/N, the ratio of soil organic C to total N; NS, not significant; PLFA, phospholipid fatty acid; F/B, the ratio of fungi to bacteria; Gm+, Gram-positive bacteria; Gm–, Gram-negative bacteria; Gm+/Gm–, the ratio of Gram-positive to Gram-negative bacteria.
Soil microbial lipid groups
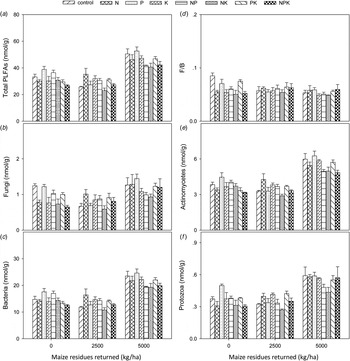
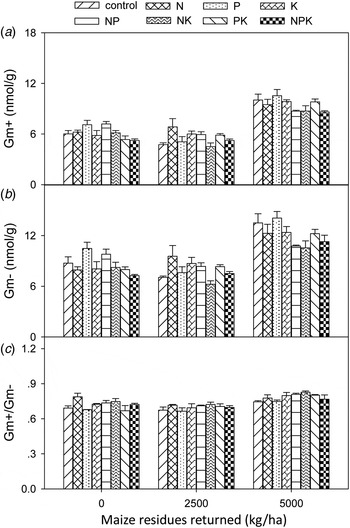
Residue return had a significant influence on microbial lipid groups (P < 0·05, Table 2). Plots with residues returned at 5000 kg/ha had higher sums and ratios of soil microbial groups than plots with residues returned at 0 and 2500 kg/ha, except the ratio of fungi to bacteria (F/B) (P < 0·05, Figs 1 and 2). The differences in sums and ratios of microbial groups were not significant between plots with residues returned at 2500 kg/ha and plots without residue return (Figs 1 and 2).
Concentrations of (a) total phospholipid fatty acids (PLFAs), (b) fungi and (c) bacteria; (d) ratios of fungi to bacteria (F/B) and concentrations of (e) actinomycetes and (f) protozoa after 30 years of different residue return and fertilization treatments. Error bars indicate standard errors. control, no fertilizer; N, mineral N fertilizer; P, mineral P fertilizer; K, mineral K fertilizer; NP, mineral NP fertilizer; NK, mineral NK fertilizer; PK, mineral PK fertilizer; NPK, mineral NPK fertilizer.

Concentrations of (a) Gram-positive (Gm+) and (b) Gram-negative bacteria (Gm–), and (c) their ratios (Gm+/Gm–) after 30 years of different residue return and fertilization treatments. Error bars indicate standard errors. control, no fertilizer; N, mineral N fertilizer; P, mineral P fertilizer; K, mineral K fertilizer; NP, mineral NP fertilizer; NK, mineral NK fertilizer; PK, mineral PK fertilizer; NPK, mineral NPK fertilizer.

The effect of fertilization on soil microbial lipid groups depended on the amount of crop residues returned (Table 2). For plots without residue return, total PLFAs were significantly higher under the P treatment than the NPK treatment (P < 0·05, Fig. 1(a)). For plots with residues returned at 2500 kg/ha, total PLFAs were significantly higher under the N treatment than the NK treatment (P < 0·05, Fig. 1(a)). For plots with residues returned at 5000 kg/ha, there were no significant differences in total PLFAs among fertilization treatments (P > 0·05, Fig. 1(a)). The effect of fertilization on bacteria, actinomycetes and Gm– was similar to that on total PLFAs (Table 2, Figs 1(c) and (e) and 2(b)). Fungi were significantly higher (P < 0·05) under the control than N, K, NK and NPK treatments in plots without residue return, but similar under treatments in plots with residues returned at 2500 and 5000 kg/ha (Table 2, Fig. 1(b)). Protozoa were significantly higher (P < 0·05) under P than N, NK and NPK treatments in plots without residue return, significantly higher (P < 0·05) under N, K and PK than NK treatments in plots with residues returned at 2500 kg/ha, but similar under treatments in plots with residues returned at 5000 kg/ha (Table 2, Fig. 1(f)). The F/B ratios were significantly higher under the control than the N, K, NK and NPK treatments for plots without residue return, but similar among fertilization treatments for plots with residue returned at 2500 and 5000 kg/ha (Table 2, Fig. 1(d)). For plots without residue return, the Gm+ were significantly higher (P < 0·05) under NP than the NPK treatment while the ratios of Gm+ to Gm– were significantly higher (P < 0·05) under N than PK treatment (Figs 2(a) and (c)).
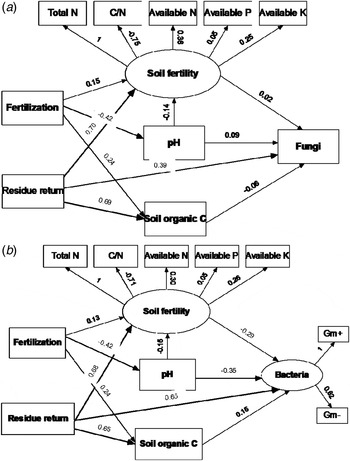
Structural equation modelling was used to assess the direct and indirect effects of residue return and fertilization on fungi and bacteria (Fig. 3). The fitted models for fungi (χ 2 = 2·89, P = 0·259, RMSEA = 0·061, GFI = 0·98) and bacteria (χ 2 = 2·91, P = 0·263, RMSEA = 0·062, GFI = 0·98) met the significance criteria. Residue return showed significant direct effect on both fungi (P < 0·05, Fig. 3(a)) and bacteria (P < 0·001, Fig. 3(b)) and also indirect effect (P < 0·01) on bacteria through its influence on the ‘soil fertility’ index. Fertilization showed no significant direct effect on either fungi or bacteria but an indirect effect (P < 0·01) on bacteria mediated through soil pH.
The structural equation model showing the direct and indirect effects of residue return and fertilization on (a) fungi and (b) bacteria (b). Soil fertility index is a patent variable indicated by total N, C/N ratio, available N, P and K. Bacteria is indicated by Gram-positive (Gm+) and Gram-negative (Gm–) bacteria. The width of arrow indicates the strength of the standardized path coefficient.

Soil microbial community composition
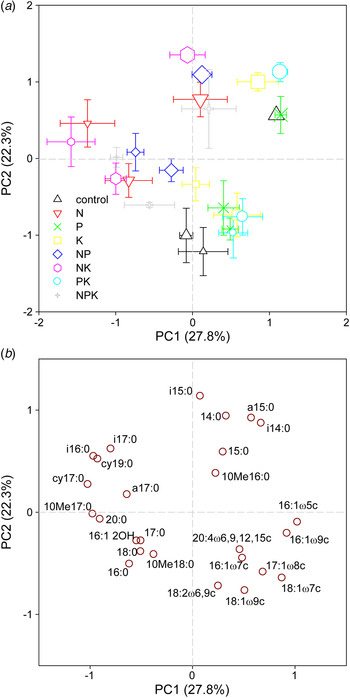
Principal component analysis of the PLFA data showed the first principal component (PC1) explained 27·8% and the second (PC2) 22·3% of the total variance in the PLFA data (Fig. 4) The non-parametric MANOVA revealed that soil microbial community composition was influenced significantly by residue return (F = 19·95, R 2 = 0·25, P < 0·001) and fertilization (F = 7·74, R 2 = 0·34, P < 0·001) but not by their interaction (F = 1·13, R 2 = 0·10, NS). Soil microbial community composition for plots with residues returned at 5000 kg/ha was significantly different from that for plots with residues returned at 0 and 2500 kg/ha (P < 0·05, Fig. 4(a)). There were no significant differences in soil microbial community composition between plots without residue return and plots with residues returned at 2500 kg/ha (Fig. 4(a)). The PCA graph also indicated that soil microbial community composition under the control, P, K and PK treatments was significantly different from that under the N, NP, NK and NPK treatments (P < 0·05, Fig. 4(a)). The species loading scores revealed that the saturated, cyclopropyl and iso-/anteiso-branching fatty acids were most important for the separation of plots with residues returned at 5000 kg/ha from plots with residues return at 0 and 2500 kg/ha, while the monounsaturated fatty acids were most important for the separation of treatments with N fertilizer from treatments without N fertilizer (Fig. 4(b)).
Principal component analysis (PCA) of the phospholipid fatty acid (PLFA) data. (a) Site scores under different residue return and fertilization treatments. The first principal component (PC1) and the second one (PC2) explain 27·8 and 22·3%, respectively, of the variance in the PLFA data. Error bars indicate standard errors. control, no fertilizer; N, mineral N fertilizer; P, mineral P fertilizer; K, mineral K fertilizer; NP, mineral NP fertilizer; NK, mineral NK fertilizer; PK, mineral PK fertilizer; NPK, mineral NPK fertilizer. The small, medium and large symbols indicate crop residues returned at 0, 2500 and 5000 kg/ha, respectively. (b) Loading scores for selected individual PLFAs. Colour online.

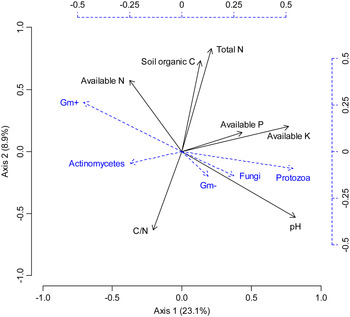
Redundancy analysis of the PLFA data showed that the first and second canonical axes explained 23·1 and 8·9%, respectively, of the total variance (Fig. 5). The permutation test revealed that residue return and fertilization had significant effects on soil microbial communities. Soil organic C (F = 6·69, P < 0·001), total N (F = 4·93, P < 0·01), C/N ratio (F = 2·57, P < 0·05), available P (F = 2·47, P < 0·05), available K (F = 2·24, P < 0·05) and soil pH (F = 18·1, P < 0·001) all played a significant role in shaping soil microbial community composition (Fig. 5).
Redundancy analysis (RDA) of the phospholipid fatty acid (PLFA) data as explained by environmental variables. The explanatory variables are scaled by the black solid axes (bottom and left), and the species scores are scaled by the blue dashed axes (top and right). Colour online.

DISCUSSION
The effect of residue return
In the present study, incorporation of maize residues at a rate of 5000 kg/ha increased soil microbial biomass significantly, while incorporation of maize residues at a rate of 2500 kg/ha had no effect. The increase in microbial biomass under residue return has been reported in other studies (Börjesson et al. Reference Börjesson, Menichetti, Kirchmann and Kätterer2012), which is usually explained by continuous inputs of organic material that serves as a C source and energy for microbial growth and activity (Navarro-Noya et al. Reference Navarro-Noya, Gómez-Acata, Montoya-Ciriaco, Rojas-Valdez, Suárez-Arriaga, Valenzuela-Encinas, Jiménez-Bueno, Verhulst, Govaerts and Dendooven2013). However, soil microbial biomass did not increase when maize residue was returned at 2500 kg/ha in the present study, even though soil organic C was increased significantly. It seems there is a threshold for crop residues returned to increase soil microbial biomass. Identification of this threshold could be important for modelling the microbial role in soil C cycling under different agricultural practices (Geisseler & Scow Reference Geisseler and Scow2014).
Residue return also significantly influenced soil microbial community composition by altering the relative abundance of fungi and bacteria. This result could be partially explained by the direct effect of residue return, as illustrated by structure equation modelling. The direct effect of agricultural practices on soil microbial community composition has been reported in other studies (Jangid et al. Reference Jangid, Williams, Franzluebbers, Schmidt, Coleman and Whitman2011). This suggests that human activities are important determinants for soil microbial community composition. In addition, the indirect effect of residue return through changes in C/N ratio could also contribute to the observed results. This is supported by the structure equation modelling and RDA results. It is generally held that soils with lower C/N ratios are more favourable to bacteria than fungi (Zhang et al. Reference Zhang, Liang, He and Zhang2013). The C/N ratio decreased with increases in the amount of crop residues returned, which probably led to increased bacterial rather than fungal biomass and thus decreased the F/B ratio. Incorporation of crop residues at the highest rate also induced a composition shift towards Gm+ bacteria. This is in contrast to the general view that Gm+ bacteria prefer older organic matter, while Gm– bacteria prefer fresh plant material (Fierer et al. Reference Fierer, Schimel and Holden2003). This is probably related to soil pH, as indicated by its significant correlation with Gm+/Gm– (R 2 = 0·39, P < 0·01). Higher soil pH was found to be associated with higher abundances of 16:1ω7c, 16:1ω9c, 17:1ω8c and 18:1ω7c which are PLFA markers of Gm– bacteria, and lower abundances of i15:0 and i16:0 which are PLFA markers of Gm+ bacteria (Rousk et al. Reference Rousk, Brookes and Bååth2011). Thus, it could be that the significantly lower soil pH under residue return at the highest rate contributed to the significantly higher Gm+/Gm– ratio.
The fertilization effect
The fertilization effect on soil microbial biomass was dependent on the amount of crop residues returned. The more crop residues that were returned, the less effect of mineral fertilization on microbial biomass was observed. Residue return also played a stronger effect on soil microbial community composition compared with mineral fertilization. These results lend support to research findings that changes in soil microbial communities were driven more by residue inputs than mineral fertilization (Börjesson et al. Reference Börjesson, Menichetti, Kirchmann and Kätterer2012). Nevertheless, mineral fertilization with N resulted in a significant change in soil microbial community composition than without N. These results are in line with other studies (Williams et al. Reference Williams, Börjesson and Hedlund2013; Geisseler & Scow Reference Geisseler and Scow2014) and clearly driven by treatment-induced changes in soil pH. The structural equation modelling and RDA results further indicate that soil pH had a stronger effect on bacteria than fungi. This corroborates many other studies that include a wide range of soil types and suggests that soil pH is more important than soil type in shaping bacterial community composition (Rousk et al. Reference Rousk, Bååth, Brookes, Lauber, Lozupone, Caporaso, Knight and Fierer2010). Bacteria have narrow pH ranges for optimal growth, which probably leads to the stronger pH influence on soil bacterial community composition. On the other hand, fungi are less influenced by soil pH because of their wider pH ranges for optimal growth, as found in pure culture studies (Wheeler et al. Reference Wheeler, Hurdman and Pitt1991).
CONCLUSIONS
In the present study, residue return influenced soil microbial community composition primarily by changing the relative abundance of fungi to bacteria. Residue return only increased soil microbial biomass significantly when maize residues were returned at rate of 5000 kg/ha. This suggests that there is a threshold for microbial biomass to increase under residue return for the studied clay loam soil. Nitrogen fertilization led to a significant change in soil microbial community composition, which was mainly derived from a treatment-induced change in soil pH. The effect of mineral fertilization on soil microbial biomass gradually declined with increasing residue quantity. This suggests that residue return is more important to soil microbial communities than fertilization when crop residues are returned at a higher rate. The present study indicates that farmers could probably adjust their fertilizer strategies under higher inputs of crop residues with minimum effect on soil microbial communities. However, caution must be exercised because PLFA analysis is an approach that cannot differentiate well between different taxa. Other approaches such as DNA-based analysis should be used in future studies to examine the effect of residue return and fertilization on soil microbial communities at a taxonomic and phylogenetic resolution.
The current work was financially supported by the Science Foundation of Chinese Academy of Sciences (KZZD-EW-TZ-16), the National Natural Science Foundation of China (grant numbers 41401332 and 41371295), the One Hundred Person Project of the Chinese Academy of Sciences (Y2H102), and the Natural Science Foundation of Jilin Province (grant numbers 20130101080JC and 20140101017JC).