


1. Introduction
Electrospray is an electrostatic method for generating charged particles from a conductive liquid surface. At sufficiently high volumetric flow rates, the conductive liquid is transported to the tip of an emitter and, while under the influence of a strong electric field, the liquid deforms into a Taylor cone-jet resulting in charged species emission. The cone-jet operation is one of several emission modes common in electrospray, but the only one of special interest to this work due to the consistent production of submicrometre-sized fluid structures and ions. The electrospray technique is used in a variety of fields including mass spectrometry, electrostatic deposition, electric propulsion and the food and pharmaceutical industries. Characterization of emitted ion beams can provide important observables necessary for improved modelling of the physics of the electrospray process for technologies such as electrospray thrusters and advanced ion-beam technologies.
One emphasis in the development of electrospray thrusters is focused on understanding the physics associated with and controlling the emission beam output to achieve desired operational performance for satellite manoeuvring. Some significant research directions involved tailoring the electrospray propellant (i.e. availability of massive ions) and the selection of emitter style (Chiu & Dressler Reference Chiu and Dressler2007; Chiu et al. Reference Chiu, Gaeta, Levandier, Dressler and Boatz2007; Berg & Rovey Reference Berg and Rovey2012, Reference Berg and Rovey2013; Berg et al. Reference Berg, Rovey, Prince, Miller and Bemish2015; Terhune et al. Reference Terhune, King, Prince and Hawkett2016). Using internal-flow emitters (i.e. capillaries) or externally wetted emitters (i.e. etched needles or micro-electromechanical system arrays) limits the emission beam output to an ion/droplet mixed mode or near the purely ionic mode, respectively (Lozano & Martinez-Sanchez Reference Lozano and Martinez-Sanchez2002, Reference Lozano and Martinez-Sanchez2005; Ticknor, Miller & Chiu Reference Ticknor, Miller and Chiu2009; Ticknor et al. Reference Ticknor, Anderson, Fritz and Chiu2010; Miller et al. Reference Miller, Prince, Bemish and Rovey2014). The significant body of work in the electrospray thruster community has ultimately led to the development and demonstration of electrospray thrusters in laboratory and on-orbit settings including Accion Systems’ TILE (tiled ionic liquid electrospray) thruster (Krejci et al. Reference Krejci, Mier-Hicks, Thomas, Haag and Lozano2017; Gomez Jenkins, Krejci & Lozano Reference Gomez Jenkins, Krejci and Lozano2018; Petro et al. Reference Petro, Bruno, Lozano, Perna and Freeman2020) and Busek's CMNT (colloid micro-Newton thruster) (Gamero-Castaño et al. Reference Gamero-Castaño, Hruby, Spence, Demmons, Mccormick, Gasdaska and Falkos2003; Demmons et al. Reference Demmons, Hruby, Spence, Roy, Ehrbar, Zwahlen, Martin, Ziemer and Randolph2008; Ziemer et al. Reference Ziemer2010). The NASA LISA (laser interferometer space antenna) mission has successfully demonstrated capillary emitters, via the CMNT system, in station-keeping operations to achieve negation of perturbations that would interfere with gravity wave detection (Demmons et al. Reference Demmons, Lamarre, Ziemer, Parker and Spence2016). The physics of the electrospray process, as it pertains to electrospray thrusters, has impacts on thruster longevity and propulsive performance. In the work below, we describe a series of experimental investigations and analyses that attempt to provide insight into the emission process from cone-jet formation to ion/droplet production in the nanolitre per second (nl s−1) flow rate regime for neat liquids.
Conventionally, electrospray ionization is commonly initiated using solutions of polar fluids, including glycols or formamide, with a solute of interest. Characterization of the emitted beam might include the measurement of the total electrospray beam current or a subset of the emission, perhaps at a specific angle, via a Faraday-type current detector, emitted ion kinetic energies might be measured using a retarding potential analyser (RPA), and the ion/droplets species identified by use of linear time-of-flight (TOF) or other mass spectrometric techniques. Depending on the circumstances of the electrospray source and emission process, individual ions to micrometre-sized droplets composed of thousands of molecules can result. For cases where micron-sized droplet are emitted, extracting droplet and jet characteristics can often be facilitated by shadow graph, schlieren photography or measured by specialized hardware such as an aerosizer (Fernández de la Mora & Loscertales Reference Fernández de la Mora and Loscertales1994; Rosell-Llompart & Fernández de la Mora Reference Rosell-Llompart and Fernández de la Mora1994; Gañán-Calvo, Dávila & Barrero Reference Gañán-Calvo, Dávila and Barrero1997). Oftentimes, the diameter of these large droplets can be determined directly from the image. Conventional laser velocimetry can also be used to determine droplet velocity by extracting a value from the frequency of light scattered by droplets crossing the volume of two intersecting laser beams (Gañán-Calvo et al. Reference Gañán-Calvo, Lasheras, Dávila and Barrero1994, Reference Gañán-Calvo, Dávila and Barrero1997). As some electrospray research transitioned to incorporate ionic liquids (ILs) as the electrospray liquid or as the solute of a solution, interest in cone-jet physics of sub-micron scaled cone-jets has blossomed. Recently, Gañán-Calvo et al. (Reference Gañán-Calvo, López-Herrera, Herrada, Ramos and Montanero2018) have reviewed the physics of cone-jet electrospray including summarizing the extensive wealth of experimental and theoretical works that have established many of the now well-known scaling laws. Room temperature ILs are of interest to the electrospray community largely because of their physical properties including low vapour pressure (i.e. limited evaporation in vacuum) and substantial electrical conductivities (~0.1–1.0 S m−1). Given their ionic state and natural conductivities, ILs generally require much less than 5.0 kV potential differences to achieve sufficiently strong extraction fields off typical emitters. Electrospray of these neat liquids can occur at volumetric flow rates as low as tens of picolitres per second generating droplets with radii of the order of 1 nm. The radius and charge of the emitted droplets at these flow rates are often difficult to directly determine given their nanoscopic size and the complicated environment of the cone-jet. However, the low volumetric flow rate regime is often critically relevant to the electrospray thruster community as it provides the greatest flexibility of thrust and specific impulse performance. Cone-jets emitting directly in vacuum and containing droplets typically have kinetic energy spreads of hundreds of electronvolts throughout the ion beam.
The formation and breakup of a charged cone-jet from ionic-liquid-based capillary emitters operating in a vacuum environment has been the subject of significant experimental work. One relevant example includes the work of Gamero-Castaño, who has examined both neat 1-ethyl-3-methylimidazolium bis(trifluromethylsulfonyl) imide (EMI-IM) and EMI-IM dissolved in various solvents using a combination of RPA, linear TOF techniques and induced charged detectors (Gamero-Castaño & Hruby Reference Gamero-Castaño and Hruby2002; Gamero-Castaño Reference Gamero-Castaño2007, Reference Gamero-Castaño2008a, Reference Gamero-Castaño2008b, Reference Gamero-Castaño2009, Reference Gamero-Castaño2010). The solution studies also identified a direct relationship between the mass-to-charge of emitted droplets and their respective stopping potential. Specifically, the results demonstrated that the mean jet velocity and jet breakup potential could be determined through a proper transformation of stopping potential data as a function of charge-to-mass ratio for an ensemble of droplet measurements. The induction charge detector technique enables the direct determination of electrospray droplet diameters from experimental measurements, but the results are limited by the need for a sufficiently large net charge on the droplet so as to induce a measurable response on the detector. Gamero-Castaño and Hruby (Reference Gamero-Castaño and Hruby2002) initially used a single stage induction charge detector, but updated the technique to improve droplet resolution. Studies using an induction charge detector with multiple sensing stages of the solution-based electrospray directly measured the number of charges (~O(10 000)) and size (O(1 μm)) of emitted droplets (Gamero-Castaño Reference Gamero-Castaño2007). Droplets emitted from the neat fluid at low volumetric flow rates are expected to be considerably smaller and exhibit significantly less charge (~O(100)), leading to difficulties in making similar measurements; thus a more complex arrangement of tandem RPA and multiple sensing stage induction charge detectors are required to probe droplets of size ~O(100 nm) and charge ~O(100) (Gamero-Castaño Reference Gamero-Castaño2009). For the neat fluid scenario, Gamero-Castaño (Reference Gamero-Castaño2008b), through the use of only stopping potential (RPA) and linear TOF techniques, found that a near continuum of ions and droplets were emitted at flow rates from 0.09 to 2.6 nl s−1 with the flight times spreading to longer and longer time scales as flow rate increased. An estimation of the mean jet velocity and mean jet diameter was possible through the finding that all emitted small ions had a narrow stopping potential width, which was ascribed to the mean breakup characteristics of the cone-jet. As a result, the mean jet velocity and diameter values were derived using the known physical constants, flow rate, beam current and ion-associated voltage deficit (e.g. emitter potential minus retarding potential) values. No specific mass-to-charge values were determined as accurately known flight times and retarding potentials were not available. Jet velocities in the range ~500–800 m s−1 and jet diameters of 12–80 nm were estimated over the flow rate range. No assignment of droplet mass and charge was made in this neat fluid study as no induction charge detector technique was used. Assuming standard Taylor cone-jet breakup, such jet diameters would produce droplets of sizes of the same order as the later instrument study using tandem induction charge detectors (Gamero-Castaño Reference Gamero-Castaño2009).
Experimental determination of the jet diameters, jet velocities, mass-to-charge ratios of emitted ions/droplets and relative populations of the various species are critically important to the modelling/validation of post-cone-jet physics models. For example, Huh and Wirz (Reference Huh and Wirz2019) have recently modelled the cone-jet formation process and extraction region of capillary emitters. Davis, Collins, & Wirz (Reference Davis, Collins and Wirz2019) have modelled the interaction region just beyond the extraction region of Huh and Wirz (Reference Huh and Wirz2019). The divergence of the resulting plume depended critically on the relative population of small-, medium- and large-charge-to-mass species as a result of Coulombic ‘traffic jams’ created by the significant disparity in velocities of the various species. Understanding the origins of species divergence in the plume is critical to understanding the effect of an operational thruster on components downstream, such as acceleration grids (Wirz Reference Wirz2019). The work of Gamero-Castaño introduced above demonstrated that velocity and jet diameters could be determined for low volumetric flow rates, however, the relative populations (and their mass-to-charge ratios) of the diverse droplet species could not be directly determined beyond mean values.
More recently, Gamero-Castaño and Cisquella-Serra (Reference Gamero-Castaño and Cisquella-Serra2021) have described the results of a tandem RPA and TOF investigation that examined the role of the jet's dimensionless Taylor number and viscosity parameter on the ratio of the critical droplet radius to the jet radius for a high electrical conductivity fluid. They found that as the Taylor number increased and the viscosity parameter remained low, the ratio decreased significantly below the 1.89 value typical of uncharged and inviscid jets. The authors demonstrated, experimentally and with numerical analysis, that several different species were expected: primary droplets with broad mass-to-charge distributions, including some droplets that had charge values exceeding the Rayleigh charge limit and later breakup in-flight, species that resulted from Coulombic explosion of unstable primary droplets and ion species formed from evaporation from droplets while being accelerated.
We have recently described an instrument and experimental approach to the simultaneous determination of all charged species within an approximately 25 eV kinetic energy window (Miller, Prince & Bemish Reference Miller, Prince and Bemish2017). This instrument is based on the demonstrated Wiley–McLaren orthogonal extraction TOF mass spectrometer in which the pulsing region now also serves as a kinetic energy bandpass filter. This instrument has demonstrated detection of large charged species with mass-to-charge ratios in the 100 000s of atomic mass unit per charge range. Given the universal scaling laws typical of electrospray in the cone-jet operational mode, this work will examine the ion and droplet species for a selection of different liquids so as to uncover previously undemonstrated trends.
This study focuses on determining the characteristics of the large charged species emitted by IL electrospray in cone-jet mode in a vacuum environment. Specifically, the study looks to establish the emitted charged species by TOF operation, identify the droplet contributors in the mass spectrum, define the jet/droplet velocity and the potential at the breakup location and define the droplet diameter, charge, mass-to-charge ratio and evaluate the experimental data so as to provide insight into the origination point of each class of droplet species. The paper is organized as follows: first, an experimental section is provided detailing the electrospray source and the orthogonal TOF instrument used for data collections. This is followed by the results section, providing a review of the data collected and the apparent data trends. The discussion is then presented detailing how droplet characteristic values were extracted from the data and the implications the data provide in defining the IL cone-jet operations for flow rates below 3.3 nl s−1.
2. Experimental
Kinetic energy-resolved mass spectra of a selection of ILs at select volumetric flow rates were obtained using an orthogonal TOF mass spectrometer operated in reflectron mode. The apparatus along with the IL source and kinetic energy selection technique have been extensively described previously (Miller et al. Reference Miller, Prince, Bemish and Rovey2014, Reference Miller, Prince, Bemish and Rovey2016, Reference Miller, Prince and Bemish2017). As shown in figure 1, the TOF is composed of four distinct regions: the electrospray source, the ion extraction region, the beam optimization region and the field-free detection region. Briefly, ions are emitted from an in vacuo electrospray source composed of a 50 μm inner diameter metal-coated fused-silica capillary offset by at most 1.5 mm from a metal extractor plate with an aperture diameter of 1.5 mm. The emitter placement results in an acceptance angle of ±26.6° into the source lens stack. In this work, the capillary emitter bias potential is held at +900 V, for cation emission operation, or −900 V, for anion emission operation, and the remainder of the required potential to deform the IL meniscus into a stable, single Taylor cone-jet (Taylor Reference Taylor1964) is placed on the extractor. Nominally, the remainder is between ±400 and ±1000 V depending on the specific IL being emitted. The typical extraction voltages used were the lowest amplitudes that sustained consistent emission without the cone-jet abruptly sputtering off. The operational voltages were determined by monitoring the emission current for approximately a 60 min period prior to any data acquisition. Adjustments to the voltage were done with approximately 100 V resolution. Charged species are emitted from the cone-jet and accelerated along the main axis of the instrument.
TOF instrument used to analyse IL electrospray ion beams in vacuum.

The electrospray ion source is mounted on an axis transverse to the TOF flight tube, as seen in figure 1. The total emission current generated off the emitter is monitored by a parallel resistor configuration applied to the capillary emitter electrical circuit. This circuit converts the voltage drop to the total emission current. This circuit configuration is a technique that was previously found to be equivalent to integrating the total angle-resolved ion current measured with a Faraday cup (Miller et al. Reference Miller, Prince, Bemish and Rovey2014). This equivalence is maintained as long as the current loss to the extractor due to beam divergence remains under 20 %. Proceeding along the main axis of the instrument in figure 1, emitted ions from the electrospray source are accelerated and focused by a series of electrostatic optics (i.e. Einzel lens and deflector lenses) so as to optimize the ion-beam current through a vertical slit just beyond the TOF ion extraction region, discussed below. This ion current is measured on a downstream Faraday cup detector. This particular optimization approach has been found to yield the greatest number of ions along the TOF axis when the instrument is operated in TOF mass spectrum generation mode (Miller et al. Reference Miller, Prince and Bemish2017).
The TOF ion extraction region sits between the electrospray source lens stack and the vertical slit described above. In this region, two plates each with a gridded aperture and termed extractor and repeller are mounted parallel to, but offset from the ion beam. These plates serve as a notch filter with respect to the kinetic energy of the ions. The low energy end of the filter results from a DC potential applied to both plates, which corresponds to the minimum kinetic energy per unit charge capable of transiting the TOF ion extraction region. The high energy end of the filter is relevant only during TOF operation. Introduction of ions into the TOF tube is accomplished by the addition of a 400 Vp–p pulse on top of the DC offset applied to the repeller plate for a set period of time. The application of the pulse introduces a transverse velocity component in addition to the remaining axial component for ions inside the extraction region during the pulsing event. Collision with components and the chamber wall along the TOF tube axis results for those ions with too large of a remaining axial velocity. Ions with sufficiently low enough residual axial velocity successfully pass into the TOF optimization and detector regions and are counted as described below. Simion 8.1 (Dahl Reference Dahl2000) studies for this experimental set-up (Miller et al. Reference Miller, Prince and Bemish2017) show that the notch filter provides a selection window of residual axial kinetic energies of approximately 25 eV q−1 in the centre of the extraction region. In summary, ions with kinetic energy up to 25 eV q−1 above the base DC potential are effectively injected into the TOF flight tube.
In this work, the pulse applied to the repeller plate was for a duration of 100 μs occurring at a frequency of 250 Hz. The pulse was a square wave type with 400 Vp–p added to the base DC potential as previously noted. This pulsing arrangement should allow mass-to-charge (m/q) species >1 000 000 amu q−1 to fully traverse the 13 mm distance between the two extraction region plates before the end of the pulse. TOF spectra at specific energy values were acquired by scanning through the various DC potentials in order to account for all of the different kinetic energies present in the emitted beam. In this work, mass spectra have been nominally collected in 25 V (25 eV q−1) steps over a range of ±300 to ±900 V. To track what kinetic energy range a particular spectrum encompasses and circumvent the copious usage of ‘potential’, we define the energy defect, ΔE, as
 \begin{equation}\mathrm{\Delta }E = {\Phi _{bias}} - K{E_{ion}},\end{equation}
where Φbias is the voltage bias of the capillary emitter (i.e. ±900 V) and KEion is the kinetic energy per charge of the ion corresponding to the DC potential on the two pulsing plates (Miller et al. Reference Miller, Prince and Bemish2017). Spectra are acquired by pulsing approximately 100 000 to 1 million times per energy defect, which provides an acceptable signal-to-noise ratio. A composite spectrum at a given volumetric flow rate, used in this work for qualitative trends only, is accomplished by interpolation and transformation of individual spectrum to a common mass axis (Miller et al. Reference Miller, Prince and Bemish2017).
For those ions successfully introduced to the TOF tube, they now enter the beam optimization region. This region consists of a three-element Einzel lens and deflector with voltages that are adjusted to maximize the ion signal across the entire width of the microchannel plate (MCP) detector at the end of the 2.0 m flight distance. A second stage of acceleration along the TOF flight tube path occurs between the extractor, held at the DC potential, and the first Einzel lens, which is held at ground. The bulk of the flight tube, ~1.0 m length, is field free after the beam optimization region excluding the electric field of the reflectron. The operation of the reflectron placed at the end of the 1.0 m flight tube doubles the overall ion flight distance and provides correction for the group velocity mismatch of identical m/q species generated in the extraction region. Since all orthogonally extracted ions have similar kinetic energies, the different m/q separate themselves according to velocity (time).
The number of ions occurring per unit time is directly measured through the counting of the fast electrical responses of the MCP, which is operated in event counting mode for all experiments. The signal generated from the ion beam impinging on the MCP passes through a pre-amplifier attached to a TOF counter card (P7887 Multiscaler, FAST ComTec) where the counts (events) are recorded on a PC. Generally, data shown here are acquired and binned using channel sizes of 256 ns, which gives a mass resolution of ~340 (M/ΔM, full width at half maximum) at a m/q of 1974 amu q−1 (1-butyl-3-methylimidazolium dicyanamide) for a 400 Vp–p pulse. This resolution decreases with increasing m/q. Dual chevron MCP performance for singly charged species under numerous detection conditions have been extensively studied and generally find that as m/q increases, the detection efficiency decreases (Gilmore & Seah Reference Gilmore and Seah2000; Fraser Reference Fraser2002; Liu, Li & Smith Reference Liu, Li and Smith2014). Large mass, highly charged species, on the other hand, have been found to have relatively constant detection efficiencies in event counting mode (Fontanese et al. Reference Fontanese, Clark, Horányi, James and Sternovsky2018; Gemer et al. Reference Gemer, Sternovsky, James and Horanyi2020; Llera et al. Reference Llera, Burch, Goldstein and Goetz2020). For a specific example, highly charged iron dust particles in the size range of 100 to 2000 nm with 20 to 300 m s−1 velocities were detected with a 6 ± 1 % efficiency (Fontanese et al. Reference Fontanese, Clark, Horányi, James and Sternovsky2018).
The ILs studied in this work include 1-ethyl-3-methylimidazolium bis(trifluromethylsu- lfonyl)imide (Strem Chemicals, Inc, 99 %), 1-butyl-3-methylimidazolium bis(triflurometh- ylsulfonyl)imide (Covalent Associates, Inc.), 1-butyl-3-methylimidazolium dicyanamide (EMD Chemical, Inc, 98 %) and 1-butyl-3-methylimidazolium tetrafluoroborate (Sigma- Aldrich, >98.5 %); respectively, EMI-IM, BMI-IM, BMI-DCA and BMI-BF4 in cation-anion acronym form. The ILs are used as purchased without further purification. The physical constants of these ILs are provided in table 1. In all cases, the values are taken as the average of 2–5 different reported values appearing in the literature for temperatures of ~293 K and standard pressure of ~101 kPa. The reference sources for the values are provided (see supplementary material available at https://doi.org/10.1017/jfm.2021.783). The dielectric values are exclusively for temperatures of ~298 K. These four ILs were selected because of the large availability of literature concerning their performance and behaviour in electrospray (Romero-Sanz et al. Reference Romero-Sanz, Bocanegra, Fernández de la Mora and Gamero-Castaño2003; Lozano & Martinez-Sanchez Reference Lozano and Martinez-Sanchez2005; Chiu et al. Reference Chiu, Gaeta, Heine, Dressler and Lavandier2006, Reference Chiu, Gaeta, Levandier, Dressler and Boatz2007; Lozano Reference Lozano2006; Miller, Prince & Rovey Reference Miller, Prince and Rovey2012) and capillary systems (Gamero-Castaño & Hruby Reference Gamero-Castaño and Hruby2001; Chiu et al. Reference Chiu, Levandier, Austin, Dressler Rainer, Murray, Lozano and Martinez-Sanchez2003, Reference Chiu, Austin, Dressler, Levandier, Murray, Lozano and Martinez-Sanchez2005; Gamero-Castaño Reference Gamero-Castaño2008b; Miller et al. Reference Miller, Prince, Bemish and Rovey2014). For this study, the IL is contained in a sealed reservoir and a capillary feed system, inserted directly into the IL, connects the reservoir to the capillary emitter (Miller et al. Reference Miller, Prince, Bemish and Rovey2014). Controlled pressure of dry nitrogen gas is applied to the reservoir to deliver and increment the liquid flow rate for operations of the order of nanolitres per second. The applied pressure to flow rate relationship is determined using the bubble method for a minimum of four discrete flow rates for each IL. The resultant applied pressure to flow rate data are linearly correlated and is extrapolated over the study's pressure regime (Miller et al. Reference Miller, Prince and Rovey2012, Reference Miller, Prince, Bemish and Rovey2014).
Surface tension, density, conductivity, viscosity and dielectric constant of the four ILs used in this study.

Experiments and analyses reported in the electrospray literature have identified scaling laws associated with electrospray operation over a wide range of volumetric flow rates. This subject has recently been reviewed by Gañán-Calvo and has been discussed in a large number of references contained within the review (Gañán-Calvo et al. Reference Gañán-Calvo, López-Herrera, Herrada, Ramos and Montanero2018). These identified scaling laws that are applicable to steady cone-jet operation where charge transport via conduction is succeeded by convection. In this case, the cone-jet transition region is significantly smaller than the electrospray capillary tip emitter (Fernández de la Mora & Loscertales Reference Fernández de la Mora and Loscertales1994; Gañán-Calvo Reference Gañán-Calvo1994; Rosell-Llompart & Fernández de la Mora Reference Rosell-Llompart and Fernández de la Mora1994; Gañán-Calvo et al. Reference Gañán-Calvo, Dávila and Barrero1997; Ponce-Torres et al. Reference Ponce-Torres, Rebollo-Muñoz, Herrada, Gañán-Calvo and Montanero2018). We will rely on the scaling laws first presented by Gañán-Calvo (Reference Gañán-Calvo1999). Later, the scaling was further expanded by Gañán-Calvo et al. (Reference Gañán-Calvo, López-Herrera, Herrada, Ramos and Montanero2018) and Ponce-Torres et al. (Reference Ponce-Torres, Rebollo-Muñoz, Herrada, Gañán-Calvo and Montanero2018). Per the work of Gañán-Calvo et al., Q 0, the characteristic flow rate, is defined as Q 0 = γε 0/(ρK) while the characteristic droplet diameter is defined as  ${D_0} = {[\gamma \varepsilon _0^2/(\rho {K^2})]^{1/3}}$. Similarly, the characteristic current, I 0, is given as
 ${I_0} = \gamma \varepsilon _0^{1/2}/{\rho ^{1/2}}$. In the above equations,
 $\gamma$ is the surface tension,
 $\rho$ is the density, K is conductivity and
 $\varepsilon_0$ is the permittivity of free space. The characteristic quantities for this experiment are compiled in table 2. The use of dimensionless values referenced to these characteristic quantities facilitates rapid prediction of a number of important quantities to the electrospray process at other volumetric flow rates, Q. Gañán-Calvo et al. analysed a large number of available experimental data and showed that the emitted droplet diameter, D, could be predicted from D = D 0(Q/Q 0)1/2. Similarly the emitted current, I, at a flow rate of Q can be predicted from I = 2.5I 0(Q/Q 0)1/2 where (Q/Q 0) is the dimensionless flow rate referenced to the characteristic flow rate of the liquid (Gañán-Calvo et al. Reference Gañán-Calvo, López-Herrera, Herrada, Ramos and Montanero2018). Here, we will use the expression describing the characteristic flow through the characteristic orifice to define v 0, a characteristic velocity, as
 ${v_0} = {Q_0}/[{\rm \pi} {({D_0}/(3.78))^2}]\sim 4.55({Q_0}/D_0^2) = 4.55$ UG, where UG is Gañán-Calvo's transition region characteristic axial velocity; UG results from the potential loss of the jet converting to kinetic energy and is equal to [γK/ρε 0]1/3 (Gañán-Calvo & Montanero Reference Gañán-Calvo and Montanero2009; Ponce-Torres et al. Reference Ponce-Torres, Rebollo-Muñoz, Herrada, Gañán-Calvo and Montanero2018). Preliminarily, v 0 is scaled by the known ratio of droplet radius to jet radius, RDrop/RJet, of 1.89, and v 0 will be revisited later in the paper.
Characteristic flow rate, current, droplet diameter and velocity for the four ILs in this study.

3. Results
Mass spectra were taken for BMI-DCA, BMI-IM, BMI-BF4 and EMI-IM ILs over a nominal kinetic energy range of 300 to 900 eV q−1 at discrete volumetric flow rates over the range of 0.28 to 3.25 nl s−1. Representative mass spectra, the sum of the various collected kinetic energy spectra, obtained using the orthogonal TOF instrument, are shown in figure 2 for BMI-DCA. Typical spectra for the three other ILs are provided in the supplemental information accompanying this report. In figure 2, the spectra on the left-hand side cover the domain below 4000 amu q−1 with the intensity axis plotted on a log scale. The right-hand side of figure 2 spans approximately 10 000 to 350 000 amu q−1 and is plotted against a linear intensity axis. Separate log and linear scales are needed to capture the large variation in intensity of the diverse collection of charged species. Throughout this work, the ‘q’ term should be taken as the integer net atomic charge of the charged species. The actual value of q is never directly measured in this work. The ions occurring in the lowest m/q values have sufficient mass resolution that they are directly assignable to ion clusters separated by the addition of n neutral pairs. For BMI-DCA, as an example, this spacing has the form BMI+-[BMI-DCA]n, where n = 0, 1, 2, 3, etc. Of the ions measured below 4000 amu q−1, the n = 0 and 1 clusters are typically the most intense with a generally smooth decrease in peak intensity as m/q increases. For all flow rates and ILs sampled, the kinetic energy composite spectrum shows a continuous series of singly charged ions out to at least 2000 amu q−1 and likely beyond but unresolved at larger m/q. Doubly charged species are also observed for all ILs, typically beginning in the range of 800 to 1500 amu q−1, and extending beyond 2000 amu q−1 before becoming unresolved. Higher multiply charged ions (i.e. q = 3, 4) are resolved in the case of the BMI-IM, likely due to the high molecular weight of the BMI-IM neutral pair creating larger spacing between clusters.
BMI-DCA mass spectrum for four flow rates. The left (log scale) and right (linear scale) axes use two different intensity scales to illustrate all of the measured ions. All four flow rates have the same intervals on vertical axes.

At higher mass-to-charge values, discrete ion peaks disappear and the spectra become congested, forming broad distributions. These distributions result from decreasing resolution and increasing overlap of the various n- and q-series. The typical higher m/q range (i.e. >10 000 amu q−1) of the spectra are further subdivided into two other distinct regions, each with a local maximum. The two distributions are observed in the right-hand side of figure 2 and, using the 0.31 nl s−1 flow rate as an example, contain a distribution centred near 25 000 amu q−1 and 80 000 amu q−1. These two distinct distributions occur in all the ILs studied, albeit with various m/q upper limit differences. Both regions are readily fitted with log-normal (LN) functions in mass-to-charge space and have an associated most-probable m/q value, x 0, that we will refer to as the ‘centroid’. We arbitrarily label these two distributions as low m/q and high m/q droplets. The high m/q droplet region has been detected for a maximum m/q value of 350 000 amu q−1 for BMI-DCA, 1 000 000 amu q−1 for BMI-IM, 600 000 amu q−1 for BMI-BF4 and 500 000 amu q−1 for EMI-IM over the flow rates examined. The low m/q droplets make up the LN distribution below 50 000 amu q−1 at all flow rates sampled. The BMI-DCA spectra exhibit the strongest low m/q droplet intensity of all four ILs. The high noise at the highest m/q values in figure 2 is the result of employing a scaling function to compensate for varying ion transport efficiencies at the highest m/q as the result of using a shorter pulsing length for BMI-DCA data collection. This had the effect of scaling the noise as well (Miller et al. Reference Miller, Prince and Bemish2017). Later experiments performed with the optimum 100 μs pulse length, such as those shown in figure 3, yielded identical droplet distributions but lacking the high level of noise seen in figure 2. These later experiments required no scaling function for compensation and resulted in lower noise for the m/q distributions.
(a) Contour plot of the mass spectra of EMI-IM at 0.72 nl s−1 (Q/Q 0 = 2540) at potentials in the range 300–900 V. The colours are on a log scale, with blue being the most significant intensity. (b) The composite spectrum summed from all data in (a) given as counts vs. m/q. The approximate locations of the various distributions, ions, low m/q and high m/q are given with the solid lines. (c) Slices of (a) at specific potential values, with the ion contributions (<5000 amu q−1) excluded. (d) Intensity of the six smallest mass-to-charge ions plotted against the pulsing plate base potential.

The effect of a systematic change in the flow rate on the mass spectrum is depicted in figure 2 and the corresponding alteration in the electrospray beam composition is discussed qualitatively. The small ion intensities are generally unchanged under 1000 amu q−1. Between 1000 and 2000 amu q−1 the ion peak intensities noticeably increase with the systematic increase in flow rate. Above 2000 amu q−1, the larger, more multiply charged species appear to slightly increase with the flow rate change. Switching to the right-hand component of the figure, both the low m/q and high m/q droplet distributions appear to reduce in overall signal intensity with the increasing IL flow rate. Additionally, the two distributions exhibit a change in width and centroid value with the increasing IL flow rate. The low m/q droplet not only reduces in intensity, but also narrows in width and the centroid value shifts to a lower m/q value with increasing flow rate. In contrast, the high m/q droplet distribution reduces in peak intensity but the distribution width increases and the centroid value shifts to large m/q values with increasing flow rate. The increase in width of m/q is more apparent in the higher m/q values than for the lower m/q values, signifying inclusion of more lower-charged droplets with the increasing flow rate. Although BMI-DCA is here being used as an example, the other ILs show similar trends with changing flow rate. The other ILs have significantly larger shifts of the centre of the high m/q droplet distribution as flow rate is changed.
While the composite mass spectrum depicted in figure 2 provides an approximation of the complete electrospray beam composition, the individual mass spectrum generated at each specific potential provides specific information about the kinetic energy properties of the two droplet distributions. An example of the typical energy dependence for the two LN distributions is shown in figures 3(a) and 3(c) for EMI-IM at 0.72 nl s−1. Figure 3(a) presents a contour map of the intensity as a function of the mass-to-charge and base DC potential applied to the plates in the pulsing region over the 300 to 900 V (energy defect, ΔE, from 600 to 0 eV q−1). Intense contributions below 50 000 amu q−1 are observed from approximately 450 to 700 V while contributions above 100 000 amu q−1 are found from 600 to 800 V. The composite mass spectrum (integrated along the potential axis) is shown in figure 3(b) for the ‘0’ to 900 000 amu q−1 range. Small ions dominate the spectrum below 2500 amu q−1, while the two droplet distributions compose the remainder of the spectrum. As also observed in the BMI-DCA cases presented in figure 2, a small decrease in intensity separates the two distributions in the composite spectrum. Figure 3(c) presents horizontal slices of selected energies in figure 3(a). These spectra have been ‘smoothed’ by binning the data into 500 amu q−1 bins. Spectra from potential values ranging from 500–800 V (ΔE from 400 to 100 eV q−1) are presented to highlight the behaviour of the two droplet distributions. While the experimental measurements are performed along the potential degree of freedom, we will at this point transition to discussing the results in terms of energy defects. At ΔE = 400 eV q−1, only the low m/q droplet distribution is measured and spans an m/q range under 50 000 amu q−1. At ΔE = 300 eV q−1, the high m/q and low m/q droplet components are both present but have a fair degree of overlap, complicating their analysis and encompass the m/q range from 5000 to 200 000 amu q−1. At ΔE = 250 eV q−1, the high m/q droplet component has separated from the low m/q droplet component and spans from approximately 100 000 to 350 000 amu q−1. The low m/q component remains similar to the ΔE = 400 eV q−1 case albeit with a change in overall intensity. The dashed line demonstrates the efficacy of a dual LN fit applied simultaneously to both the low m/q and high m/q components contributing at this energy. The increasing separation between the low m/q and high m/q continues as the energy defect decreases, with the high m/q droplets encompassing a range of larger and larger m/q values while the low m/q distribution appears essentially identical to the distribution found at ΔE = 400 eV q−1, again acknowledging decreases in intensity but no significant shift in distribution. By ΔE = 100 eV q−1, only the high m/q distribution is present and the distribution spans the 250 000 to 500 000 amu q−1 range. More broadly, each IL and flow rate measured exhibits similar behaviour for the low m/q and high m/q distributions as a function of energy defect (or potential). From this, a general behaviour for the two m/q droplets is established: (i) the low m/q droplets do not persist to the lowest energy defect values while the high m/q droplets do; (ii) the high m/q droplets are present at lower energy defects than the low m/q droplets; (iii) the low m/q droplets remain relatively fixed in terms of the m/q range, while the high m/q droplets shift toward higher m/q values with decreasing ΔE; (iv) and the centroid m/q value of the high m/q distribution is directly correlated with the energy defect. The ion intensity versus potential is presented in figure 3(d) for the six smallest ions with mass-to-charge values ranging from 111 to 2066 amu q−1. The intensity peaks for all six ions at approximately ΔE = 400 eV q−1. The most intense ion at this flow rate is the 502 amu, except at the lowest energy defects where the 111 amu ion becomes the most intense. The smallest ions are observed at all measured potential values albeit at significantly reduced intensity relative to their respective maxima.
Both the low and high m/q droplet distributions in the composite and individual energy defect mass spectra are generally well reproduced by LN distributions. These fits reduce the visual clutter caused by baseline noise in the original data and allow separation of the two distributions when they slightly overlap. The LN distribution as a function of the energy defect for only the high m/q droplet is provided in figure 4. The high m/q droplet data shown are for the IL BMI-IM at 2.29 nl s−1 and represent different ΔE values with an interval of 25 eV q−1 from 150 to 525 eV q−1. The LN distribution for the lowest ΔE occurs at the highest m/q values and each ΔE distribution shifts to lower m/q values with increasing ΔE. The intensity at the centroid value of the distribution appears relatively symmetric about ΔE = 350 eV q−1 and is minimized at the extreme ΔE values. Each distribution at a given ΔE is represented by a unique m/q centroid value that correlates inversely to ΔE. It is clear that identical m/q values occur at several different energy defects and that a single energy defect spans a significant m/q range, generally of the order of 100 000s of amu q−1, as seen in figure 4. The example of the high m/q droplet shown in figure 4 is reflected in the data of all four ILs.
LN fits to high m/q droplet components of BMI-IM at 2.29 nl s−1 for ΔE values incremented by 25 eV q−1. Highlighted are the lowest ΔE value – long dash fit and highest ΔE value – small dash fit.

Similar trends in the integrated and individual mass spectra are observed when the polarity of the electrospray electrodes is reversed and anions are emitted. Generally, the energy composite anion spectra can be divided into the same three regions as seen in the cation spectrum. The same correlation between the high m/q droplet centroid and ΔE is seen in the anion data. To explore the nature of the low m/q droplets, the number of TOF sweeps averaged per each kinetic energy scan was increased from 100 000 to four million, producing a highly resolved spectrum with an improved signal-to-noise ratio. For BMI-IM at 0.96 nl s−1, a four million sweep spectrum was collected out to 40 000 amu q−1. This highly resolved spectrum showed a cyclical pattern of doubly charged, triply charged and higher multiply charged ions persisting into an unresolved oscillation on the rising low m/q droplet distribution, suggesting that the two regions are not as clearly distinct as previously demonstrated. From this highly resolved spectrum, it appears that the low m/q droplet LN distribution is partly the result of the detection system’s inability to fully resolve all of the charged species present in the electrospray beam. See figure S3 in the supplemental material for anion data.
Figures 3 and 4 demonstrate the energy defect dependence of the m/q distribution for the high m/q droplet component for all flow rates sampled. As previously noted, a LN distribution readily fits the observed data for this distribution. From the fitting process, the centroid or most-probable m/q value (x 0), amplitude, width values and integrated area were extracted and subsequently analysed for each energy defect and for all flow rates. The extracted centroid values are shown in figure 5 for two selected flow rates of each IL. In the figure, the centroid values have been converted to kg C−1 units and transformed into 1/2⋅m/q values to aid extraction of the jet parameters, which will be addressed later in the discussion section. For ease of assessing the slope and intercept, the data are plotted against the DC potential used for detection instead of ΔE. In each case shown, there is a clear linear relationship between the measured centroid value and the potential. Since the base DC potential applied to the extraction region reflects the approximate ion/droplet kinetic energy of those species successfully introduced to the TOF tube axis, figure 5 also implies a linear relationship between the centroid and energy. Since the high m/q component varies significantly for each unique IL and flow rate, each panel of figure 5 has a different domain with BMI-DCA high m/q droplets detected out to 1.0 × 10⁻³ kg C−1, EMI-IM and BMI-BF4 under 2.0 × 10⁻³ kg C−1 and BMI-IM out to 3.5 × 10⁻³ kg C−17. Generally, the measured slopes of the best fitted data decrease as flow rate is increased, but results in which only a few energy defects were sampled are less conclusive. The range of the figure makes clear that the high m/q droplets of sufficient intensity are detectable over a range of hundreds of volts (or eV q−1).
The m/q centroid, x 0, values of the LN fit to the high m/q droplet component for the four ILs at two different flow rates. Note the BMI-DCA IL is represented by circle, EMI-IM is represented by diamonds, BMI-IM is represented by squares and BMI-BF4 is represented by triangles. The lines represent linear fits to the selected data.

Figure 6 demonstrates the relationship between integrated intensity versus energy defect of the detected charged species for both small ions (<2000 amu q−1) and the high m/q droplet for the IL EMI-IM at two different flow rates. These results are representative of other ILs and flow rates sampled in this investigation but not shown here. In this figure, the intensities of both species have been scaled to 1 at their respective maxima for ease of comparison. In both flow rates, the bulk of the ion intensity appears at the greatest energy defect and is always offset at energies below that of the large droplets. As flow rate is increased, the ions shift to greater ΔE, generally separating further from the high m/q droplet. The intensity profile of the high m/q droplets is well modelled by a Gaussian profile with the centre always offset from the emitter bias potential. A Gaussian profile is consistent with the intensity profile demonstrated in figure 4, where the maximum intensity of each energy defect distribution occurs at mid-range m/q values. The droplet profile has a full width at half maximum (FWHM) of 200 to 300 eV q−1. Generally, for all four ILs, the lower flow rates have a narrower FWHM for the droplet of the order of 150 eV q−1 and this expands with increasing flow rate to a FWHM of the order of 300–400 eV q−1. In contrast, the FWHM of the ions is typically 50–100 eV q−1 and the bulk of the population always appears at greater energy defect compared with the droplets. The intensity profiles of both the droplets and ions appear to be almost symmetrically distributed about some mean energy defect value at all flow rates. Neither the ions nor high m/q droplets are distributed at a ΔE value near the emitter bias potential. Thus, the ions and high m/q droplets are not emitted directly from the cone or transition region of the cone-jet.
Integrated ion peaks and droplet distributions of EMI-IM charged particles that have been scaled to allow for comparison of the relative FWHM and centroid values at two flow rates. The vertical lines mark the centroids of a Gaussian fit to each data set and the arrows indicate the direction of shift with increasing flow rate.

Figure 7 compares the m/q value derived from dividing the mass flow rate (Q) by the emitter current (I) and the weighted average of the high m/q droplet component of the integrated spectrum for three liquids at selected flow rates. In all cases, the experimental m/q value is lower than the value expected assuming mass flow divided by current. The values most closely agree at the volumetric lowest flow rates where the EMI-IM and BMI-DCA values differ by 30 % and 50 % from the Q/I values. The absolute difference between the values typically increases with flow rate. Deviation from the Q/I value could be attributed to a number of different possibilities including (i) inefficient detection of large m/q species, (ii) mass and charge of a jet emission event split into a number of different particles (with unique mass and charge values) that should ultimately be added together in a modified weighted average value or (iii) reflect loss mechanisms inherent to the flight of the ion beam through the instrument.
Comparison of the weighted average (WA) of the high m/q distribution to the ratio of the mass flow rate divided by the emitter current (Q/I) for three liquids at selected flow rate values.

4. Discussion
4.1. Connection to scaling laws
The measurement of the high m/q distribution appearing along small mass-to-charge species suggests that the operational mode at these flow rates is that of the mixed ion–droplet form. Several studies have demonstrated a link between total emission current and liquid parameters appropriate for the single cone-jet operating in a mixed ion–droplet mode (Fernández de la Mora & Loscertales Reference Fernández de la Mora and Loscertales1994; Gañán-Calvo Reference Gañán-Calvo1997; Gañán-Calvo et al. Reference Gañán-Calvo, Dávila and Barrero1997; Gamero-Castaño & Fernández de la Mora Reference Gamero-Castaño and Fernández de la Mora2000). Our attention here is on the recent work of Gañán-Calvo et al. that has demonstrated broad applicability, for both neat systems and solutions, of the predictive capability using dimensionless values (Gañán-Calvo et al. Reference Gañán-Calvo, López-Herrera, Herrada, Ramos and Montanero2018). Figure 8(a) presents the experimental current measurements (top) and predicted mean droplet diameter (bottom) converted into dimensionless values of I/I 0 and D/D 0 plotted against the dimensionless flow rate, Q/Q 0. The theoretical values, numerically evaluated from a best fit of a large number of systems, are shown as the dashed line. The EMI-IM and BMI-IM current values have an average deviation of +13.5 % and −14.3 % from the theoretical prediction. Beyond the slight offset, the data points parallel the ideal behaviour with perhaps some deviation at the lowest flow rates measured. The average reproducibility of the reported current measurements had a standard deviation of <3 % for 12 separate flow rates. ‘Error bars’ on the EMI-IM data depict the maximum extent (95 % confidence) of values possible using two times the standard deviation of the values for the reported physical parameters used to populate table 1. The extended ranges show excellent overlap with the theoretical prediction. Taken as a whole, the data of the four ILs illustrate that the emission current scaling law well reproduces the experimental current at the selected volumetric flow rates and the experimental current is consistent with that of a single cone-jet structure operating in a mixed ion–droplet mode. The predicted D/D 0 is shown for EMI-IM and BMI-IM as the other liquids also lie along the same line when plotted against Q/Q 0 and are not included to reduce overlap. The strong data correspondence for D/D 0 is the result of the similar physical property values of the ILs. The predicted D/D 0 as compared with the droplet diameter derived from experimentally measured values will be discussed below. Under the assumption that the emission process involves only the mean droplet with the predicted diameter, the mean mass, m, of the droplet is easily determined using (4.1)
 \begin{equation}m = \rho (4/3{\rm \pi} R_{Drop}^3),\end{equation}
where ρ is the density and RDrop is the radius of the droplet. The number of emitted droplets per second is then subsequently calculated so as to properly conserve mass. The measured emission current can then be distributed into mean charges per droplet and the average mass-to-charge value of the droplet readily determined. This value, which will agree with simply dividing the total mass flow by the total current flow, is shown in the top plot of figure 8(b) for three liquids, EMI-IM, BMI-IM and BMI-DCA, again as a function of the dimensionless flow rate. At the flow rates studied in this work, the expected primary droplets typically have significant charge values.
Comparison of the emitter output per dimensionless flow rate for the electrosprayed ILs BMI-IM, BMI-BF4, EMI-IM and BMI-DCA using the dimensionless scaling laws of Gañán-Calvo et al. (Reference Gañán-Calvo, López-Herrera, Herrada, Ramos and Montanero2018); (a – top) dimensionless current output with the dashed line representing the theoretical prediction; (a – bottom) theoretical prediction of the dimensionless mean droplet diameter. The results overlap for each IL, thus only two are illustrated; (b – top) theoretical and experimental m/q values of the mean droplet shown for three ILs; (b – bottom) theoretical ratio of droplet mean charge to Rayleigh charge limit. The initial emitted mean droplets are expected to be super Rayleigh above Q/Q 0 = 2147.

In the bottom of figure 8(b), the ratio of expected mean charge to the Rayleigh charge limit is shown as a function of dimensionless flow rate. The Rayleigh charge limit (qray) of a sphere is given as (4.2)
 \begin{equation}{q_{Ray}} = \; {[8{{\rm \pi} ^2}{\varepsilon _0}\gamma {(2{R_{Drop}})^3}]^{1/2}},\end{equation}
where γ is the surface tension and ε 0 is the permittivity of free space. A dashed line in the figure divides the ratio at which the mean primary droplets are expected to be stable from those expected to be super-Rayleigh (>1). For all four liquids examined, the transition from sub- to super-Rayleigh occurs at a Q/Q 0 value of 2147 as illustrated and is determined by evaluating q/qRay = 1 ≈ 0.147⋅(Q/Q 0)1/4. The data of BMI-DCA show the best agreement with this intersection point. Having established that previously determined scaling laws also apply in these experiments, we now turn our discussion to the experimentally determined jet velocities.
4.2. Determination of jet breakup quantities
The linear relationship between the offset DC potential and the high m/q droplet centroid value presented in figure 5 has been previously observed in studies of solutes dissolved in volatile solvents by Gamero-Castaño for a much larger droplet m/q value (Gamero-Castaño Reference Gamero-Castaño1999, Reference Gamero-Castaño2008a, Reference Gamero-Castaño2010; Gamero-Castaño & Hruby Reference Gamero-Castaño and Hruby2002). In those works, the kinetic energy, measured as the stopping distance required far downstream from the jet, was shown to describe the kinetic energy initially imparted by the jet and the energy gained as a result of the electric field in the acceleration zone. The resulting kinetic energy, E, of the emitted ions in this situation is
 \begin{equation}E = \frac{1}{2}mv_{Jet}^2 + q{\varPhi _{Tip}} \to \frac{E}{q} = \frac{1}{2}\left( {\frac{m}{q}} \right)v_{Jet}^2 + {\varPhi _{Tip}},\end{equation}
where vJet is the mean velocity of the jet at the point where the charged particles are released, m is the mass of the charged species, q is the charge of the species and ΦTip is the potential at which the jet breaks up and charged species are emitted. The kinetic energy per unit charge (E/q, right side of (4.3)) is readily determined by simple algebraic manipulation. In this altered form, the base DC potential applied to the two plates in the pulsing region is directly linked to the E/q value, within the ~25 eV q−1 window described in the experimental section, while the mass spectrometer directly measures the m/q value of the ion. We again note that the base DC potential serves as a low-resolution stopping potential analyser of the emitted ion beam.
The high m/q droplet centroid data are presented as DC potential (E/q) vs. 1/2 m/q (all in SI units) in figure 9 for the IL BMI-IM at several selected flow rates. A linear modelling well fits the data at all flow rates. In accordance with (4.3), the slope and intercept values correspond to vJet and ΦTip. The square root of the slope is the jet velocity component and the intercept is directly the potential at the jet tip. For each BMI-IM electrospray flow rate probed, a mean jet velocity and jet breakup potential are now known. In addition to the high m/q droplet centroids, the potentials of the detected ions (i.e. n = 0–5) for some of the sampled flow rates are illustrated at the lowest m/q values. These BMI-IM ion data points are representative of the peak value of the ion data of EMI-IM illustrated in figure 6. Thus, the most intense population of ions align with the breakup potential of the high m/q droplets. As a result, at these flow rates, both the small ions and high m/q droplets appear to originate from the same location, namely, the end of the extended jet structure and not from the neck region of the Taylor cone.
BMI-IM data plotted for potential versus mass-to-charge ratio. The data points represent the high m/q droplet distribution centroids for select flow rates. Note the open symbols represent the singly charged ions n = 0–5 at each flow rate and correspond to the y-intercept potentials, ΦTip.

The coefficients vJet and ΦTip derived from the fits illustrated in figure 9 have been tabulated for all four ILs at select flow rates in table 3. The error values are at the 1-sigma confidence level (1σ). ΦIons is found by the best fit of a Gaussian distribution to the ion intensity vs. energy defect/potential data (i.e. the example ion distribution seen in figure 6). The lower uncertainties for the BMI-IM and BMI-BF4 results reflect the finer energy defect probing used for those specific liquids. The EMI-IM data points with lower uncertainties also reflect a finer energy defect probing of 25 eV q−1 intervals. For the set of flow rates and ILs measured, jet velocities ranging from 360 to 1000 m s−1 are measured with typical uncertainties of approximately 10 % to 40 %. Of the studied ILs, BMI-DCA data provided the highest velocities, of the order 700 to 1000 m s−1, which is nearly twice the velocity of EMI-IM and BMI-IM data points. The averaged jet velocities over the studied flow rates for BMI-DCA, EMI-IM, BMI-IM and BMI-BF4 are 824 (±110), 528 (±61), 442 (±58) and 615 (±41) m s−1 at the 1σ level uncertainty, respectively. In the case of cation versus anion performance, the limited BMI-IM anion results are consistent with the surrounding cation data within the uncertainties. Thus, we conclude similar jet velocities and breakup potentials are achieved no matter the charge polarity of the electrospray system. The measured jet breakup potential values, ΦTip, span from 150 to 600 V and are below the emitter bias potential of 900 V. As a result, there is significant potential loss (i.e. ΔΦ = Φbias − ΦTip) along the cone-jet of the four neat ILs measured at all flow rates examined; ΔΦ is included in table 3, which removes the particulars of our specific instrument and reflects the results of the physics occurring at the electrospray source.
High m/q droplet distribution projected velocity and breakup potential for select flow rates of all four ILs. The errors represent the accuracy of the linear data fit; ΔΦ is the associated potential loss values for the droplets and ions. Ions – singly charged ions of n = 0, 1, 2, etc. aAnion emission data point.

The tabulated ΔΦ, vJet, and associated error values are illustrated together in figure 10(a,b). The abscissa is given as mass flux to present the data independently of the associated IL density; mass flux is obtained by multiplying the flow rate by the appropriate IL density. Additionally, the results reported by Gamero-Castaño (Reference Gamero-Castaño2008b) and Gamero-Castaño and Cisquella-Serra (Reference Gamero-Castaño and Cisquella-Serra2021) on neat EMI-IM electrospray are added to figure 10, noted as EI, GC1 and EI, GC2, respectively. The mean potential loss, in figure 10(a), increases significantly as the mass flux increases, spanning nearly 600 V over the 2.5 × 10⁻¹⁰ to 4.28 × 10⁻⁹ kg s−1 range. The data for the ILs overlap well with the 1σ level uncertainties included; BMI-DCA and EMI-IM deviate the most around 3.0 × 10⁻⁹ kg s−1. The TOF measurements obtained here for EMI-IM compare well with the data reported by Gamero-Castaño. The combined potential loss values of our data and Gamero-Castaño are fit by an offset exponential functional form. The associated function, valid for at least the mass flux range stated above, is
 \begin{equation}\Delta \varPhi = A - B \cdot {exp ^{( - (Q - C)/D)}},\end{equation}
where A is 693 (±40, at 2σ), B is 498 (±41), C is 1.368 × 10⁻¹⁰, D is 1.27 × 10⁻⁹ (±3 × 10⁻¹⁰) and Q is the mass flow rate given in kg s−1. The wider applicability of the jet breakup potential loss beyond these measured liquids is not currently known. We interpret the measured values as an indication that the breakup of the droplet from the jet occurs at relatively similar locations in the electric field regardless of the IL electrosprayed. The similarity in this potential loss is potentially due to the similar surface tension properties of the four ILs and that the forces induced by the application of the electric field to the charged liquid and the cohesive forces responsible for the surface tension dictating jet shape are nearly equivalent across the ILs. Inclusion of a liquid with much larger or smaller surface tension in future experiments can aid in resolving this unknown.
Illustrated electrospray data of the high m/q distribution partly listed in table 3; (a) the potential loss along the cone-jet, ΔΦ; (b) the mean breakup velocity; (c) the dimensionless jet radius, RJet/D 0, (filled markers) and dimensionless primary droplet diameter, DD/D 0 (open markers); (d) the jet radius normalized with Gañán-Calvo's characteristic radius RG (Gañán-Calvo et al. Reference Gañán-Calvo, López-Herrera, Herrada, Ramos and Montanero2018). The additional EMI-IM data from Gamero-Castaño (Reference Gamero-Castaño2008b) and Gamero-Castaño and Cisquella-Serra (Reference Gamero-Castaño and Cisquella-Serra2021) are shown for comparison; noted in the legend as GC1 and GC2, respectively. The error bars represent the accuracy of the linear data fit as seen figure 9.
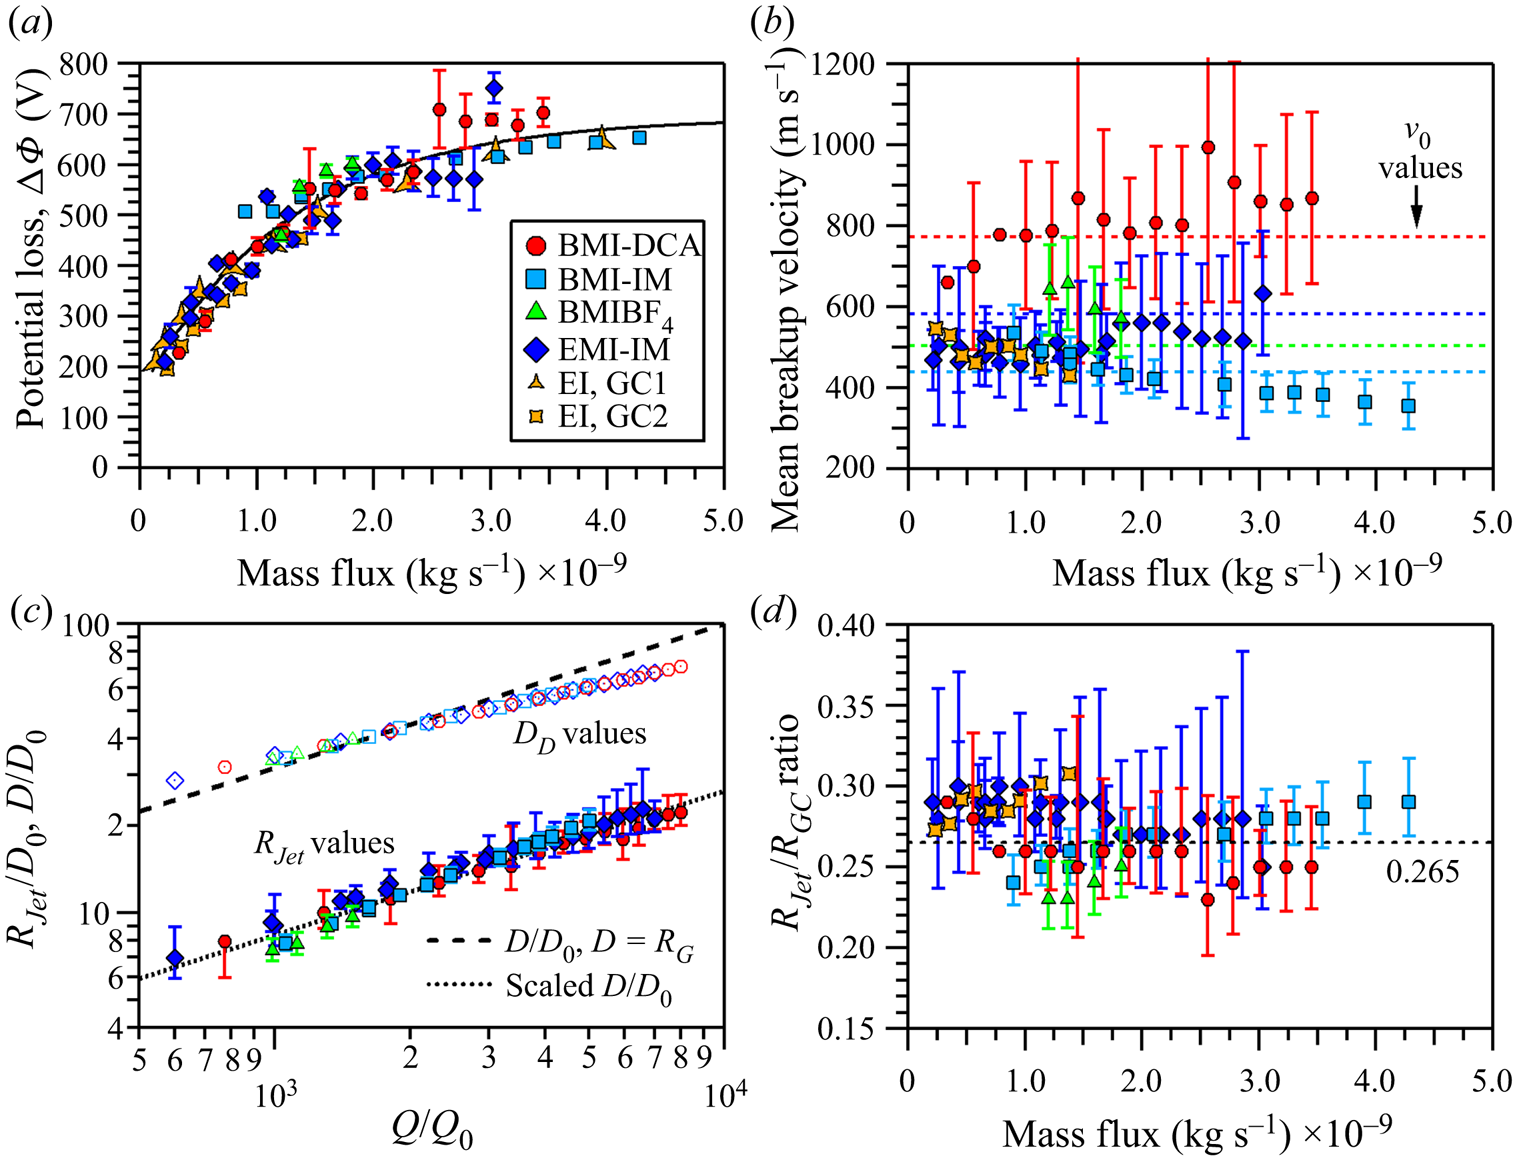
The jet velocity data are illustrated in figure 10(b), but no distinguishable functional form can be identified. Each IL data set appears to operate within a range of velocities and considering the 1σ level uncertainty may suggest a near constant velocity value for each IL. Larger uncertainties are linked to those experiments that did not as finely probe the kinetic energy values (e.g. 50 eV q−1 instead of 25 eV q−1 step sizes). As one example, the EMI-IM velocity derived from experiments with kinetic energy resolution of 25 eV q−1 exhibit smaller 1σ level uncertainties, narrowing the velocity range from 300 to 700 m s−1 down to a range of 400 to 600 m s−1. A source of comparison for the experimentally measured velocity is to make direct evaluation to Gañán-Calvo's characteristic velocity, UG (Gañán-Calvo & Montanero Reference Gañán-Calvo and Montanero2009; Ponce-Torres et al. Reference Ponce-Torres, Rebollo-Muñoz, Herrada, Gañán-Calvo and Montanero2018). We noted in presenting table 2 that UG can be scaled by 4.55, which is a factor associated with a radius ratio of 1.89 (RDrop/RJet), to obtain our own characteristic velocity, v 0. The v 0 values listed in table 2 and illustrated as dotted lines in figure 10(b) are comparable to the average velocities as well as of the same order as the experimental values, falling within the range of uncertainties of the respective IL. While the widths of the uncertainties support a radius ratio of 1.89, they would also support a number of other potential ratio values. If instead the scale factor is based on the radius ratio associated with the given flow rate and not on a constant, then v 0 at each IL flow rate can be calculated from scaling UG by a factor of [2(RDrop/RJet)]2/ ${\rm \pi}$. When the factor values are plotted with vJet/UG for each IL (figure S5), the values fall within the uncertainty of each vJet/UG value, suggesting a correlation between UG and vJet via the actual RDrop/RJet value. The value discrepancies may be due to over-estimating the portion of ΔΦ that is going directly into the jet kinetic energy and UG. There have been reports of energy converted to heat in the electrospray process (Gamero-Castaño Reference Gamero-Castaño2010). We will discuss the determination of the actual RDrop/RJet ratios in the paragraphs below.
In figure 10(c), the jet radius, RJet, and droplet diameter, DD, values are presented as dimensionless quantities versus the dimensionless flow rate Q/Q 0. The RJet value is directly determined from the vJet values by RJet = [Q/( ${\rm \pi}$vJet)]1/2; RJet values at select flow rates are listed in table 4. The determination of DD will be discussed in the paragraphs below. Two lines are plotted in figure 10(c) with the dashed line representing D/D 0, where D = RG , and the dotted line representing a scaled D/D 0 of 3.78−1⋅(D/D 0). The RG term is Gañán-Calvo's characteristic radius and evaluates as RG = [ρε 0Q 3/(γK)]1/6 (Gañán-Calvo et al. Reference Gañán-Calvo, López-Herrera, Herrada, Ramos and Montanero2018). The 3.78−1 factor accounts for the change to radius and includes an RDrop/RJet ratio of 1.89. The dotted line overlies the jet radius data, suggesting 1.89 is a good correspondence between D/D 0 and RJet/D 0. However, the data points are scattered about the dotted line and do not lie directly on the line, suggesting there is some variation to the radius ratio, RDrop/RJet. We have already presented in figure 8(a) the results of evaluating the scaling of D/D 0 using Q/Q 0. In figure 8(a) these values directly lie on the dashed line. Given the limitations of the TOF technique used here, the analysis methodology and the quality of the data, we cannot definitively determine a droplet diameter directly from the experiment. The electrification and viscous effects will now be considered to determine the impact on RDrop/RJet and the droplet diameter.
Parameters used for the primary droplet estimation. Here, RD is the primary droplet radius associated with the maximum growth rate of the jet perturbation and is equal to DD/2. aAnion emission data point. ILs listed are BMI-DCA – BD, EMI-IM – EI, BMI-IM – BI and BMI-BF4 – BB.

4.3. Determination of the critical droplet radius
Gamero-Castaño and Hruby (Reference Gamero-Castaño and Hruby2002) and Gamero-Castaño and Cisquella-Serra (Reference Gamero-Castaño and Cisquella-Serra2021) explored the case of equipotential jet breakup evaluating the electrification and viscous effects on the perturbation driving jet breakup. In the case of neat EMI-IM (Gamero-Castaño & Cisquella-Serra Reference Gamero-Castaño and Cisquella-Serra2021), the authors noted that the equipotential breakup is appropriate as the characteristic flow time during breakup significantly exceeded the electrical relaxation time at the flow rates examined. This situation similarly occurs at all flow rates sampled in our work. Given the rapid electrical relaxation times vis-à-vis the characteristic flow time, the surface charge is likely at equilibrium throughout the breakup. Other effects that lead to non-symmetric perturbations and instabilities such as those pertaining to the development of lateral, kink and ramified emission modes may be factors in the jet breakup that are not included in our or the previous authors approach. In the case of the perturbation in an uncharged and inviscid jet, the radius ratio is 1.89 and generally assumed as the ideal ratio of electrospray breakup. Gamero-Castaño engaged in linear instability analysis to determine the growth rate of the perturbation and the associated droplet radius produced from jet breakup; specifically evaluating the case of a perturbation with a positive growth rate and a wavelength λ yields the associated droplet radius as  ${R_{Drop}} = {[(3/4)\lambda R_{Jet}^2]^{1/3}}$. At the maximum growth rate, the perturbation will generate droplets at a critical radius of RD. Applying the analysis requires understanding that increasing electrification in the jet will result in a destabilizing effect while increasing viscosity has a stabilizing impact. This means that the initial growth rate σ is a function of the perturbation wavenumber (e.g. wavelength), electrification and viscosity. The measure of jet electrification is expressed by the dimensionless Taylor number
 \begin{equation}\varPsi \cong \frac{{{\alpha ^2}{\beta ^3}}}{4}{\left( {\frac{Q}{{{Q_0}}}} \right)^{1/2}},\end{equation}
where α is the scaling of I/I 0 = α(Q/Q 0)1/2. We assign α = 2.6 based on the fit of measurements for a large group of liquids including EMI-IM (Gañán-Calvo et al. Reference Gañán-Calvo, López-Herrera, Herrada, Ramos and Montanero2018). The β term is simply the ratio of the jet radius normalized by Gañán-Calvo's characteristic radius, β = RJet/RG. This ratio is plotted versus the mass flux in figure 10(d) with the 1.89 ratio noted as the dotted line at ~0.265. The value remains roughly constant with flow rate, ranging in value from 0.23 to 0.32, which represents an approximate spread from the 0.265 value (dotted line) of ±15 %. As Gamero-Castano noted, the geometry of the transition region of the cone-jet is invariant to changing flow rate and with a near constant dimensionless jet radius, the invariance extends from the transition region to the jet breakup. The viscous effect is provided by the dimensionless viscous parameter J
 \begin{equation}J \cong \beta {\left( {\frac{Q}{{{Q_0}}}} \right)^{1/2}}Re_K^2.\end{equation}
For J, ReK is another dimensionless quantity that can be determined from ReK = [ρε 0γ 2/(μ 3K)]1/3. Both the Taylor number and J are provided in table 4 for select flow rates. Only three values of J were used for the analysis as Gamero-Castaño has noted the values of J do not have a significant impact for liquids with these electrical conductivities and Taylor numbers; the same wavenumber was obtained regardless of the J value. Additionally, the wavenumber x expressed in terms of wavelength is x = 2 ${\rm \pi}$(RJet/λ). The growth rate σ(x, J, Ψ) of a perturbation is evaluated by a system of two equations of
 \begin{gather}\sigma \frac{{\rho R_{Jet}^2}}{\mu } = {y^2} - {x^2},\end{gather}
 \begin{gather}\begin{array}{ccccc} & 2{x^2}({x^2} + {y^2})\dfrac{{{{I^{\prime}}_1}(x)}}{{{I_0}(x)}}\left[ {1 - \dfrac{{2xy}}{{{x^2} + {y^2}}}\dfrac{{{I_1}(x){{I^{\prime}}_1}(y)}}{{{{I^{\prime}}_1}(x){I_1}(y)}}} \right] - ({x^4} - {y^4})\\ & \quad = J\left\{ {x(1 - {x^2})\dfrac{{{I_1}(x)}}{{{I_0}(x)}} - \varPsi \dfrac{{x{I_1}(x)}}{{{I_0}(x)}}\left[ {1 + \dfrac{{x{{K^{\prime}}_0}(x)}}{{{K_0}(x)}}} \right]} \right\} \end{array}\end{gather}
and requires eliminating the y-term. Again, (4.7) and (4.8) consider only an axisymmetric breakup mode and no other effects on the electrospray system. The associated wavenumber at the maximum growth rate x* is extracted from this system. Thus, the wavelength λ* at the maximum growth rate yields the critical droplet radius of RD
 \begin{equation}\frac{{{R_D}(J,\mathrm{\Psi })}}{{{R_{Jet}}}} = {\left( {\frac{3}{4}\frac{{{\lambda^\ast }}}{{{R_{Jet}}}}} \right)^{1/3}}.\end{equation}
The values of RD and RD/RJet are listed in table 4 for select flow rates. Note that the RD/RJet values range between 1.5 and 2.3, which is indicative of the value for all the flow rates and ILs studied. This analysis indicates that the IL electrosprays studied here do not breakup with the same value found for an uncharged and inviscid system. Figure 10(c) presents the generated droplets in terms of diameter, DD. The dimensionless droplet diameters overlap the line of D/D 0, but do not quantitatively overlie this line. The droplet diameter significantly deviates from D/D 0 at the largest flow rates for all ILs measured and can be attributed to the influence of the breakup wavelength on the system. Deviation from D/D 0 starts near the Q/Q 0 value of 2147 corresponding to the Rayleigh limit associated with the scaling law presented earlier in figure 8. For our data, a Taylor number of approximately Ψ = 1.54 represents the point that the jet electrification term reaches the Rayleigh limit. As shown in the table 4 for all four ILs, the Taylor number exceeds this value around a Q/Q 0 value of 2000. Non-symmetric perturbations could be a factor in breakup once the appropriate flow rate and Rayleigh limit are reached. These perturbations are not considered in this study. The evaluation of (4.9) for the four neat ILs finds that the electrification and viscous effects are a factor that must be considered in the electrospray analysis. For RDrop = RD, the values of m, qRay and m/qRay of the primary droplet for each IL and flow rate can be determined. These values are also listed in table 4 for select flow rates. The droplet mass and Rayleigh limit are calculated via (4.1) and (4.2). These primary droplets have mass values spanning the range of 0.5 × 10⁸ to 15.0 × 10⁸ amu and are capable of carrying hundreds of charges. BMI-IM electrosprays generate primary droplets with the most mass over the flow regime.
4.4. Modelling the jet breakup and droplet characteristics
The data presented with figures 2–5 clearly indicate that the mass spectrum is significantly more complicated than the simple estimation of the mean m/q value. A diversity of m/q values is measured within the experimental data and volumetric flow rates are examined that expect the mean droplet to have a charge exceeding the Rayleigh charge limit (see figure 8b). The measurement of the species at specific potential values facilitates a deeper understanding of the variance in the breakup potential and jet velocity or, alternatively, a reflection of the dynamics occurring as the ion beam propagates downstream away from the jet. The smoothed fits to the droplet component of the mass spectrum in figure 4 demonstrate that a common m/q value is represented in multiple stopping potential values. Figure 11(a) presents the intensity of selected m/q values, in 50 amu q−1 bins, between 100 000 to 500 000 for BMI-IM at a flow rate of 0.96 nl s−1 (Q/Q 0 = 1620) as a function of the base DC potential. The intensity of a specific m/q value often spans more than 100 V and all distributions sampled are well modelled with a Gaussian functional form. Figure 11(b) provides the statistical outputs of the fitting including the mean potential for the specific m/q value and the FWHM value describing the potential width. A variation of the FWHM from low to high mass-to-charge, increasing in value, is observed in every data set examined in this work.
(a) Intensity of selected m/q values as a function of the base plate potential. (b) Statistical outputs of Gaussian fits to the distributions. FWHM values are offset in x by 25 000.

The variance in the FWHM values with respect to m/q indicates that the kinetic energy properties of the droplets in the emitted beam originating from the jet cannot be exclusively attributed to only subtle variations in the length of the jet. Small length variations would be expected to expose the jet breakup to slightly different breakup potentials. As the jet breakup potential is independent of m/q in (4.3), small variations in breakup potentials should result in identical FWHM distribution widths in figure 11(b) for all m/q values. A diversity of jet velocities should also have a significant effect on the resulting kinetic energy distribution. According to (4.3), small changes are more likely to have more significant impacts on the larger m/q values as it pertains to the E/q widths. Doubling of the m/q value with any velocity width chosen should result in a doubling of the width of the E/q distribution. A comparison of the 200 000 and 400 000 amu q−1 FWHM values in figure 11(b) gives values of 95 and 140 V, respectively. The data do not support either the velocity or length distribution being unilaterally responsible for the resulting kinetic energy profiles of the charged species. Under the assumption that in-flight, charge-repulsion dynamics has a minimal role in the resulting axial kinetic energies of the ions, we examine what variations in jet parameters are necessary so as to reproduce the measured distributions.
Twelve data sets of BMI-IM at various flow rates were analysed similarly to the analysis shown in figure 11. For each data set, the intensity versus potential of slices every 25 000 amu q−1 from 100 000–600 000 amu q−1 were examined and the centre and FWHM values at each m/q value were recorded. First, (4.3) was used to find the vJet and ΦJet that minimized the error in reproducing the E/q (potential, V) value expected for a specific m/q point (i.e. the black circles in figure 11b). To reproduce the width of the distribution, a value for the variance in the jet velocity and potential (vunc and Φunc, respectively) was used. A custom script was generated that modelled these uncertainties numerically in which vunc or Φunc served as the standard deviation of a Gaussian distribution from which random values would be selected. The expected axial kinetic energies of 5 million charged species per m/q value were populated through this random selection from each of these distributions individually which were then added to their respective vJet or ΦJet value. A histogram was generated from the resulting ensemble and the resulting Gaussian distribution (a function of E/q) was fit. The output FWHM values of this simulation were compared directly with the experimental FWHM values. The validity of the variance values was assessed by minimizing the sum of the chi square values determined for each individual m/q value in a given data set. The values of the individual data sets are given in the supplemental information (table S1) while the statistical output values for all of the data sets are now discussed. The average of vunc was found to be 27.4 ± 1.5 m s−1 (1σ) and Φunc = 33.9 ± 3 V (1σ) for all sets examined. In the limit that the jet dynamics is the only contributor to the distributions, the variance of velocity of the jet predicts droplet diameters that have standard deviations of approximately 6 % (and droplet mass by approximately 9 %). This estimation of droplet diameter variance is in good agreement with the work of Gamero-Castaño (Reference Gamero-Castaño2010), which noted that a standard deviation of the ensemble of droplet diameters was approximately 6 %–7 % while the standard deviation of the charge was 17 %–22 % for an EMI-IM solution dissolved in propylene carbonate.
A significant limitation of the TOF experiments described in this report is the inability of the system to differentiate the specific mass and specific charge of the individual droplets. The analysis of the results is thus limited to the ability to infer information directly from the mass-to-charge ratio of the detected species and to apply previously validated approaches, such as the empirical scaling laws frequently described above. We define primary droplets as those that compose the bulk of the mass emitted from the end of the jet and represent the droplet expected from the jet with approximate radius given by (4.9). The bulk of the individual points shown in figures 9 and 11 is for droplets that have charge values that would be super-Rayleigh if the only droplets emitted are these primary droplets. We will refer to satellite droplets as those other droplets, such as those with mass-to-charge values below the Rayleigh limit of the primary droplet, which originate from either the remnants of the jet not incorporated in the primary droplet or some additional dynamical process involving subsequent breakup of the primary droplet.
Six exemplar kinetic energy-integrated mass-to-charge distributions for BMI-IM at 0.54, 0.95 and 1.88 nl s−1 and EMI-IM at 0.14, 0.72 and 1.13 nl s−1 are shown in figure 12. We choose to focus on the mass spectrum data from the lower volumetric flow rates because there is minimal expected current loss to the extractor plate and the effect of plume divergence on the analysis is expected to be minimized (Miller et al. Reference Miller, Prince, Bemish and Rovey2014). The integrated spectrum (black/grey) is generated by binning each kinetic energy specific spectrum into 500 amu q−1 bins and then summing the individual transformed spectra at each specific kinetic energy. The vertical dashed lines indicate the lowest m/q value at which the primary droplet is expected to survive assuming RD in table 4; those primary droplets with mass-to-charge ratios to the left of the vertical line would be super-Rayleigh and those to the right would be sub-Rayleigh. These composite spectra demonstrate that if only primary droplets were present, nearly every counted species would have charge values exceeding the Rayleigh limit. In an attempt to identify characteristics of the droplets that are measured within a requirement to balance emitted mass and charge in the complete beam, we explored a model that treats the composite spectrum as being composed of three distinct masses. In this ‘Model 1’, the component at the largest m/q values is considered the primary droplet with its mass and associated Rayleigh limit calculated directly from values in table 4. Any ions with mass-to-charge values occurring below the mass-to-charge associated with the Rayleigh limit were directly added to a second distribution, the large droplet (a satellite droplet). This transfer of population from primary to large is not shown in figure 12. A third distribution, associated with the smallest charged species was also included (small droplet). Finally, any counted event occurring below 7000 amu q−1 was taken to be a singly charged ion with mass equal to the mass-to-charge value. The mass values of the large droplet and small droplet were taken as fit parameters and their respective Rayleigh limits were calculated and recursively solved. For those charged species with mass-to-charge values less than the m/qRay value of the large droplet, the intensity would be directly added to the small droplet distribution. As an example of the division in these values, the EMI-IM data in figure 12 have three vertical lines that delineate the boundary between the primary droplet and large droplet (dashed), the large droplet and small droplet (dot-dash) and the small droplet and ions (dot). These lines are the result of the best fits approach described in the paragraph below. The charge for each droplet distribution at a given m/q was determined by division of the respective droplet mass value by the m/q value associated with the specific bin. We must also note that the small droplet component is subject to some overlap with the low m/q droplet distribution, which will lead to larger uncertainties in its values.
Kinetic energy integrated mass spectrum for EMI-IM and BMI-IM at six flow rates. Dashed line indicates the expected m/qRay value of the primary droplet, the dash-dot line indicates the m/qRay value of the large droplet while the dotted line indicates the m/qRay value of the small droplet.

Under the assumption that the detector efficiency is approximately identical for all droplets measured (Fontanese et al. Reference Fontanese, Clark, Horányi, James and Sternovsky2018; Gemer et al. Reference Gemer, Sternovsky, James and Horanyi2020; Llera et al. Reference Llera, Burch, Goldstein and Goetz2020), the total mass and total charge measured can be estimated by multiplication of the counts by the respective (mass and charge) value for all species counted in the mass spectrum. These values are then added to the mass and charge expected from the singly charged ions, which contribute little to both summed values. The composite summed mass value is multiplied by a constant so as to reproduce the mass flow of the entire beam as determined from the volumetric flow rate. This constant then multiplies the summed charge value and an evaluation of the deviation of total modelled charge from total emitted charge is undertaken. Treatment of the entire measured spectrum as primary droplets results in mean charge errors of +192 % when analysed in this way. Application of the described approach in Model 1 to 12 data sets from EMI-IM and BMI-IM results in mean unsigned errors in the charge of 10.5 % with a general overestimation of charge in the BMI-IM cases (+3.0 to +27.6 % at the extremes) and 8.5 % in the EMI-IM cases (−14.0 to +9 % signed errors at the extremes). We speculate that the EMI-IM analysis performs better than BMI-IM analysis because BMI-IM has droplets with larger m/q values and that our detector efficiency must be less for these high mass with lower relative charge value species.
A selection of the results for the Model 1 analysis of BMI-IM and EMI-IM are given in table 5 for the primary, large and small droplets. While specific values for mass and charge are given, the jet velocity analysis indicated that emitted species will have some width to their values. Since the mass of each component droplet is fixed in this analysis, the width of the distribution is ultimately reflected in the charge range. The range of charges are the values expected for the middle 80 % of droplets with the given mass. As noted in the introduction of Model 1 above, the primary droplet distribution is not allowed to extend to lower m/q values than the m/qRay value. The part of the distribution that would exceed is directly added to the large droplet component. The primary droplets exhibit charge values mostly concentrated near the Rayleigh limit with the range expanding, on an absolute basis, as the flow rate increases. The width of the charge distribution typically constitutes 14 %–28 % of the Rayleigh limit. In the case of EMI-IM, the large droplet component is 25.3 % (±3 %) of the mass of the primary droplet while the small droplet is smaller and comprises only 9.9 % (±5.3 %) of the same mass. For the average values of six flow rates of EMI-IM analysed with Model 1, the primary droplet made up 21 ± 6 % of the total counted species above ~50 000 amu q−1 while the large droplet is 55 ± 7 % and the small droplet is 22 ± 5 %. The species above 50 000 amu q−1 range from approximately 16 % to 56 % of the total counted events in the EMI-IM mass spectrum. The individual ions and the low m/q components make up the remainder. At Q = 1.13 nl s−1, the primary droplets carry ~45 % of the mass and 30 % of the charge while the large droplets carry ~53 % and 62 %, respectively.
Model 1 analysis results from selected liquids and flow rates for EMI-IM (EI) and BMI-IM (BI). Here, m is given in amu, q is given in integer charges and represents the range in which the middle 80 % of the charge is contained and qRay is the Rayleigh charge of the primary droplet. Pri, primary droplet; Lg, large droplet; and Sm, small droplet.

The BMI-IM data are considerably different when the same analysis is employed to find the mass of the large and small droplet components. When the error in measured charge is quantified, the result with minimized charge error is to simply exclude a multi-component fit to the spectrum, with the exception of the primary droplet and one additional droplet component. Low m/q droplets and ions are still measured and do contribute as well, although they are not quantified in table 5. The best fits are accomplished for all flow rates sampled by establishing a small mass droplet with values of the order of 105 amu. In terms of number of events, these small mass droplets dominate the spectrum, often contributing more than 80 % of the total charged species events recorded. As a result of their low mass and the broad m/q range covered, the bulk of their charge range is measured in the low integer number of charges. At Q = 1.13 nl s−1, the primary droplets carry ~95 % of the total mass and ~90 % of the total charge in the error minimized Model 1 result.
Our interpretation of the results has relied on the analysis of a number of different measured quantities in the experiment that will be briefly summarized here. With exception of the low m/q distribution of species and a small percentage of the intensity of small ions, the emitted electrospray beam appears to be completely reconcilable with direct emission from the jet tip with allowance for some variation in the velocity and breakup point. Droplets with m/q values below the Rayleigh limit cutoff for the predicted primary droplets are observed in the mass spectrum. Assuming the high m/q contributors to the mass spectrum carry essentially all the mass and charge of the beam, mass and charge measured downstream can be conserved to the near-field measurements (when properly multiplied by a common constant) by treating the high m/q component with a number of distinct distributions in which the primary droplet makes up the component at the higher m/q values and considerably smaller mass (and charge) components compose the rest of the observed total distribution. In this framework, the jet emits a number of massive primary droplets and a significantly larger quantity of satellite droplets. Because the kinetic energy profile of these satellite droplets behaves similarly to the primary droplets, it is difficult to ascribe their generation to Coulomb explosions of the primary droplets unless it occurs within extremely short time scales so as to appear with potential values that approximate the breakup region of the jet. Additionally, our data cannot exclude the case of the satellite droplets forming in the actual jet breakup as left over mass and charge.
The kinetic energy behaviour of the low m/q distribution, demonstrated for example in figure 3(a) and figure S2 (supplemental), significantly deviates from the remainder of the components previously addressed. If values from the low m/q distribution were added to the data presented in figure 9, it would generate a series of points well represented by a vertical line around an x-value of 1.3 × 10⁻⁴ kg C−1. This anomalous behaviour is not easily reconciled by changes in jet velocity or breakup potential. We believe the generation of this component should be ascribed to Coulombic breakup of some component in the post-jet ion beam described above. The nearly identical m/q distribution appearing over a broad kinetic energy range is indicative that these species cannot directly originate from the jet. The wide variability of kinetic energies for common m/q values is the result of the cast-off (or Coulomb explosion) event occurring with variable time scales post-emission. These cast-off droplets experience different lengths of time exposed to the electric field at their final mass-to-charge value, generating a diversity of different resulting energy defects. This would agree with recent measurements of EMI-IM at similar flow rates by Gamero-Castaño and Cisquella-Serra (Reference Gamero-Castaño and Cisquella-Serra2021) who ascribed anomalous behaviour by low mass-to-charge species as resulting from Coulombic explosion of droplets with significant charge values. To estimate the size of these cast-off species we turn to the highest resolution spectrum that was generated for BMI-IM, presented in figure S3. This spectrum shows a progression ascribable to ions with small q values that becomes un-resolvable when q reaches 4–5 charges but clearly extends to larger m/q values with the most significant intensity around 20 000 amu q−1, consistent with the values of the low m/q distribution measured. At the apparent maximum, if q were ‘5’, the resulting mass would be approximately 100 000 amu and the associated radius would be ~3.0 nm. Whether such species should be arbitrarily labelled ‘ions’ or ‘droplets’, we note that low m/q distributions are present and the kinetic energy behaviour is similar at all flow rates, including those where the mean primary droplet is not expected to exceed the Rayleigh limit but our assessment of the charge distribution includes some primary droplets that would.
5. Conclusions
(i) We have reported on kinetic energy-resolved mass spectrometric measurements for four neat ILs operating from a single in vacuo capillary electrospray emitter over the 0.3 to 3.3 nl s−1 volumetric flow rate range using an orthogonal TOF mass spectrometer to provide kinetic energy measurements to specific species in the ion beam. In all cases, stable electrospray emission results in a broad distribution including singly and multiply charged species.
(ii) For all liquids sampled and at all flow rates, three distinct distributions were identified: ions, which are spaced in m/q by the value of their respective neutral pairs and include multiply charged (low q value) species; unresolved low m/q droplets, which are typically in the 10 000–40 000 amu q−1 range in these measurements; and unresolved high m/q droplets, which extend from 50 000 amu q−1 to hundreds of thousands of amu q−1, depending on the liquid.
(iii) An analysis was attempted that conserves mass and charge measured downstream to that at the emitter and was applied to the lowest flow rates only where beam divergence related artefacts are minimized. Charge values near the Rayleigh limit are found for the primary droplets. Mean unsigned errors of 10.5 % in the total charge are found, assuming perfect mass correspondence in an analysis of 12 data sets involving two liquids. The analysis performed better for EMI-IM than BMI-IM which is attributed to lower detector efficiencies of the larger m/q values of the primary droplets in BMI-IM.
(iv) Measurement of the kinetic profiles of the high m/q droplets (mass-to-charge values typically larger than 50 000 amu q−1) confirm the kinetic energy loss experienced in the jet of EMI-IM observed by previous authors. In addition, we have demonstrated an experimentally derived link between mean jet breakup potential and mass flow rate including providing a semi-quantitative empirical relationship.
(v) Measurements of the mean jet velocity are consistent with the limited publications of EMI-IM electrospray results; determination of the mean jet radius from the velocity measurements is reasonably consistent with those publications as well. The calculation of the critical primary droplet radius for each flow rate reveals that the droplet radius to jet radius ratio does not prescribe to the 1.89 value associated with an uncharged, inviscid jet. Instead, the electrification and viscous effects in the jet results in values from 1.5 to 2.3 over the studied flow regimes. The experimental evidence and associated analysis suggest that Coulomb fission events occur in the electrospray process.
(vi) The kinetic energy distribution of the ensemble of primary, large and small droplets can be reconciled by assuming a Gaussian variance in the velocity with a standard deviation of 27.4 ± 1.5 m s−1 (1σ) and variance in the breakup potential with a standard deviation of Φunc = 33.9 ± 3 V.
(vii) The combined analysis of primary, large and small droplets suggests that these are either formed directly from conventional jet breakup or must be formed very close to the jet breakup region.
(viii) The low m/q distribution kinetic energy profile deviates significantly from the high m/q distribution and we suggest that these species (with radius typically several nm) are the result of Coulombic breakup of one of the components of the high m/q distribution.
Supplementary material
Supplementary materials are available at https://doi.org/10.1017/jfm.2021.783.
Acknowledgments
S.W.M. acknowledges the support of Boston College Institute of Scientific Research funded through contract number FA9453-17-C-0001. J.R.U.-S. acknowledges a summer scholar internship through the Universities Space Research Association.
Funding
This work was supported by Air Force Office of Scientific Research under task number 19RVCOR039 (program manager M. Berman).
Declarations of interests
The authors report no conflict of interest.



