Introduction
Familial predisposition and environmental stress in early life have independently been evidenced to be among the strongest risk factors for the development of affective disorders (Williamson et al. Reference Williamson, Birmaher, Axelson, Ryan and Dahl2004; Gilbert et al. Reference Gilbert, Widom, Browne, Fergusson, Webb and Janson2009). Heritability rates for major depressive disorder (MDD) range at approximately 40% and subjects at genetic liability are thought to have a threefold increased risk for the onset of the disease (Sullivan et al. Reference Sullivan, Neale and Kendler2000; Williamson et al. Reference Williamson, Birmaher, Axelson, Ryan and Dahl2004). By analogy, history of early-life adversity has been evidenced to significantly increase the risk for MDD and to lead to a more severe course of disease including an earlier onset and higher rates of treatment resistance (Gilbert et al. Reference Gilbert, Widom, Browne, Fergusson, Webb and Janson2009; Teicher & Samson, Reference Teicher and Samson2013).
However, both familial and environmental risk often co-occur since childhood adversity has been proven to be more prevalent and to cause worse effects in subjects from families with a familial liability for affective disorders (Chaffin et al. Reference Chaffin, Kelleher and Hollenberg1996; Rice et al. Reference Rice, Harold, Shelton and Thapar2006; Zimmermann et al. Reference Zimmermann, Brückl, Lieb, Nocon, Ising, Beesdo and Wittchen2008; Chemtob et al. Reference Chemtob, Gudiño and Laraque2013).
To elucidate the biological implications of different risk factors, various recent neuroimaging studies focused on brain structural differences in depressive and high-risk samples compared with healthy controls. Thus it could be shown that brain structural alterations are highly heritable and that grey matter reductions in areas suspected to be involved in emotion processing are apparent in subjects at high familial risk but also in subjects exposed to early environmental stress (Drevets et al. Reference Drevets, Price, Simpson, Todd, Reich, Vannier and Raichle1997; Baaré et al. Reference Baaré, Vinberg, Knudsen, Paulson, Langkilde, Jernigan and Kessing2010; Price & Drevets, Reference Price and Drevets2010; Rao et al. Reference Rao, Chen, Bidesi, Shad, Thomas and Hammen2010; Amico et al. Reference Amico, Meisenzahl, Koutsouleris, Reiser, Möller and Frodl2011; Dannlowski et al. Reference Dannlowski, Stuhrmann, Beutelmann, Zwanzger, Lenzen, Grotegerd, Domschke, Hohoff, Ohrmann, Bauer, Lindner, Postert, Konrad, Arolt, Heindel, Suslow and Kugel2012; Chaney et al. Reference Chaney, Carballedo, Amico, Fagan, Skokauskas, Meaney and Frodl2014; Dager et al. Reference Dager, McKay, Kent, Curran, Knowles, Sprooten, Göring, Dyer, Pearlson, Olvera, Fox, Lovallo, Duggirala, Almasy, Blangero and Glahn2015; Hibar et al. Reference Hibar, Stein, Renteria, Arias-Vasquez, Desrivières, Jahanshad, Toro, Wittfeld, Abramovic, Andersson, Aribisala, Armstrong, Bernard, Bohlken, Boks, Bralten, Brown, Mallar Chakravarty, Chen, Ching, Cuellar-Partida, den Braber, Giddaluru, Goldman, Grimm, Guadalupe, Hass, Woldehawariat, Holmes, Hoogman, Janowitz, Jia, Kim, Klein, Kraemer, Lee, Olde Loohuis, Luciano, Macare, Mather, Mattheisen, Milaneschi, Nho, Papmeyer, Ramasamy, Risacher, Roiz-Santiañez, Rose, Salami, Sämann, Schmaal, Schork, Shin, Strike, Teumer, van Donkelaar, van Eijk, Walters, Westlye, Whelan, Winkler, Zwiers, Alhusaini, Athanasiu, Ehrlich, Hakobjan, Hartberg, Haukvik, Heister, Hoehn, Kasperaviciute, Liewald, Lopez, Makkinje, Matarin, Naber, Reese McKay, Needham, Nugent, Pütz, Royle, Shen, Sprooten, Trabzuni, van der Marel, van Hulzen, Walton, Wolf, Almasy, Ames, Arepalli, Assareh, Bastin, Brodaty, Bulayeva, Carless, Cichon, Corvin, Curran, Czisch, de Zubicaray, Dillman, Duggirala, Dyer, Erk, Fedko, Ferrucci, Foroud, Fox, Fukunaga, Gibbs, Göring, Green, Guelfi, Hansell, Hartman, Hegenscheid, Heinz, Hernandez, Heslenfeld, Hoekstra, Holsboer, Homuth, Hottenga, Ikeda, Jack, Jenkinson, Johnson, Kanai, Keil, Kent, Kochunov, Kwok, Lawrie, Liu, Longo, McMahon, Meisenzahl, Melle, Mohnke, Montgomery, Mostert, Mühleisen, Nalls, Nichols, Nilsson, Nöthen, Ohi, Olvera, Perez-Iglesias, Pike, Potkin, Reinvang, Reppermund, Rietschel, Romanczuk-Seiferth, Rosen, Rujescu, Schnell, Schofield, Smith, Steen, Sussmann, Thalamuthu, Toga, Traynor, Troncoso, Turner, Valdés Hernández, van 't Ent, van der Brug, van der Wee, van Tol, Veltman, Wassink, Westman, Zielke, Zonderman, Ashbrook, Hager, Lu, McMahon, Morris, Williams, Brunner, Buckner, Buitelaar, Cahn, Calhoun, Cavalleri, Crespo-Facorro, Dale, Davies, Delanty, Depondt, Djurovic, Drevets, Espeseth, Gollub, Ho, Hoffmann, Hosten, Kahn, Le Hellard, Meyer-Lindenberg, Müller-Myhsok, Nauck, Nyberg, Pandolfo, Penninx, Roffman, Sisodiya, Smoller, van Bokhoven, van Haren, Völzke, Walter, Weiner, Wen, White, Agartz, Andreassen, Blangero, Boomsma, Brouwer, Cannon, Cookson, de Geus, Deary, Donohoe, Fernández, Fisher, Francks, Glahn, Grabe, Gruber, Hardy, Hashimoto, Hulshoff Pol, Jönsson, Kloszewska, Lovestone, Mattay, Mecocci, McDonald, McIntosh, Ophoff, Paus, Pausova, Ryten, Sachdev, Saykin, Simmons, Singleton, Soininen, Wardlaw, Weale, Weinberger, Adams, Launer, Seiler, Schmidt, Chauhan, Satizabal, Becker, Yanek, van der Lee, Ebling, Fischl, Longstreth, Greve, Schmidt, Nyquist, Vinke, van Duijn, Xue, Mazoyer, Bis, Gudnason, Seshadri, Ikram, Martin, Wright, Schumann, Franke, Thompson and Medland2015; Knowles et al. Reference Knowles, McKay, Kent, Sprooten, Carless, Curran, de Almeida, Dyer, Göring, Olvera, Duggirala, Fox, Almasy, Blangero and Glahn2015). More precisely, grey matter abnormalities were independently detected in overlapping brain areas including the hippocampus in different healthy and depressed study samples at familial or environmental risk for MDD (Chen et al. Reference Chen, Hamilton and Gotlib2010; van Harmelen et al. Reference Tzourio-Mazoyer, Landeau, Papathanassiou, Crivello, Etard, Delcroix, Mazoyer and Joliot2010; Teicher et al. Reference Teicher, Anderson and Polcari2012; Opel et al. Reference Opel, Redlich, Zwanzger, Grotegerd, Arolt, Heindel, Konrad, Kugel and Dannlowski2014). However, none of these studies systematically controlled for possibly differing neurostructural effects of both family history of disease and former childhood adversity at the same time or even controlled for the respective other risk constellation.
Hence, the unnoticed simultaneous occurrence of familial predisposition and environmental stress might prove to be a major obstacle in the attempt of recent studies to confine the precise impact of each of these conditions on brain structure.
A second considerable limitation of previous neuroimaging studies on risk factors in depression might be the exclusive use of univariate group-level analyses. Previous neuroimaging studies revealed comparable brain structural alterations in high-risk study samples and MDD patients alike suggesting that pre-existing neurostructural traits might play a major role in the development of the disease (Rao et al. Reference Rao, Chen, Bidesi, Shad, Thomas and Hammen2010; van Tol et al. Reference Van Harmelen, van Tol, van der Wee, Veltman, Aleman, Spinhoven, van Buchem, Zitman, Penninx and Elzinga2010; Cole et al. Reference Cole, Costafreda, McGuffin and Fu2011; Kempton et al. Reference Kempton, Salvador, Munafò, Geddes, Simmons, Frangou and Williams2011). The search for imaging correlates of MDD risk factors as possible vulnerability markers for the disease has frequently been argued to provide the basis for effective preventive measures and adjusted treatment options for high-risk subjects (Rao et al. Reference Rao, Chen, Bidesi, Shad, Thomas and Hammen2010; Amico et al. Reference Amico, Meisenzahl, Koutsouleris, Reiser, Möller and Frodl2011; Teicher & Samson, Reference Teicher and Samson2013). However, for this purpose a robust prediction of illness risk at an individual level seems to be the basic requirement (Savitz et al. Reference Savitz, Rauch and Drevets2013). Since pattern classification has recently been evidenced to possibly bridge the gap between clinical practice and basic research in affective disorders by providing reliable individual-level prediction using neuroimaging data (Mwangi et al. Reference Mwangi, Ebmeier, Matthews and Steele2012; Redlich et al. Reference Redlich, Almeida, Grotegerd, Opel, Kugel, Heindel, Arolt, Phillips and Dannlowski2014), it appears indispensable to apply these techniques in the search for intermediate risk phenotypes of MDD which might facilitate earlier and more specific therapeutic interventions for high-risk subgroups.
Therefore, with this study we aimed to uncover possible similarities and differences between brain structural characteristics of genetic predisposition and environmental stress in early life by using a combined VBM/pattern recognition approach.
We hypothesized: (a) that univariate VBM analyses would reveal familial and environmental risk for MDD to be associated with different patterns of grey matter reductions in areas involved in emotion processing; (b) that by using multivariate pattern classification healthy subjects at risk for the disease would successfully be detected referring to the potential of pattern classification for future clinical applications; and (c) that a combination of both techniques would enable us to detect healthy high-risk subjects by directly focusing on morphological alterations associated with MDD, thus pointing to the decisive role of shared brain structural alterations in MDD and its risk factors.
Method
Subjects
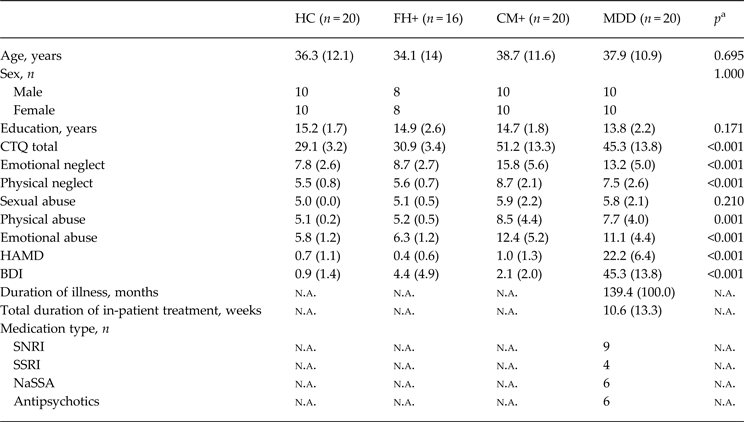
Our final study sample comprised 20 healthy control subjects (HC), 20 acutely depressed MDD patients (MDD), 16 healthy first-degree relatives of MDD patients (FH+) and 20 healthy subjects exposed to environmental stress in terms of former childhood maltreatment experiences (CM+) (see Table 1). A total number of 22 FH+ subjects were originally recruited for the present study of which six subjects were directly excluded due to a history of severe childhood trauma (see exclusion criteria below), leaving 16 FH+ subjects for the final study sample. Age- and sex-matched HC, CM+ and MDD subjects were randomly drawn from a larger ongoing study base (Münster Neuroimaging Cohort) (Dannlowski et al. Reference Dannlowski, Grabe, Wittfeld, Klaus, Konrad, Grotegerd, Redlich, Suslow, Opel, Ohrmann, Bauer, Zwanzger, Laeger, Hohoff, Arolt, Heindel, Deppe, Domschke, Hegenscheid, Völzke, Stacey, Meyer Zu Schwabedissen, Kugel and Baune2015; Opel et al. Reference Opel, Redlich, Grotegerd, Dohm, Heindel, Kugel, Arolt and Dannlowski2015b ; Redlich et al. Reference Redlich, Grotegerd, Opel, Kaufmann, Zwitserlood, Kugel, Heindel, Donges, Suslow, Arolt and Dannlowski2015). All patients were under current in-patient treatment at the University Hospital of Münster. In order to assess the influence of psychopharmacological therapy in the MDD sample, medication load was coded in terms of dose and treatment durations into levels from 1 to 4 according to the suggestions of Sackeim as applied in previous studies (Sackeim, Reference Sackeim2001; Surguladze et al. Reference Surguladze, Brammer, Keedwell, Giampietro, Young, Travis, Williams and Phillips2005; Dannlowski et al. Reference Dannlowski, Ohrmann, Konrad, Domschke, Bauer, Kugel, Hohoff, Schöning, Kersting, Baune, Mortensen, Arolt, Zwitserlood, Deckert, Heindel and Suslow2009; Opel et al. Reference Opel, Redlich, Zwanzger, Grotegerd, Arolt, Heindel, Konrad, Kugel and Dannlowski2014). The FH+ group consisted of healthy first-degree relatives of MDD patients under current or former in-patient treatment at the University Hospital of Münster. All but one of the FH+ participants were unrelated to the MDD patients of our study to avoid strong overlaps in previous environmental experiences. Clinical diagnoses were obtained using the Diagnostic and Statistical Manual of Mental Disorders, 4th edition (DSM-IV) Structured Clinical Interview (SCID-I) in all participating subjects and additionally in the depressed relatives of the FH+ group (Wittchen et al. Reference Wittchen, Wunderlich, Gruschwitz and Zaudig1997). To assess the current level of depressive symptoms the Hamilton Rating Scale for Depression (Hamilton, Reference Hamilton1960) and the Beck Depression Inventory (Beck & Steer, Reference Beck and Steer1987) were administered. Subjects of the CM+ and the HC group were recruited via newspaper advertisement with no apparent link to childhood maltreatment indicated. All participants of the CM+ and HC group reported to be without first-degree relatives suffering from MDD. Exclusion criteria included any history of severe neurological (e.g. concussion, stroke, tumour, neuro-inflammatory diseases) and medical (e.g. cancer, chronic inflammatory or autoimmune diseases, infections) conditions. All healthy subjects (HC, FH+, CM+) were ensured to be free from any history of psychiatric disorders or any psychotropic medication. Presence and level of childhood maltreatment were evaluated with the Childhood Trauma Questionnaire (CTQ) assessing five types of adverse early-life experiences by means of a 25-item retrospective self-report questionnaire (Bernstein et al. Reference Bernstein, Fink, Handelsman, Foote, Lovejoy, Wenzel, Sapareto and Ruggiero1994). CTQ dichotomous cut-off scores were applied to distinguish subjects who experienced significant forms of abuse and neglect from non-maltreated individuals as proposed by Walker et al. (Reference Walker, Gelfand, Katon, Koss, Von Korff, Bernstein and Russo1999). Following this approach a subject was classified as having experienced significant forms of former childhood abuse or neglect if the person reached a predefined score for at least one of the five CTQ subscales (cut-off scores for each subscale: physical abuse >8, sexual abuse >8, physical neglect >8, emotional abuse >10, emotional neglect >15) (Walker et al. Reference Walker, Gelfand, Katon, Koss, Von Korff, Bernstein and Russo1999). Whereas all CM+ subjects met these criteria for former maltreatment experiences, participants of the FH+ and HC group were ensured to be free from any history of significant early-life abuse or neglect.
Sociodemographic and clinical characteristics of our study sample

Data are given as mean (standard deviation) unless otherwise indicated.
HC, Healthy controls; MDD, major depressive disorder; FH+, healthy first-degree relatives of MDD patients; CM+, healthy subjects exposed to former childhood maltreatment; CTQ, Childhood Trauma Questionnaire; HAMD, Hamilton Rating Scale for Depression; BDI, Beck Depression Inventory; n.a., not applicable; SNRI, serotonin and norepinephrine reuptake inhibitors; SSRI, selective serotonin re-uptake inhibitors; NaSSA, noradrenergic and specific serotonergic antidepressants.
a Group differences were measured with analysis of variance or χ2 tests.
The Ethics Committee at the University of Münster approved the study. After complete description of the study to the subjects, written informed consent was obtained.
Image acquisition
T1-weighted high-resolution anatomical images of the head were acquired (Gyroscan Intera 3T, Philips Medical Systems, the Netherlands) using a three-dimensional fast gradient echo sequence (turbo field echo), with a repetition time of 7.4 ms, echo time = 3.4 ms, flip angle = 9°, two signal averages, inversion prepulse every 814.5 ms acquired over a field of view of 256 (feet–head) × 204 (anterior–posterior) x 160 (right–left) mm, phase encoding in anterior–posterior and right–left direction, reconstructed to voxels of 0.5 × 0.5 × 0.5 mm and the VBM8-toolbox (http://dbm.neuro.uni-jena.de/vbm) was used for pre-processing the structural images with default parameters, as described in our previous work (Dannlowski et al. Reference Dannlowski, Stuhrmann, Beutelmann, Zwanzger, Lenzen, Grotegerd, Domschke, Hohoff, Ohrmann, Bauer, Lindner, Postert, Konrad, Arolt, Heindel, Suslow and Kugel2012; Opel et al. Reference Opel, Redlich, Zwanzger, Grotegerd, Arolt, Heindel, Konrad, Kugel and Dannlowski2014, Reference Opel, Redlich, Grotegerd, Dohm, Heindel, Kugel, Arolt and Dannlowski2015b ; Redlich et al. Reference Redlich, Almeida, Grotegerd, Opel, Kugel, Heindel, Arolt, Phillips and Dannlowski2014).
VBM
Briefly, images were bias-corrected, tissue classified, and normalized to Montreal Neurological Institute (MNI) space using linear (12-parameter affine) and non-linear transformations, within a unified model including high-dimensional DARTEL normalization (http://dbm.neuro.uni-jena.de/vbm). Grey matter segments were modulated only by the non-linear components in order to preserve actual grey matter values locally. Using these procedures, no further correction for total brain volume is required anymore. Segmentation and registration quality was manually checked for each subject's grey matter image. No outliers due to anatomical abnormalities or artifacts could be detected. The modulated grey matter images were smoothed with a Gaussian kernel of 8 mm full width half maximum (FWHM). Absolute threshold masking with a threshold value of 0.1 was used for all second-level analyses as recommended for VBM8 analyses (http://dbm.neuro.uni-jena.de/vbm).
Pattern classification
Individual-level prediction of group membership was assessed by the use of multivariate pattern classification. We employed a support vector machine (libSVM) (Chang & Lin, Reference Chang and Lin2011), a frequently used machine-learning algorithm in neuroimaging, as implemented in the MANIA toolbox (https://bitbucket.org/grotegerd/mania) which has previously been shown to successfully differentiate MDD patients from healthy controls and from patients with bipolar disorder using functional and structural imaging data (Grotegerd et al. Reference Grotegerd, Redlich, Almeida, Riemenschneider, Kugel, Arolt and Dannlowski2014a , Reference Grotegerd, Stuhrmann, Kugel, Schmidt, Redlich, Zwanzger, Rauch, Heindel, Zwitserlood, Arolt, Suslow and Dannlowski b ; Redlich et al. Reference Redlich, Almeida, Grotegerd, Opel, Kugel, Heindel, Arolt, Phillips and Dannlowski2014). Briefly, this algorithm searches for the maximal margin between two classes by calculating a hyperplane which optimally separates the classes. During the training procedure data points are categorized as either support vectors or non-support vectors depending on their distance to the resulting boundary. Once calculated, the trained classifier uses the created boundary to categorize novel data during testing. To investigate potential similarities in brain structure between groups, pattern classification was combined with a feature-selection procedure using univariate VBM analyses as recently described by Mwangi et al. (Reference Mwangi, Ebmeier, Matthews and Steele2012). This approach focuses on the preceding selection of brain areas where significant differences between groups can be found. Subsequent multivariate analyses are thereby restricted to cerebral areas assumed to be of high relevance for the discrimination between groups via pattern classification. Therefore, in the present study, inclusive masks were applied which comprised the entity of voxels found to significantly differ between training samples in the preceding VBM t tests. In order to avoid double dipping, feature selection was only applied on training data. To test for statistical significance, probabilities of binomial distributions were calculated as we and others have conducted previously (Fu et al. Reference Fu, Mourao-Miranda, Costafreda, Khanna, Marquand, Williams and Brammer2008; Redlich et al. Reference Redlich, Almeida, Grotegerd, Opel, Kugel, Heindel, Arolt, Phillips and Dannlowski2014).
Statistical analyses
-
(1) Univariate analyses were calculated using statistical parametric mapping software (SPM8, Welcome Department of Cognitive Neurology, London, UK; http://www.fil.ion.ucl.ac.uk/spm). To investigate differing patterns of grey matter reductions in disease, familial predisposition and environmental risk, we performed a one-way analysis of variance (ANOVA) on whole-brain data with group as the between-subjects factor. Further, post-hoc t tests were conducted for whole-brain data comparing patients and each risk group with HCs: MDD v. HC; FH+ v. HC; CM+ v. HC. The anatomical labelling was performed by means of the AAL-Toolbox (Tzourio-Mazoyer et al. Reference Van Tol, van der Wee, van den Heuvel, Nielen, Demenescu, Aleman, Renken, van Buchem, Zitman and Veltman2002), Brodmann areas were identified with the Talairach Daemon atlas (http://www.talairach.org). In order to control for multiple statistical testing, we maintained a cluster-level corrected false-positive detection rate at p < 0.05 using a voxel-level threshold of p < 0.001 with a cluster extent (k) empirically determined by Monte Carlo simulations (n = 5000 iterations). This was performed by means of the AlphaSim procedure which accounted for spatial correlations between grey matter values in neighbouring voxels, implemented in the REST toolbox (http://restfmri.net/forum/index.php) (Forman et al. Reference Forman, Cohen, Fitzgerald, Eddy, Mintun and Noll1995; Redlich et al. Reference Redlich, Almeida, Grotegerd, Opel, Kugel, Heindel, Arolt, Phillips and Dannlowski2014; Woo et al. Reference Woo, Krishnan and Wager2014; Dannlowski et al. Reference Dannlowski, Grabe, Wittfeld, Klaus, Konrad, Grotegerd, Redlich, Suslow, Opel, Ohrmann, Bauer, Zwanzger, Laeger, Hohoff, Arolt, Heindel, Deppe, Domschke, Hegenscheid, Völzke, Stacey, Meyer Zu Schwabedissen, Kugel and Baune2015; Opel et al. Reference Opel, Redlich, Grotegerd, Dohm, Haupenthal, Heindel, Kugel, Arolt and Dannlowski2015a , Reference Opel, Redlich, Grotegerd, Dohm, Heindel, Kugel, Arolt and Dannlowski b ). The cluster threshold calculation was based on a residual smoothness value of 14 mm FWHM as estimated by using SPM8. The empirically determined cluster threshold was k = 458 voxels. Finally, to test for directly overlapping structural alterations of patients v. controls and each risk group v. controls, conjunction analyses were performed between the resulting β weight maps of the t-contrasts applying identical thresholds of p < 0.001 and k = 458 voxels.
-
(2) (a) First, to evidence the successful utilization of pattern recognition in the differentiation of high-risk subjects from non-risk controls, classifiers were trained with grey matter images of all 16 FH+ subjects and 16 randomly selected HC subjects (due to the required equal sample size for training data) as well as with grey matter images of all 20 CM+ and 20 HC subjects. Classification accuracy was then assessed for both classifiers via leave-one-out-per-group-cross-validation.
(b) Second, to investigate the relevance of shared neurostructural properties in disease and its risk factors at an individual level, we tested whether healthy subjects at risk for the disease could also be classified by directly focusing on morphological traits of MDD. Therefore, a classifier was trained with the grey matter images of all MDD and HC subjects. To strictly focus on morphological characteristics of MDD, an inclusive mask was applied comprising the entity of significant voxels of the MDD v. HC VBM t test of step 1. We hypothesized that the classifier trained to differentiate MDD from HC would also detect morphological traits of MDD in risk groups by assessing individual prediction of group membership (MDD/HC) for all FH+ and CM+ subjects using their structural images as test data. Additionally, to evaluate the impact of the preceding feature selection procedure, a classifier was trained on the MDD and HC sample and subsequently tested on the FH+ and CM+ sample using whole-brain grey matter images without any masking applied.
Vice versa, we tested whether MDD patients could successfully be categorized by separately focusing on imaging correlates of familial and environmental risk. First, a classifier was trained with structural images of all FH+ and 16 randomly selected HC subjects and subsequently tested with structural images of all MDD patients. Again, a mask of the preceding univariate analysis was applied (FH+ v. HC). Second, a classifier was trained with images of all CM+ and HC subjects and subsequently tested with structural images of all MDD patients using a mask of all significant voxels of the CM+ v. HC VBM t test of step 1. Following the conventional terminology in pattern classification studies, accuracy was defined as the sum of sensitivity and specificity divided by two (accuracy = sensitivity + specificity/2).
Ethical standards
All procedures contributing to this work comply with the ethical standards of the relevant national and institutional committees on human experimentation and with the Helsinki Declaration of 1975, as revised in 2008.
Results
-
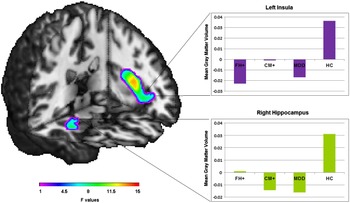
(1) A significant main effect of group occurred in the bilateral insula (left: x = −40, y = 5, z = 12, F 3,72 = 15.26, k = 2059; right: x = 26, y = 24, z = 3, F 3,72 = 9.47, k = 481), the hippocampus (x = 34, y = −4, z = −23, F 3,72 = 11.05, k = 539), the Rolandic operculum (x = 45, y = −13, z = 16, F 3,72 = 11.41, k = 803) and the lingual gyrus (x = 14, y = −60, z = 2, F 3,72 = 9.90, k = 837) (see Fig. 1).
Fig. 1.Left: view (Montreal Neurological Institute coordinates: −35x, −15z) depicting results of the analysis of variance showing a main effect of ‘group’ in the left insula and in the right hippocampus. Colour bar: F value (degrees of freedom = 3, 72). Right: bar graphs depicting the mean grey matter values for the healthy control (HC), major depressive disorder (MDD), healthy subjects exposed to childhood maltreatment (CM+) and healthy relatives of MDD patients (FH+) groups adjusted for the main effect of ‘group’ (mean corrected) in the left insula (top) and the right hippocampus (bottom).

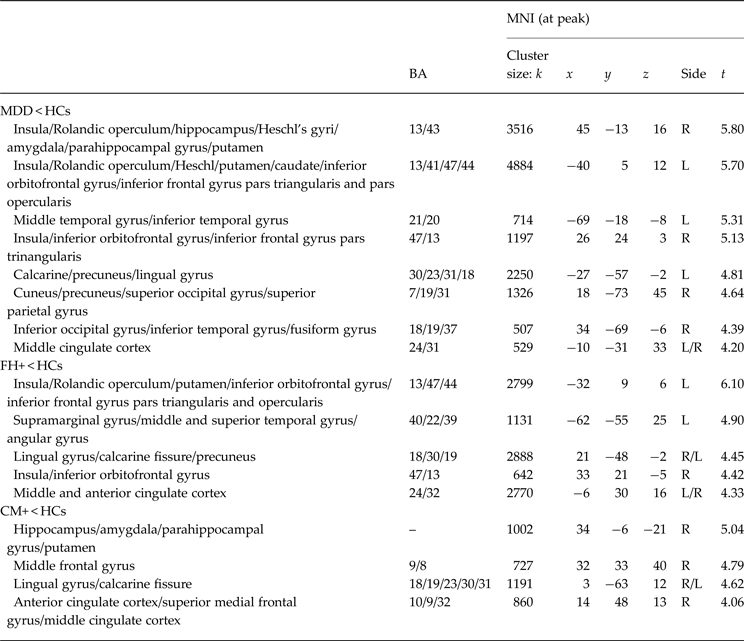
Post-hoc two-sample t tests confirmed our hypothesis of differing effects of disease, genetic predisposition and environmental stress in early life on grey matter structure. We found significantly decreased grey matter volumes in MDD compared with HC subjects in a cluster comprising parts of the right hippocampus, the adjacent parahippocampal gyrus, the insula and the amygdala (x = 45, y = −13, z = 16, t 1,72 = 5.80, k = 3516) as well as in the bilateral insula extending to the orbitofrontal gyrus (left: x = −40, y = 5, z = 12, t 1,72 = 5.70, k = 4884; right: x = 26, y = 24, z = 3, t 1,72 = 5.13, k = 1197), in the cingulate cortex (x = −10, y = −31, z = 33, t 1,72 = 4.20, k = 529) and in several parietal and occipital brain areas including the precuneus and the cuneus (for details, see Table 2).
Table 2.Group comparisons between MDD patients, FH+ subjects, CM+ subjects and HCs as measured with t tests a
MDD, Major depressive disorder; FH+, healthy first-degree relatives of MDD patients; CM+, healthy subjects exposed to former childhood maltreatment; HCs, healthy controls; MNI, Montreal Neurological Institute; BA, Brodmann area; R, right; L, left.
a All reported whole-brain analyses with voxel threshold p < 0.001, minimum cluster volume threshold k ⩾ 458. Coordinates based on the MNI atlas.
In subjects with a history of childhood maltreatment significant clusters of reduced grey matter appeared in the right hippocampus extending to the parahippocampal gyrus and the amygdala (x = 34, y = −6, z = −21, t 1,72 = 5.04, k = 1002), in the medial frontal gyrus (x = 32, y = 33, z = 40, t 1,72 = 4.79, k = 727) and in the anterior cingulate cortex (x = 14, y = 48, z = 13, t 1,72 = 4.06, k = 850) compared with HCs, whereas healthy first-degree relatives of MDD patients showed significant grey matter reductions in the bilateral insula extending to the orbitofrontal gyrus (left: x = −32, y = 9, z = 6, t 1,72 = 6.10, k = 2799; right: x = 33, y = 21, z = 5, t 1,72 = 4.42, k = 642) and in the middle cingulate cortex (x = −6, y = 30, z = 16, t 1,72 = 4.33, k = 2770) compared with HCs (see Fig. 2). No significant differences in hippocampal grey matter could be found between FH+ and HC subjects using the applied statistical thresholds. No significant increase in grey matter could be found in MDD and CM+ subjects compared with HCs. In FH+ subjects increased grey matter volume was found in one cerebellar cluster compared with HC subjects (x = −9, y = −66, z = −35, t 1,72 = 4.93, k = 2316).
Fig. 2.Coronal and sagittal slices [Montreal Neurological Institute (MNI) coordinates: 7x, 29x, 37x/−14y, −6y, 14y] depicting results of the healthy relatives of major depressive disorder patients (FH+) < healthy controls (HC) and the healthy childhood maltreated subjects (CM+) < HC contrasts as measured with post-hoc t tests. Colour bar: t value.
Moreover, no significant differences in grey matter volume could be found between CM+ and MDD subjects, whereas FH+ subjects revealed increased grey matter volume compared with MDD subjects in two cerebellar clusters and in the bilateral thalamus (x = −9, y = −18, z = 13, t 1,72 = 4.49, k = 1909; x = 15, y = −61, z = −56, t 1,72 = 4.27, k = 2583; x = −8, y = −72, z = −36, t 1,72 = 4.00, k = 697).
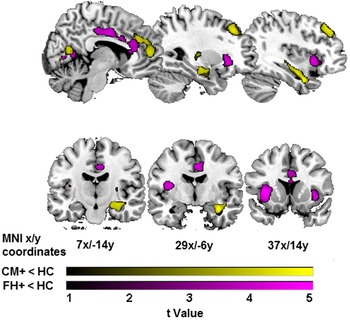
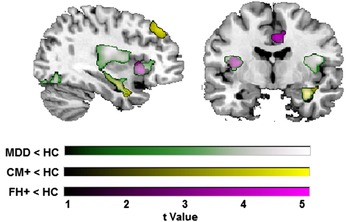
Conjunction analyses yielded a direct overlap of grey matter reductions between the MDD < HC and FH+ < HC contrasts in the bilateral insula and the orbitofrontal gyrus (left: x = −40, y = 5, z = 12, t 1,72 = 5.70, k = 2150; right: x = 32, y = 22, z = −3, t 1,72 = 4.40, k = 593), as well as in the left precuneus extending to the calcarine fissure (x = −22, y = −51, z = −2, t 1,72 = 4.12, k = 511) and between the MDD < HC and the CM+ < HC contrasts in the right hippocampus (x = 34, y = −6, z = −21, t 1,72 = 4.89, k = 735) (see Fig. 3).
Fig. 3.Coronal and sagittal slices (Montreal Neurological Institute coordinates: 37x/−14y) depicting overlapping grey matter reductions in the insula in major depressive disorder (MDD) patients and healthy relatives of major depressive disorder patients (FH+) and in the hippocampus in MDD patients and healthy childhood maltreated subjects (CM+) as measured with post-hoc t tests. Colour bar: t value.
No direct overlap in grey matter reductions could be detected between FH+ < HC and CM+ < HC contrasts. In the MDD sample, no significant association between medication load and grey matter volume could be detected in whole-brain as well as in region of interest analyses of the resulting clusters of the MDD < HC contrast using an ANOVA with medication load as the between-subjects factor. Even when applying a more lenient exploratory cluster-level threshold of k > 200 voxels, no associations between medication load and grey matter volumes occurred. Moreover, no significant differences in total grey matter, total white matter and total cerebrospinal fluid-volumes (as measured using the vbm8 toolbox) could be detected between groups (all p's > 0.532).
-
(2)
-
(a) We found that FH+ subjects could be distinguished from HC subjects with a significant accuracy rate of 84.38% (sensitivity: 81.25%, specificity: 87.5%, p < 0.001) by using whole-brain grey matter data as classifier input, whereas CM+ subjects were correctly distinguished from HCs with a significant accuracy of 62.50% (sensitivity: 65%, specificity: 60%, p = 0.040).
-
(b) The trained MDD/HC classifier was found to classify healthy subjects at familial risk for depression as MDD patients in 75% of FH+ subjects (12/16, p = 0.011) but only in 60% of CM+ subjects (12/20, p = 0.132) by directly focusing on brain regions found to be associated with MDD in the preceding VBM analyses (feature selection). By using whole-brain grey matter images as classifier input, 62.5% (10/16, p = 0.105) of FH+ subjects and 55% (11/20, p = 0.252) of CM+ subjects were classified as MDD patients.
Vice versa, both the trained FH+/HC classifier and the trained CM+/HC classifier equally categorized 65% (13/20, p = 0.058) of MDD patients as FH+ and CM+ subjects, respectively, using univariate feature selection.
-


Discussion
To the best of our knowledge this is the first study which directly compared differing imaging correlates of familial and environmental risk for MDD. Furthermore, this is the first study investigating imaging traits of depression risk by using pattern recognition.
In line with our hypothesis we found familial predisposition and early-life adversity in healthy subjects to be associated with different brain structural alterations and no direct overlap between imaging correlates of both risk factors. The successful detection of healthy subjects at risk for the disease by using pattern classification in this study further contributes to building the basis for possible future clinical applications of neuroimaging vulnerability markers for MDD. Moreover, the fact that high-risk subjects could be detected by strictly focusing on morphological traits of MDD during pattern classification might point to the relevance of shared brain structural characteristics in the development of MDD. Intriguingly, in this analysis step the performance of whole-brain classifiers was inferior compared with classifiers exclusively focusing on structural alterations found to be associated with MDD in the preceding univariate VBM analysis (feature selection). We thus conclude that the applied feature selection procedure successfully eliminated voxels without valuable information for the detection of high-risk groups which emphasizes the relevance of shared morphometric anomalies in patients and risk groups.
This notion of a common neurostructural correlate of depression risk and acute depressive disorder highly matches results from previous univariate analyses (Amico et al. Reference Amico, Meisenzahl, Koutsouleris, Reiser, Möller and Frodl2011; Cole et al. Reference Cole, Costafreda, McGuffin and Fu2011; Dannlowski et al. Reference Dannlowski, Stuhrmann, Beutelmann, Zwanzger, Lenzen, Grotegerd, Domschke, Hohoff, Ohrmann, Bauer, Lindner, Postert, Konrad, Arolt, Heindel, Suslow and Kugel2012; Teicher & Samson, Reference Teicher and Samson2013; Liu et al. Reference Liu, Jing, Ma, Xu, Zhang, Li, Wang, Tang, Wang, Li and Wang2014; Pannekoek et al. Reference Pannekoek, van der Werff, van den Bulk, van Lang, Rombouts, van Buchem, Vermeiren and van der Wee2014).
The fact that detection rates were lower for CM+ subjects might be explained by an overall smaller overlap in structural aberrations between CM+ and MDD subjects, possibly reflecting a less specific impact of childhood maltreatment as a risk factor not only for MDD but also for other psychiatric disorders, such as post-traumatic stress disorder and anxiety disorders.
Most importantly, as we could not detect any direct overlap in grey matter reductions between familial risk and childhood adversity, we assume that both conditions are characterized by disparate brain structural correlates which might point to differences in underlying neurobiological pathways, albeit the statistical power of our samples might have been limited to draw firm conclusions.
In this study, familial risk for MDD was associated with significantly reduced grey matter volume predominantly in the bilateral insula, the orbitofrontal cortex and the cingulate cortex. This finding is supported by previous imaging studies, e.g. by Drevets et al. referring to insular and cingulate changes as a pre-existing trait of depressive disorder (Drevets et al. Reference Drevets, Price, Simpson, Todd, Reich, Vannier and Raichle1997; Price & Drevets, Reference Price and Drevets2010; Young et al. Reference Young, Bellgowan, Bodurka and Drevets2013; Liu et al. Reference Liu, Jing, Ma, Xu, Zhang, Li, Wang, Tang, Wang, Li and Wang2014; Pannekoek et al. Reference Pannekoek, van der Werff, van den Bulk, van Lang, Rombouts, van Buchem, Vermeiren and van der Wee2014).
Interestingly, we also found directly overlapping grey matter reductions in acutely depressed patients and subjects at familial risk for the disease in the insula, the orbitofrontal cortex and the precuneus. Alterations in these areas have been frequently reported in neuroimaging studies on MDD including meta-analysis (Arnone et al. Reference Arnone, McIntosh, Ebmeier, Munafò and Anderson2012; Liu et al. Reference Liu, Jing, Ma, Xu, Zhang, Li, Wang, Tang, Wang, Li and Wang2014; Stratmann et al. Reference Stratmann, Konrad, Kugel, Krug, Schöning, Ohrmann, Uhlmann, Postert, Suslow, Heindel, Arolt, Kircher and Dannlowski2014; Wang et al. Reference Wang, Du, Chen, Chen, Huang, Luo, Zhao, Kumar and Gong2014). Given the crucial role of these cerebral structures in interoception and subjective emotional experience, our results might point to abnormalities in these fields of neural processing as an important feature of heritable vulnerability to the disease (Simmons et al. Reference Simmons, Avery, Barcalow, Bodurka, Drevets and Bellgowan2013; Terasawa et al. Reference Terasawa, Fukushima and Umeda2013; Avery et al. Reference Avery, Drevets, Moseman, Bodurka, Barcalow and Simmons2014).
A surprising finding of the present study was that FH+ subjects exhibited greater cerebellar grey matter volume compared with MDD and HC subjects, which matches results from a previous imaging study on healthy relatives of bipolar patients (Kempton et al. Reference Kempton, Haldane, Jogia, Grasby, Collier and Frangou2009). In the mentioned study, it has been proposed that increased cerebellar volume might be associated with resilience to the development of affective disorders via improved affective regulation (Kempton et al. Reference Kempton, Haldane, Jogia, Grasby, Collier and Frangou2009). Hence, it might be possible that these cerebellar changes reflect increased resilience to the development of affective disorders as another potential characteristic of healthy high-risk subjects, even if this notion remains highly speculative due to lacking consistency in the present literature.
In sum, considering that brain structural alterations associated with acute MDD and familial risk alike were found to agglomerate on brain structures thought to be of high specificity for the development of major depression in this study and given the absence of early-life trauma as a detrimental environmental influence factor for brain development in our FH+ sample, the shared morphometric anomalies observed in MDD and FH+ subjects might preferably be interpreted as pre-existent inherited traits for increased risk for the development of the disease (Drevets et al. Reference Drevets, Price, Simpson, Todd, Reich, Vannier and Raichle1997; Price & Drevets, Reference Price and Drevets2010; Young et al. Reference Young, Bellgowan, Bodurka and Drevets2013; Liu et al. Reference Liu, Jing, Ma, Xu, Zhang, Li, Wang, Tang, Wang, Li and Wang2014; Pannekoek et al. Reference Pannekoek, van der Werff, van den Bulk, van Lang, Rombouts, van Buchem, Vermeiren and van der Wee2014).
As another considerable point, this study confirms decreased hippocampal grey matter as a brain structural characteristic of former maltreatment experiences in healthy subjects which is well in line with evidence from a variety of neuroimaging studies on childhood trauma (Rao et al. Reference Rao, Chen, Bidesi, Shad, Thomas and Hammen2010; Dannlowski et al. Reference Dannlowski, Stuhrmann, Beutelmann, Zwanzger, Lenzen, Grotegerd, Domschke, Hohoff, Ohrmann, Bauer, Lindner, Postert, Konrad, Arolt, Heindel, Suslow and Kugel2012; Teicher et al. Reference Teicher, Anderson and Polcari2012; Chaney et al. Reference Chaney, Carballedo, Amico, Fagan, Skokauskas, Meaney and Frodl2014; Opel et al. Reference Opel, Redlich, Zwanzger, Grotegerd, Arolt, Heindel, Konrad, Kugel and Dannlowski2014). Results from the above-mentioned studies also indicated that hippocampal atrophy might be a shared feature apparent in both MDD patients and healthy but maltreated subjects, which matches results of our conjunction analysis yielding a direct overlap of decreased grey matter in patients and healthy subjects exposed to early-life trauma.
Chronic stress, whether induced by traumatic experiences in early life or by chronic disease, is thought to interfere with physiological neurodevelopment in the hippocampus via increased levels of glucocorticoids and thus might represent a reasonable biological model for decreased hippocampal volumes in both healthy maltreated subjects and MDD patients (Heim et al. Reference Heim, Newport, Mletzko, Miller and Nemeroff2008; Wang et al. Reference Wang, Huang and Hsu2010; Frodl & O'Keane, Reference Frodl and O'Keane2013). Furthermore, the structural overlap in hippocampal volumes between patient samples and healthy maltreated subjects might at least partly be attributed to the elevated prevalence of maltreatment experiences in MDD populations (Scott et al. Reference Scott, McLaughlin, Smith and Ellis2012; Opel et al. Reference Opel, Redlich, Zwanzger, Grotegerd, Arolt, Heindel, Konrad, Kugel and Dannlowski2014).
Finally, this study is the first to indicate that pattern recognition can indeed successfully be utilized in the detection of MDD risk factors at an individual level. Even if the reported accuracy rates may be slightly below findings from studies focusing on neural differences between patients and healthy controls, it appears striking that healthy subjects with a familial predisposition but without presence of depressive symptoms or a history of psychiatric disorder can successfully be detected with a significant accuracy rate of 84.38% by using whole-brain data without any masking applied.
Considering that the individual detection of distinct cerebral anomalies associated with increased risk for the onset and for the development of more severe forms of MDD seems to be possible long before the first appearance of depressive symptoms, the use of pattern classification could provide a substantial benefit in the prevention of affective disorders. Regarding the strong prediction accuracies achieved in this study one might also suspect that successful individual prediction of illness risk could expand to other risk domains or could be possible in subjects with a more subtle risk profile. Moreover, since the investigated risk factors are strongly associated with poorer treatment outcome and more chronic forms of the disease, this study points to the possibility of outcome prediction as a future clinical application of pattern classification (Birmaher et al. Reference Birmaher, Arbelaez and Brent2002; Husain et al. Reference Husain, Rush, Wisniewski, McClintock, Fava, Nierenberg, Davis, Balasubramani, Young, Albala and Trivedi2009; Teicher & Samson, Reference Teicher and Samson2013). Patients presenting with a first depressive episode might thus be assigned to high-risk subgroups and could subsequently benefit from more specific interventions in early therapeutic stages.
Strengths of our study include the combination of univariate and multivariate neuroimaging techniques and the careful assessment of inclusion criteria: FH+ subjects were only included if the clinical diagnosis of their depressed relative could be directly confirmed via SCID interview which guarantees higher reliability of information on familial predisposition compared with the simple assessment of family anamnesis.
Limitations include the modest sample size. Due to the above-described, elaborate inclusion criteria, the number of subjects in the FH+ sample is at the bottom of tolerable sample sizes in neuroimaging. Furthermore, we did not differentiate between differing risk status in our MDD patient sample. Due to the unbalanced and restricted subsamples sizes, we did not investigate possible morphometric differences between patients with familial or environmental risk factors (patients with/without positive family history for affective disorders: n = 17/3; patients exposed/non-exposed to former childhood abuse n = 15/5) and patients without any of these risk factors, although this is a primordial issue that future studies should address. Most of our patients received antidepressant medication which could have limited the validity of our results. However, antidepressant potency was not significantly associated with grey matter volumes in our MDD sample, indicating that medication intake might not have exercised a decisive influence in the present study. Furthermore, since our study did not include remitted patients, we cannot refer to possible differences in brain morphological traits between acutely depressed patients, remitted patients and healthy high-risk subjects. Again, this is an important research target that might be addressed by neuroimaging in future.
To conclude, this study revealed differing brain structural imaging correlates of familial and environmental risk for MDD. Both conditions seem to be associated with specific alterations in diverging brain areas which could be hypothesized to reflect differences in the underlying pathophysiological processes leading to the onset of disease. Regarding the elevated prevalence of childhood trauma in subjects from families with a liability for affective disorders, the undiscovered simultaneous occurrence of familial predisposition and environmental risk might represent a decisive confounding element in recent neuroimaging studies on affective disorders. Further, we conclude that pattern recognition might be a promising approach to identify high-risk subjects in the prevention of affective disorders. Future studies should aim to further confine the possible utilization of pattern recognition by directly focusing on different risk-specific neural circuits in high-risk samples in combination with the clinical assessment of depressive symptoms during longitudinal follow-up.
Acknowledgements
The study was supported by grants of the German Research Foundation (DFG; grant FOR 2107; DA1151/5-1 to U.D.), Innovative Medizinische Forschung (IMF) of the Medical Faculty of Münster (DA120309 to U.D., DA111107 to U.D., and DA211012 to U.D.) and Rolf-Dierichs-Stiftung (ZUW80037 to U.D.).
Declaration of Interest
V.A. is a member of advisory boards and/or gave presentations for the following companies: Astra-Zeneca, Eli Lilly, Janssen-Organon, Lundbeck, Otsuka, Servier and Trommsdorff. P.Z. has received speaker fees from Pfizer, Servier, Lilly, Astra Zeneca and Bristol Myers Squibb, he is on the advisory board of Pfizer, is a consultant for Ironwood Pharmaceuticals and has received funding from AstraZeneca. These affiliations have no relevance to the work covered in the paper. All other authors have no conflicts of interest to declare, financial or otherwise.