


%20--%3e%3c!DOCTYPE%20svg%20PUBLIC%20'-//W3C//DTD%20SVG%201.0//EN'%20'http://www.w3.org/TR/2001/REC-SVG-20010904/DTD/svg10.dtd'%3e%3csvg%20version='1.0'%20id='Layer_1'%20xmlns='http://www.w3.org/2000/svg'%20xmlns:xlink='http://www.w3.org/1999/xlink'%20x='0px'%20y='0px'%20width='64px'%20height='64px'%20viewBox='5.5%20-3.5%2064%2064'%20enable-background='new%205.5%20-3.5%2064%2064'%20xml:space='preserve'%3e%3cg%3e%3ccircle%20fill='%23FFFFFF'%20fill-opacity='0'%20cx='37.785'%20cy='28.501'%20r='28.836'/%3e%3cpath%20fill='%23595959'%20d='M37.441-3.5c8.951,0,16.572,3.125,22.857,9.372c3.008,3.009,5.295,6.448,6.857,10.314%20c1.561,3.867,2.344,7.971,2.344,12.314c0,4.381-0.773,8.486-2.314,12.313c-1.543,3.828-3.82,7.21-6.828,10.143%20c-3.123,3.085-6.666,5.448-10.629,7.086c-3.961,1.638-8.057,2.457-12.285,2.457s-8.276-0.808-12.143-2.429%20c-3.866-1.618-7.333-3.961-10.4-7.027c-3.067-3.066-5.4-6.524-7-10.372S5.5,32.767,5.5,28.5c0-4.229,0.809-8.295,2.428-12.2%20c1.619-3.905,3.972-7.4,7.057-10.486C21.08-0.394,28.565-3.5,37.441-3.5z%20M37.557,2.272c-7.314,0-13.467,2.553-18.458,7.657%20c-2.515,2.553-4.448,5.419-5.8,8.6c-1.354,3.181-2.029,6.505-2.029,9.972c0,3.429,0.675,6.734,2.029,9.913%20c1.353,3.183,3.285,6.021,5.8,8.516c2.514,2.496,5.351,4.399,8.515,5.715c3.161,1.314,6.476,1.971,9.943,1.971%20c3.428,0,6.75-0.665,9.973-1.999c3.219-1.335,6.121-3.257,8.713-5.771c4.99-4.876,7.484-10.99,7.484-18.344%20c0-3.543-0.648-6.895-1.943-10.057c-1.293-3.162-3.18-5.98-5.654-8.458C50.984,4.844,44.795,2.272,37.557,2.272z%20M37.156,23.187%20l-4.287,2.229c-0.458-0.951-1.019-1.619-1.685-2c-0.667-0.38-1.286-0.571-1.858-0.571c-2.856,0-4.286,1.885-4.286,5.657%20c0,1.714,0.362,3.084,1.085,4.113c0.724,1.029,1.791,1.544,3.201,1.544c1.867,0,3.181-0.915,3.944-2.743l3.942,2%20c-0.838,1.563-2,2.791-3.486,3.686c-1.484,0.896-3.123,1.343-4.914,1.343c-2.857,0-5.163-0.875-6.915-2.629%20c-1.752-1.752-2.628-4.19-2.628-7.313c0-3.048,0.886-5.466,2.657-7.257c1.771-1.79,4.009-2.686,6.715-2.686%20C32.604,18.558,35.441,20.101,37.156,23.187z%20M55.613,23.187l-4.229,2.229c-0.457-0.951-1.02-1.619-1.686-2%20c-0.668-0.38-1.307-0.571-1.914-0.571c-2.857,0-4.287,1.885-4.287,5.657c0,1.714,0.363,3.084,1.086,4.113%20c0.723,1.029,1.789,1.544,3.201,1.544c1.865,0,3.18-0.915,3.941-2.743l4,2c-0.875,1.563-2.057,2.791-3.541,3.686%20c-1.486,0.896-3.105,1.343-4.857,1.343c-2.896,0-5.209-0.875-6.941-2.629c-1.736-1.752-2.602-4.19-2.602-7.313%20c0-3.048,0.885-5.466,2.658-7.257c1.77-1.79,4.008-2.686,6.713-2.686C51.117,18.558,53.938,20.101,55.613,23.187z'/%3e%3c/g%3e%3c/svg%3e)
%20--%3e%3c!DOCTYPE%20svg%20PUBLIC%20'-//W3C//DTD%20SVG%201.0//EN'%20'http://www.w3.org/TR/2001/REC-SVG-20010904/DTD/svg10.dtd'%3e%3csvg%20version='1.0'%20id='Layer_1'%20xmlns='http://www.w3.org/2000/svg'%20xmlns:xlink='http://www.w3.org/1999/xlink'%20x='0px'%20y='0px'%20width='64px'%20height='64px'%20viewBox='5.5%20-3.5%2064%2064'%20enable-background='new%205.5%20-3.5%2064%2064'%20xml:space='preserve'%3e%3cg%3e%3ccircle%20fill='%23FFFFFF'%20fill-opacity='0'%20cx='37.637'%20cy='28.806'%20r='28.276'/%3e%3cg%3e%3cpath%20fill='%23595959'%20d='M37.443-3.5c8.988,0,16.57,3.085,22.742,9.257C66.393,11.967,69.5,19.548,69.5,28.5c0,8.991-3.049,16.476-9.145,22.456%20C53.879,57.319,46.242,60.5,37.443,60.5c-8.649,0-16.153-3.144-22.514-9.43C8.644,44.784,5.5,37.262,5.5,28.5%20c0-8.761,3.144-16.342,9.429-22.742C21.101-0.415,28.604-3.5,37.443-3.5z%20M37.557,2.272c-7.276,0-13.428,2.553-18.457,7.657%20c-5.22,5.334-7.829,11.525-7.829,18.572c0,7.086,2.59,13.22,7.77,18.398c5.181,5.182,11.352,7.771,18.514,7.771%20c7.123,0,13.334-2.607,18.629-7.828c5.029-4.838,7.543-10.952,7.543-18.343c0-7.276-2.553-13.465-7.656-18.571%20C50.967,4.824,44.795,2.272,37.557,2.272z%20M46.129,20.557v13.085h-3.656v15.542h-9.944V33.643h-3.656V20.557%20c0-0.572,0.2-1.057,0.599-1.457c0.401-0.399,0.887-0.6,1.457-0.6h13.144c0.533,0,1.01,0.2,1.428,0.6%20C45.918,19.5,46.129,19.986,46.129,20.557z%20M33.042,12.329c0-3.008,1.485-4.514,4.458-4.514s4.457,1.504,4.457,4.514%20c0,2.971-1.486,4.457-4.457,4.457S33.042,15.3,33.042,12.329z'/%3e%3c/g%3e%3c/g%3e%3c/svg%3e)
Taking seriously the notion that ‘one of the greatest threats to democracy is the idea that it is unassailable’ (Carey et al. Reference Carey2019), scholars have responded to contemporary challenges to democratic principles and practices by revisiting a foundational question of modern political science (Easton, Gunnell and Stein Reference Easton, Gunnell and Stein1995): what are the prerequisites for a stable and healthy liberal democracy, and to what extent are these conditions currently met? As any democratic system requires a sufficiently large number of citizens who want to govern themselves (Almond and Verba Reference Almond and Verba1963; Claassen Reference Claassen2019), one strand of the literature focuses on citizen attitudes. Examining ‘democracy's fading allure’ (Plattner Reference Plattner2015), scholars in this line of research investigate whether Western citizens are still supportive of the democratic system they live in (Mattes Reference Mattes2018). Given the rise of populist and authoritarian leaders, scholars fear that ideas might have taken root that are incompatible with core democratic components (Canovan Reference Canovan1999; Caramani Reference Caramani2017). More and more citizens might consider democracy as merely one of several viable options rather than the only legitimate form of government, thereby challenging democracy's role as ‘the only game in town’ (Linz and Stepan Reference Linz and Stepan1996, 15). Against this backdrop, several scholars (Denemark, Donovan and Niemi Reference Denemark, Donovan, Niemi, Denemark, Mattes and Niemi2016a; Foa and Mounk Reference Foa and Mounk2017a; Mounk Reference Mounk2018; Wike and Fetterolf Reference Wike and Fetterolf2018) claim to have identified a turning point in the historical development of democracy: as consolidated democracies can no longer rely on the unshaken support of their citizens, it once again seems conceivable that long-established democracies could regress into some kind of nondemocratic regime.
Most prominently, Foa and Mounk (Reference Foa and Mounk2016, Reference Foa and Mounk2017a, Reference Foa and Mounk2017b) argued that citizens of consolidated democracies – in particular, the youngest generations – are turning their back on liberal democracy. The democratic deconsolidation hypothesis has sparked a ferocious debate. Critics have challenged the hypothesis' validity on theoretical and empirical grounds, objecting that the arguments and evidence were unconvincing and cherry picked. According to critics, when considered in its entirety the data did not indicate an erosion of support for democracy (Alexander and Welzel Reference Alexander and Welzel2017; Inglehart Reference Inglehart2016; Kirsch and Welzel Reference Kirsch and Welzel2019; Norris Reference Norris2017; Voeten Reference Voeten2017; Zilinsky Reference Zilinsky2019). This state of affairs leaves those interested in reliable answers about whether democracy's attitudinal foundations are eroding with considerable uncertainty about what political science can tell about this important question of contemporary politics.
In an attempt to provide timely and unbiased evidence about the dynamics of democratic support in Western democracies, this study makes three contributions to help overcome shortcomings in the ongoing scholarly debate. First, it is the first study in this literature to make serious attempts to disentangle period, life-cycle and cohort effects, thereby examining the proposed generation-based arguments using adequate analytical methods. Secondly, this study relies on a recently published dataset, thereby responding to calls to enhance the slim body of longitudinal evidence on the development of democratic support. Finally, by following a pre-registered protocol and reporting the study's entire evidence in an interactive companion website, we attempt to ensure that the reported findings are neither selectively reported nor polished in one direction or the other.
In a nutshell, our analysis of survey data from eighteen European democracies suggests that attitudes toward democracy remain stable and at a high level when queried as a generic term. However, in some countries there is evidence of growing susceptibility to regime types that are incompatible with established notions of liberal democracy, particularly among the young generation. In the concluding section, we discuss how these seemingly contradictory findings can be reconciled.
How Trends in Democratic Support Come About
Proponents of the democratic deconsolidation hypothesis allude to contemporary economic and socio-cultural transformations as origins of the alleged growing disenchantment with democracy in Western societies. These propositions suggest the young generation is the vanguard of democratic decline (Denemark, Donovan and Niemi Reference Denemark, Donovan, Niemi, Denemark, Mattes and Niemi2016a; Foa and Mounk Reference Foa and Mounk2016; Foa and Mounk Reference Foa and Mounk2017a). Recent birth cohorts are seen to be the most susceptible to growing democratic disaffection because they have been hit the hardest by recent economic crises in several European countries, which may have undermined their confidence in the prevailing political system (Mounk Reference Mounk2018). Given their socialization experiences in the age of individualization and digitalization, the natural properties of democracy's decision-making processes might be at odds with the preferences of today's young generation. Whereas recent birth cohorts have grown accustomed to highly individualized consumer products and a fast-reacting media environment, democracy's institutions are slow by design and do not necessarily respond to individual preferences; they instead prescribe collectively binding decisions (Gurri Reference Gurri2018; Streeck Reference Streeck2016). As a consequence, today's young generation may become more disenchanted with democratic politics and potentially more open to alternative forms of governing.
However, the expectation of growing democratic fatigue, especially among the young, contradicts modernization theory, which posits that democracy's attitudinal foundations will grow stronger from one generation to the next (Alexander and Welzel Reference Alexander and Welzel2017; Kirsch and Welzel Reference Kirsch and Welzel2019; Norris Reference Norris2017; Norris and Inglehart Reference Norris and Inglehart2019). According to modernization scholars, in the wake of a universal value change, assertive orientations that are more prevalent among older cohorts shift toward self-expressive, emancipative orientations that are more prevalent among younger generations who grew up in secure material environments. As a result, the young generation may be more critical of political authorities and institutions but more steadfast in their support for the principles of self-governance.
Note that, in these discussions, scholars occasionally refer to the ‘young generation’ without clearly defining generational boundaries or work with differing sets of cohort operationalizations (for example, Foa and Mounk Reference Foa and Mounk2017a, 6; Foa and Mounk Reference Foa and Mounk2017b; 10; Norris and Inglehart Reference Norris and Inglehart2019, 36). This vagueness partly reflects the fact that various macro-level mechanisms are at play. Influences such as the 2008 economic crisis hit a well-defined cohort of individuals during their formative phase, but other influences such as the ‘fifth wave’ of information technology (Gurri Reference Gurri2018) characterize the formative years of a larger and less clearly defined cohort. While democracy-undermining influences may be more forceful the later a person was born, there is no clear criterion to delineate younger from older birth cohorts. Nonetheless, we can conclude that skeptics and advocates of the democratic deconsolidation hypothesis disagree about the differences in democratic support between older and younger birth cohorts and, by implication and more fundamentally, about the prospects that generational replacement holds for mass support for the democratic system of governing.
Less controversial than the presence of generational disparities is the claim that democracy is facing challenges that may shake confidence in the democratic polity, regardless of generational affiliation. Hence, another conceivable pathway of eroding support for democracy is that the recent economic and political crises and other processes, such as the diminishing steering capacities of nationalized democracies, may have undermined democratic support in the form of period effects – that is, uniform decreases from one point in time to the next irrespective of an individual's position in the life cycle and generational affiliation (Mounk Reference Mounk2018; Streeck Reference Streeck2016). What remains disputed, however, is whether these period effects merely affect short-term political orientations such as party preferences or whether they have begun to erode foundational attitudes toward democracy such as support for the principles of self-governing. This dispute is partly because the basic empirical facts on crucial aspects of Western societies are contested. This uncertainty reflects various shortcomings in the literature.
Strengthening the Reliability and Validity of Findings in a Contested Field of Research
The topic's longitudinal nature calls for survey questions that were asked repeatedly over a relatively long period of time. Yet, time-series data on democracy-related questions are scarce. Hence, it remains unclear whether the findings presented by prior research indicate short-term fluctuations or long-term trends (van der Meer Reference van der Meer2017). Responding to calls from all sides of the debate for more comprehensive survey data, this study uses recently published cross-national data that allow us to properly identify how democratic support has developed over time and across generations (Foa and Mounk Reference Foa and Mounk2016, 10; Foa and Mounk Reference Foa and Mounk2017a, 10; Voeten Reference Voeten2017, 1).
Although most time series do not cover long time periods, the respective surveys often contain multiple instruments to assess individual-level political support (Mattes Reference Mattes2018). While a large number of indicators reflects the complex nature of democracy, it also hinders the comparability of studies, thereby contributing to the ambiguity of existing research. Moreover, considering the vast array of analytical options, each with possibly different outcomes, it is no wonder that authors frequently suspect that some findings in the scholarly controversy were reported selectively in a way that fits the authors' claim (Alexander and Welzel Reference Alexander and Welzel2017; Norris Reference Norris2017, 5; Voeten Reference Voeten2017, 1).
In this study, we respond to the challenges for knowledge accumulation that result from researchers' ample degrees of freedom in a contested field of social inquiry in the following way. Before obtaining the data, we documented our analytical strategy and all indicators we considered relevant for assessing democratic support in a public pre-analysis plan.Footnote 1 What is more, although limitations of space prohibit reporting the entire body of evidence in this study, we transparently report all our findings in an easy-to-use interactive companion website. These procedures bind our hands to intentional or unintentional misuses of analytical discretions and provide the reader with unbiased and unrestricted access to the collected evidence (Wuttke Reference Wuttke2019).
To strengthen the validity of the substantive findings and to increase the informational value of testing the mechanisms that may underlie particular patterns of attitude shifts, this study employs statistical techniques to separate distinct attitudinal trends. Attitudinal trends may stem from period effects that reflect shifts in the marginal distribution of attitudes, for example in response to external shocks that do not vary by age or generational affiliation. Alternatively, such trends may reflect generational disparities that affect the distribution of attitudes within a society over time through generational replacement. Time may also play a role as life-cycle effects that are hard to disentangle from generational effects from a cross-sectional perspective. Yet, life-cycle effects usually have no ramifications for attitudinal trends at the societal level and are thus of limited relevance to the state of democracy (Norris Reference Norris2017, 9f; Voeten Reference Voeten2017, 5).Footnote 2
Hence, each temporal effect has distinct implications for the future distribution of attitudes. Because these temporal effects relate to distinct theoretical arguments, disentangling cohort, period and life-cycle effects advances testing the theoretical mechanisms proposed in the debate on democratic deconsolidation. Finally, aggregate-level stability when observed in descriptive studies may overshadow countervailing attitudinal dynamics of period and cohort effects that could be revealed when separating these effects. While prior studies have often used less demanding methods (for example, Denemark et al. Reference Denemark, Mattes and Niemi2016b; Foa and Mounk Reference Foa and Mounk2017b; Norris Reference Norris2017; Norris and Inglehart Reference Norris and Inglehart2019; Voeten Reference Voeten2017) that run the risk of conflating temporal effects, there are good reasons to employ statistical techniques that discern the distinct temporal pathways that may underlie attitudinal trends toward democratic deconsolidation.
Data and Research Design
We analyze data from the European Values Survey, including the recently released fifth wave (EVS 2019). We consider all European countries in the analyses that are classified as consolidated democracies according to the Polity IV index plus France. Because attitude trends may differ across countries, we report the results for each country separately. Evidence on seven additional European democracies is reported in an interactive Shiny Web Application that accompanies this study (http://democracy.alexander-wuttke.de).Footnote 3
Bearing in mind the wealth of relevant indicators and the space limitations, we only report the development of selected indicators in the main text. Indicator selection was guided by data availability (indicators must have been surveyed in at least three EVS survey waves) and substantive arguments. Given their character as the ‘backbone of the measurement of support for democracy’ (Mattes Reference Mattes2018), it does not come as a surprise that citizens' regime preferences are central to current scholarly debates (Foa and Mounk Reference Foa and Mounk2016; Voeten Reference Voeten2017). EVS employs the following questions to capture them: ‘I'm going to describe various types of political systems and ask what you think about each as a way of governing this country. For each one, would you say it is a very good, fairly good, fairly bad or very bad way of governing this country? (1) Having a democratic political system (2) Having a strong leader who does not have to bother with parliament and elections (3) Having experts, not government, make decisions according to what they think is best for the country (4) Having the army rule the country.’ In the main text, we use this question to report on respondents' preferences for democratic and authoritarian systems of government, respectively. As the second concept of key interest, we analyze the development of institutional trust, which has also played a role in the current debate (Voeten Reference Voeten2017). For compact reporting, we created an unweighted summary index of confidence in institutions that are affected by or involved in the process of democratic decision making: parliaments, justice systems and civil service bureaucracies (see the interactive Appendix for results on single indicators).
The main text focuses on these primary indicators, but we complement the reported evidence with condensed conclusions on substantively related secondary variables that tap into more specific attitudes towards democracy and other cultural and political orientations that are relevant to democratic stability. The full results on the latter are available in the interactive Appendix. The Appendix also reports tabulated results and findings on (mostly statistically insignificant or small) life-cycle effects. The main text focuses on period and generational disparities because they are critical to the over-time development of aggregate popular support for democracy.
As a main analytical strategy for discerning age, period and cohort effects, we employ generalized additive models (GAM, Grasso Reference Grasso2014). We include the survey years as fixed effects for the period effects and recode age to a three-level categorical variable (15–29, 30–59, 60+).Footnote 4 Often referred to as the ‘problem of generations’ (Mannheim Reference Mannheim1970), operationalizing birth cohorts is rarely straightforward. Generational boundaries are seldom self-evident, and their specification is even more complex in cross-national analyses since formative phases and events may differ across countries. Because ill-specified thresholds run the risk of hiding meaningful patterns, we refrain from deriving a comprehensive categorization of cohorts. Instead, we estimate smoothed nonlinear cohort effects that retrieve any cohort commonalities among groups of individuals born in temporal proximity. This exploratory approach is particularly useful for the purpose of this study, as we focus on the attitudes of the young as one select birth cohort. Doing so allows us to examine whether recent birth cohorts differ from older birth cohorts without setting rigid a priori boundary specifications, and thus minimizes the risk of overlooking meaningful disparities related to a person's time of birth.
To assess the magnitude of attitudinal dynamics, we visualize predicted cohort and period effects with simultaneous intervals (Simpson Reference Simpson2018) based on the observed values approach (Hanmer and Kalkan Reference Hanmer and Kalkan2013). Because age, period and cohort (APC) analyses are sensitive to modeling choices, we replicated the analyses using the robust hierarchical APC method (rHAPC), which are reported in the Appendix (Bell and Jones Reference Bell, Jones, Burton-Jeangros, Cullati, Sacker and Blane2015). The rHAPC is more conservative concerning generational effects than the GAM and tends to underestimate generational effects (Bell and Jones Reference Bell and Jones2018), particularly when they are nonlinear such as when one cohort stands apart from preceding generations. We consider GAM to be the primary model and consider the results as less robust when they are not supported by both models. Hence, when interpreting the results, we focus on cases in which the evidence is consistent across models, and we mention substantial inconsistencies.
Results
We begin our inquiry of changes in support for democracy with a brief descriptive overview of the marginal distribution of the study's central indicators (Figure 1). Inspecting the development of citizens' self-reported preferences for a democratic system over the past decade, the overall trend suggests stronger support for democracy in the vast majority of European societies, from an already high level. A small decline in democratic regime preferences is visible in Denmark, but notable increases can be observed in countries such as Germany, Poland and the United Kingdom.
Trends in average levels of democratic support over time
Note: “Regime: democracy”: evaluation of “having a democratic political system” as a good or bad way of governing a country. “Trust institutions:” Summary index of trust in national parliament, justice system and civil service. “Regime: strong leader”: evaluation of “having a strong leader who does not have to bother with parliament and elections” as a good or bad way of governing a country.

The dynamics of institutional trust show similar patterns. Although confidence in the institutions of democracy diminished in a few countries (for example, Slovenia), by and large, the past decade was characterized by stability or rebounds of institutional trust in most countries. Democratic institutions bolstered citizens’ trust in a diverse set of countries such as Germany, Hungary, Norway and the United Kingdom.
The picture is more mixed with regard to authoritarian regime preferences. On average, the citizens of Italy, Slovakia and Spain now more strongly support a strong leader who does not have to bother with parliament than they did a decade ago. Still, in the majority of countries, undemocratic strongman governance has not grown more popular or has even lost support (for example, Hungary, the Netherlands and Poland).
Taken together, the raw distribution of indicators of democratic support reveals little evidence in favor of the democratic deconsolidation hypothesis. None of the reported indicators consistently declines across most countries; nor does any country consistently exhibit a decline in all indicators. Still, the descriptive evidence cannot conclusively refute the democratic deconsolidation hypothesis. For instance, if only the very recent birth cohort differs from previous generations, then – due to their small share of the population – even a strong decline in democratic support among the young might not lead to discernible trends in overall levels of support. Also, it is conceivable that period and cohort effects point in different directions and thereby offset each other. Therefore, in the following analysis, we disentangle these temporal effects to separately report period and generational effects.
Figure 2 enables us to take a deeper dive into the dynamics underlying the preferences for a democratic system of government. Cohort effects are represented by the purple curve, which shows predicted attitude levels for cohort members who turned 18 years of age at the respective time shown on the x-axis. Visualizing period-specific dynamics from one survey wave to the next while controlling for life-cycle and cohort effects, the red dot shows how period effects affect mean attitude levels over time.
Period and cohort effects on democratic regime preferences
Note: the figure shows predicted mean values for period and cohort effects derived from GAM analyses using an observed value approach with simultaneous confidence intervals. For the cohort plots in blue, smoothing splines are overlaid on the yearly predictions displayed in the background. Red dots represent period effects, showing predicted mean levels in the respective survey year.

The GAM results presented in Figure 2 show that the recent rise in democratic regime preferences is mainly due to period effects. After controlling for life-cycle and cohort effects, the average respondent in virtually all European countries favors the democratic system of government more strongly today than in the preceding survey wave a decade ago. The generational effects on democratic regime preferences are less pronounced. Most European citizens strongly prefer a democratic system of government, independent of their cohort affiliation. In some countries, such as Spain and the Netherlands, democracy is more strongly endorsed by the most recent birth cohorts than by earlier generations. Importantly, the more sophisticated GAM analysis provides no evidence that cohort and period effects might have worked in different directions, which could have created the false impression of stability in the descriptive analysis. Challenging the democratic deconsolidation hypothesis, period and cohort effects instead indicate stability or even a strengthening of democratic regime preferences.
Although these findings do not reinforce the notion that support for democracy has been eroding, subtle, yet consequential changes in citizens’ attitudes toward the democratic system might still have taken place. To begin with, regime preferences may remain unchanged, but respondents could attach lower importance to living in a democracy. However, an analysis of the importance respondents ascribe to living in a democratic country provides little evidence of shifts in perceived importance between time periods or across generations (except for a moderate generational decline in Sweden and the United Kingdom, see the Appendix).Footnote 5
In another scenario of subtle changes, abstract democratic regime preferences remain stable while citizens withdraw support for the very institutions that embody this form of government. Traditionally, one line of research has interpreted low levels of institutional trust in an optimistic way – as signaling the vitality of a critical citizenry that holds politicians accountable while remaining steadfast supporters of democratic principles (for example, Norris Reference Norris2011). More recently, however, some scholars expect growing distrust as a result of disenchantment with the democratic process more generally. In this vein, it is argued that an increasing number of populist citizens adhere to the idea of self-governance but reject the checks and balances on the popular will that courts and parliaments occasionally impose (Mounk Reference Mounk2018; Wike and Fetterolf Reference Wike and Fetterolf2018). Also, recent generations may perceive democracy's deliberately slow place and their mutually restraining institutions as inferior to the hyper-responsive media and technology young citizens experience in other life domains (Gurri Reference Gurri2018; Mounk Reference Mounk2018).
However, Figure 3 shows that the dynamics in institutional trust mirror the evidence on democratic regime preferences: Generational effects are fairly modest, and period effects often point upward. In a broad set of countries, period effects fostered confidence over the past decade, often substantially (for example, Austria, Finland, Germany, Lithuania, Sweden, UK). Hence, starting from a rather low level of confidence, democracy's institutions could regain trust in many European countries. For instance, for the average Austrian citizen, period effects led to an increase of confidence in democratic institutions from 0.47 [95 per cent CI 0.44–0.50] to 0.55 [0.52–0.57] scale points over the past decade. All in all, the findings on confidence in democracy's institutions is further assurance that support for democracy remains firm.
Period and cohort effects effects on trust in democratic institutions
Note: the figure shows predicted mean values for period and cohort effects derived from GAM analyses using an observed value approach with simultaneous confidence intervals. For the cohort plots in blue, smoothing splines are overlaid on the yearly predictions displayed in the background. Red dots represent period effects, showing predicted mean levels in the respective survey year.
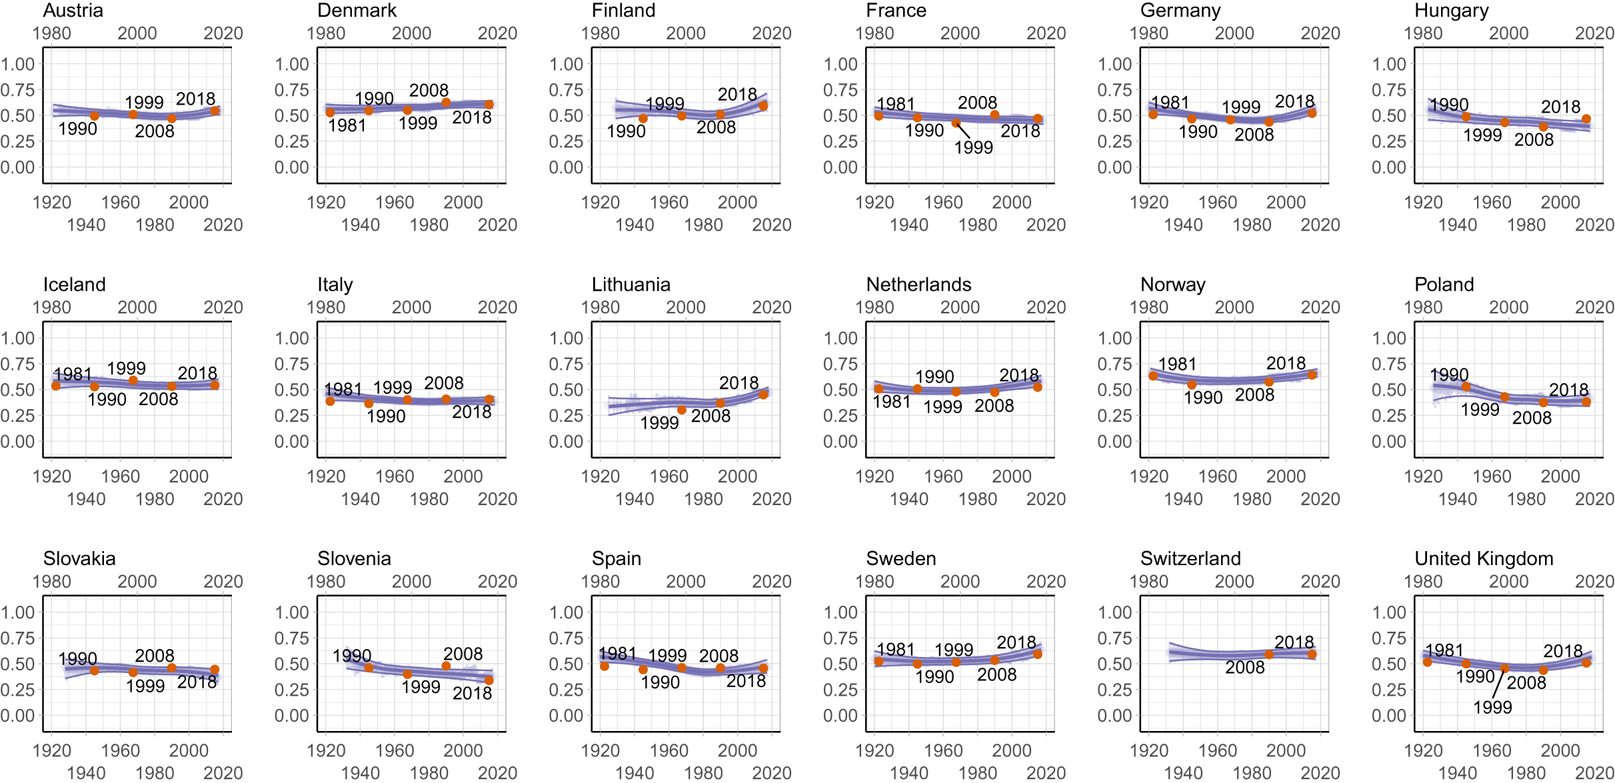
Thus far, the findings have lent little credence to the claim that democratic deconsolidation has been taking place in advanced democracies. This does not rule out the possibility, however, that alternative forms of government have gained traction among the public. Stronger support for other regime types diminishes democracy's relative advantage over potential competitors, and may thereby call into question the defining criterion of consolidated democracies as societies where ‘support for antisystem alternatives is quite small’ and, therefore, ‘democracy is the only game in town’ (Linz and Stepan Reference Linz and Stepan1996, 14–15).
In order to find out whether citizens consider democracy to be the only legitimate regime type or merely one of various viable options, we relied on the EVS indicators that measure evaluations of different types of government, led by the military, by experts instead of the government, or by a strong leader who does not have to bother with parliament or parties. Because support for authoritarian forms of government is at the center of contemporary scholarly attention, we report the results on anti-democratic preferences for a strong leader in the main text and the remaining indicators in the Appendix. Notably, these indicators show inconsistent, but significant, dynamics in democracy-related attitudes.
To begin with, the citizenries of most democracies under study have not substantially changed their opposition to strongman government over the past decade and continue to flatly reject this way of governing (Figure 4). Yet, some countries do exhibit considerable period effects. Most notably, in light of the country's political turmoil and instability, Italians have become more open to authoritarian government; in 2008, the predicted attitude level in Italy was at a low estimate of 0.21 [95 per cent CI 0.16–0.25] and increased to 0.32 [0.28–0.36] in 2018. However, the patterns are not consistent across Europe; in some countries such as the Netherlands, Norway and Poland, period effects on support for authoritarian regime types point downward.
Period and cohort effects on authoritarian regime preferences
Note: the figure shows predicted mean values for period and cohort effects derived from GAM analyses using an observed value approach with simultaneous confidence intervals. For the cohort plots in blue, smoothing splines are overlaid on the yearly predictions displayed in the background. Red dots represent period effects, showing predicted mean levels in the respective survey year.

The generational patterns reveal surprising results. The democratic deconsolidation hypothesis suggests the highest susceptibility to authoritarian regime alternatives among the youngest cohort (Foa and Mounk Reference Foa and Mounk2017b) whereas modernization theory would predict the strongest support among older cohorts, particularly the interwar generations (Norris and Inglehart Reference Norris and Inglehart2019). Across countries, there is no consistent evidence for either prediction. Generational disparities are narrow in most cases. Notably, in a handful of countries, the observed patterns are compatible with both of the seemingly rival models. In places such as Norway and Sweden, we observe U-shaped curves; cohorts that came of age in the protest-ridden 1960s and 1970s are strongly opposed to authoritarian government, but both older and the youngest birth cohorts are more open to a strong leader who does not have to bother with parliament. (U-shaped curves are even more prevalent in generational effects on the cultural role of authorities and, as an inverted-U curve, also on political interest, see the Appendix). Notably, even these generational disparities suggest that generational replacement is unlikely to lead to an erosion of democratic support in the near future. Instead, older generations with above-average inclinations for authoritarian regimes will be replaced by young cohorts that show similar orientations, leaving the average support for this regime type at the societal level virtually unchanged. Altogether, regardless of whether generational patterns show flat or U-shaped curves, in the medium term generational replacement is not on track to fundamentally shift support for strongmen government in Europe.
Do other indicators of regime preference show more worrying signs of increasing openness to non-democratic alternatives? The preference for experts instead of governments making political decisions is subject to some intertemporal dynamics, but they do not show a consistent pattern. Expert governments have become more widely accepted among the younger generations in Denmark, Sweden and the United Kingdom. Yet period effects show decreasing levels of support over time in Germany, Lithuania, Poland and Switzerland (see the Appendix). Military rule remains disavowed as a form of government throughout most of the continent. Neither period nor cohort effects point toward greater acceptance in the majority of countries. Yet, again in a few societies – France, Norway, Slovenia and the United Kingdom – the favorability of a military takeover has increased as of late, particularly among the most recent generation (see the Appendix for full results). Further supporting the idea that the young generation in selected countries has grown more comfortable with a political role of the military, an increasing share of the young generation in the named countries tends to consider army takeover a legitimate element of democracy where governments are incompetent.Footnote 6
What do our findings imply for the regime preferences of the most recent generation that have received much attention in scholarly debates? The results suggest that members of this cohort remain committed to democracy as a viable system of government. At the same time, in some countries, the youngest cohorts are also more receptive to other regime alternatives that promise clear and fast decisions. However, we observe increasing openness toward non-democratic regime types only in a minority of European societies, and these trends are limited in magnitude. The findings thus attest to the importance of monitoring generational disparities in regime preferences. However, while the dynamics presented here give reason for attentiveness, these modest attitude changes alone unlikely pose a severe threat to the societal underpinnings of democracy in European societies.
Conclusion
A thriving democracy must command the support of its people. Yet no free society can force its citizens to accept the prevailing political order. Therefore liberal democracies live by prerequisites they cannot guarantee themselves (Böckenförde Reference Böckenförde1976, 60), rendering the self-rule of sovereign citizens an inherently ambitious and precarious form of government. In times of growing pressure on long-standing institutions and the principles of liberal democracy, it is worth taking seriously recent evidence that suggests a significant decline of support for democracy among citizens of Western societies. In order to examine the validity of this claim, we analyzed recent survey data from eighteen European countries on various indicators of democratic support, employing adequate statistical techniques to disentangle cohort, life-cycle and period effects.
The most consistent finding throughout the entire sample of advanced European democracies indicates strong and continuing support for the democratic system of government. Preferences for democratic government remain stable, as do levels of self-reported importance of living in democratic polities; confidence in democratic institutions has even grown recently. These results thus cast doubt on far-reaching claims about widespread and increasing democratic fatigue, as there is no evidence that citizens of democratic societies are growing tired of governing themselves.
In some (but not nearly all) European societies, however, we found changes in what ‘democracy’ means to citizens and evidence of increased susceptibility to alternative systems of governing, particularly among the youngest generations. Hence, recently born citizens in some countries are less decisively opposed even to regime types that are clearly at odds with fundamental principles of liberal democracy, especially when compared to the protest generation that came of age in the 1960s and 1970s, which appears to champion self-governance.
To understand how we can reconcile the co-occurrence of these two findings – support for democracy remains stable while support for undemocratic alternatives rises in some populations – it is instructive to recall the nature of the political challenges that democracies currently face. Whereas in previous decades the Western form of democracy was challenged by systems of an entirely different type, critiques and assaults on democratic politics are now brought forward in the name of democracy itself (Krastev and Holmes Reference Krastev and Holmes2019; Runciman Reference Runciman2018). In this vein, it may not be surprising that our findings align with recent studies that also showed stable support for ‘democracy’ as an abstract term (Zilinsky Reference Zilinsky2019) but substantial variation in what citizens associate with this concept (Kirsch and Welzel Reference Kirsch and Welzel2019). Hence, some citizens may exhibit a growing but somewhat indeterminate openness to trying other than the established forms of political governance, which these citizens do not see as incompatible with their unshaken preference for a democratic system of government.
Yet considering that some of these tentatively considered regime preferences are at odds with established principles of (liberal) democracy, the bourgeoning evidence of democrats in name only may introduce a second phase in research on democratic fatigue. For future research, the relevant question seems less about whether citizens of consolidated democracies support the generic concept of democracy. The pressing question instead concerns the liberal-democratic quality of citizens' regime and process preferences (for example, Carey et al. Reference Carey2019; Graham and Svolik Reference Graham and Svolik2020; Wuttke, Gavras and Schoen Reference Wuttke, Gavras and Schoen2020). Building on the idea that how we want to govern ourselves is a multi-faceted concept, future research should examine whether the values, norms and attitudes of self-proclaimed democrats are compatible with normatively derived notions of democracy, particularly its liberal variant.
A comprehensive approach to the study of democratic support that accounts for the complexity of multi-faceted regime and process preferences may help assess today's political realities and promote the integration of those theoretical perspectives on democratic deconsolidation that we considered as competing in this study. For instance, Blühdorn (Reference Blühdorn2020) recently suggested that – consistent with post-modernist propositions – contemporary value change may indeed foster pro-democratic attitudes, but considered these dynamics more complex than being for or against democracy. Specifically, the tenet of ‘dialectic of democracy’ posits that the growing emphasis on self-realization strengthens demands for the recognition of one's identity, which fosters democratic proclivities; but in the age of individualization and digitalized consumer capitalism, these highly fragmented and volatile demands also pose a challenge for traditional democratic institutions (Blühdorn Reference Blühdorn2020; Fukuyama Reference Fukuyama2018; Gurri Reference Gurri2018).
The specific type of democratic politics envisaged by this line of reasoning is not only hard to reconcile with representative democracy in its current form. It is also hard to capture with current survey measures. With a different focus, the theory of pernicious polarization (Somer and McCoy Reference Somer and McCoy2019) also describes phenomena that have implications for citizens’ process preferences that are too complex for standard survey indicators to capture. Therefore, established measures show us that citizens have not given up on the idea of democracy. However, integrating insights from multiple perspectives may help to devise measures and analytical designs that move beyond a unidimensional conception of democratic support as either high or low. In effect, it may prove useful to grasping the complexities of how the multi-faceted regime and process preferences of democratic citizens change in the wake of current social transformations.
For political science, it thus remains a key task to continuously assess the state of consolidated democracies by observing a broad array of individual-level indicators. This study contributes additional evidence to this enterprise in a transparent and impartial way. It suggests caution against reports about the breakdown of public support for democracy in Europe. However, the evidence does not rule out the possibility that conceptions and preferences concerning the political order will undergo significant and worrisome changes in the years and decades to come. Political scientists are thus well advised to closely monitor the health of democratic support in order to avoid the embarrassment of being forced to announce that the patient died years before without anybody noticing.
Supplementary material
Replication material is available in Harvard Davaverse at: https://doi.org/10.7910/DVN/Y5Y6VD, pre-analysis plans are available at https://osf.io/bw5j3/registrations/ and the interactive, online appendices are available at http://democracy.alexander-wuttke.de/ and at https://doi.org/10.1017/S0007123420000149
Acknowledgments
We thank Richard Traunmüller, Gavin Simpson, Marcel Neunhoeffer, Verena Kunz and Guido Ropers for valuable comments, and Lukas Isermann and Marcel Klemm for help with the code review. We acknowledge the European Values Survey's timely publication of the questionnaire before publishing the survey data that enabled us to pre-register this study.


 Open access

