

1. Introduction
This paper explores how copper mining companies in the Central African Copperbelt – in cooperation or conflict with the respective colonial governments of Belgian Congo and Northern Rhodesia – secured mining labour in a context of endemic labour scarcity. From the start of mining activities under colonial rule (c. 1910) to the first years of independence (c. 1970) hundreds of thousands of African workers were involved in its operations. Yet, at the onset of copper mining activities this area was very lowly populated and the majority of subsistence farmers had little incentives to engage in contract labour, certainly not if this implied dislocation, partition of families, harsh working conditions and high mortality risks. The atrocities committed during the rubber and ivory campaigns in the Congo Free State also made the activities of European mining companies highly suspect. When the mining industry took off, first in the Belgian Congo (c. 1910 in the Katanga province) and some fifteen years later in Northern Rhodesia (c. 1925 in the Copperbelt province), new opportunities arose for local farmers to supply the mines with food and thus prevent wage labour. In the face of these disincentives, mining companies either had to use the stick to push African labour into the mines with force, or use the carrot, by sharing part of the profit.
In the historical economics literature, the institutional legacies of colonial rule in Africa are often considered for their persistent effects on long-term economic and political outcomes (Acemoglu et al., Reference Acemoglu, Johnson and Robinson2001; Banerjee and Iyer, Reference Banerjee and Iyer2005; Huillery, Reference Huillery2011; La Porta et al., Reference La Porta, Lopez-De-Silanes, Shleifer and Vishny1999), adopting the silent assumption that colonial institutions themselves were sufficiently stable to be captured in static indicators. In more historically oriented approaches, however, colonial institutions are considered to be dynamic and susceptible to fundamental changes, even in the relatively short period of African colonization. Our study of the Central African Copperbelt demonstrates how colonial systems of labour coercion transformed into systems of labour compensation as mining enterprises expanded production and desired higher investments in a stable, healthy and better trained workforce. As opposed to their oft supposed ‘persistence’, we show how labour market institutions went from coercion to compensation, and explore why institutional responses to labour scarcity varied at opposite parts of the colonial border. By documenting the changing combination of extractive and inclusive aspects in these emerging labour relations, we stress the need for dynamic conceptualizations of colonial institutions and reveal the role of historical contingencies in institutional development.
In theory, when people refuse to voluntarily offer their labour at a given rate of remuneration – be it cash or in-kind wages – employers may resort to coercion if they possess sufficient power to enforce credible sanctions against non-compliance. Direct enforcement at ‘gunpoint’ is the clearest example. Indirect forms of coercion operate via constraints on alternative means of economic reproduction, for instance by land dispossession, by cutting-off existing trade relations or by imposing monetary taxes. All these forms of coercion require institutional back-up by colonial governments and, to some extent, also by native authorities. The alternative strategy to ‘proletarianize’ labour is by offering wages above prevailing market rates, and guarantee living conditions that compensate for the sacrifices that workers (and their families) incur if they move into the mining compounds. Scholars have documented how institutionalized forms of labour coercion in the Copperbelt area were partly transformed into, and partly complemented by, so-called labour stabilization programs (Buelens and Marysse, Reference Buelens and Marysse2009; Butler, Reference Butler2007; Cooper, Reference Cooper1996, pp. 45–50; Ferguson, Reference Ferguson1999; Houben and Seibert, Reference Houben, Seibert, Frankema and Buelens2013; Parpart, Reference Parpart1983; Perrings, Reference Perrings1979). Much less attention has been paid to the question why there were considerable differences in the institutional arrangements to mediate the supply of labour in the Congo and Rhodesia, and how these evolved over time.
We compute internationally comparable series of real wages of African copper mine workers to trace the temporal development of mine-workers’ remuneration. The recent surge in African real wage studies provides us with new reference points for level and trend comparisons (Bolt and Hillbom, Reference Bolt and Hillbom2015; Bowden et al., Reference Bowden, Chiripanhura and Mosley2008; de Haas, 2014; de Zwart, Reference De Zwart2011; Frankema and van Waijenburg, Reference Frankema and Van Waijenburg2012). We find that African copper mine workers’ wages underwent impressive rises and that around the 1940s Copperbelt miners were among the best paid manual labourers in Sub-Saharan Africa. Our series also reveal that remuneration levels in the Congolese and Rhodesian mines were quite similar, suggesting that wage competition or wage coordination was at play. However, the quality of other welfare facilities such as medical care, schooling and housing was considerably higher in Katangese mining areas than in most of the Rhodesian mining areas, a difference that may be attributed to the wholehearted embracement of labour stabilization programs in the Belgian Congo, and a more hesitant adoption in Northern Rhodesia.
For this paper, we used a wide range of primary historical sources such as individual company records, the monthly and annual reports of the Native Labour Department of the Belgian mining company Union Minière du Haut Katanga, the Year Books of Northern Rhodesia's Chamber of Mines, correspondence between company management and the government and between managers of different mining companies, reports of health inspectors, reports of the vice Consul of Northern Rhodesia in Katanga and the reports of the Inspector for Northern Rhodesian Natives in Katanga. We proceed in Section 2 with a concise historical overview of the evolution of the mining industry in the Central African Copperbelt. In Section 3, we discuss the practice of forced labour recruitment up to the temporary labour demand fall-out during the depression of the early 1930s. In Section 4, we present our comparative real wage series. In Sections 5 and 6, we analyse the Katangese–Rhodesian differences in other welfare conditions. Section 7 concludes.
2. Copper mining in the Belgian Congo and Northern Rhodesia, c. 1900–1970
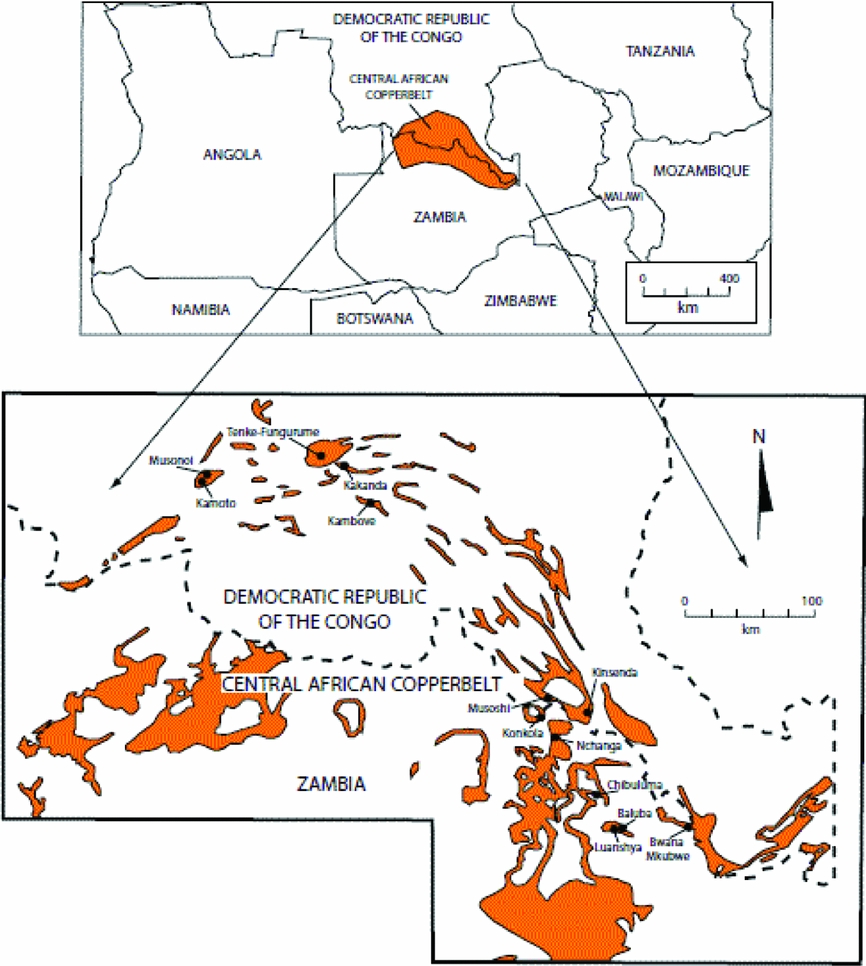
At the eve of independence in 1960, copper produced in the Katanga province of the Belgian Congo accounted for 45% of total export value, and 8% of total world production (Northern Rhodesian Chamber of Mines Year Book, 1960). In Northern Rhodesia, copper even generated more than 90% of total export value in 1964, and with ca. 12% of the world market this country became the second largest producer of copper after the United States (Copperbelt of Zambia Mining Industry Year Book, 1964). In the wake of expanding mining operations considerable manufacturing sectors emerged and the once so remote Copperbelt region (Figure 1) attracted large concentrations of mine workers and their families, who settled in and around the mining compounds (Austin et al., Reference Austin, Frankema, Jerven, O'Rourke and Williamson2017; Buelens and Cassimon, Reference Buelens, Cassimon, Frankema and Buelens2013; Ferguson, Reference Ferguson1999; Perrings, Reference Perrings1979).
Map of copper deposits in the Central African Copperbelt.
Already in the mid-19th century European explorers had noted the use of copper in local ornaments, but in the 1890s missionaries started to popularize the mineral wealth of Katanga in their travel reports, raising the interest of British prospectors (Berger, Reference Berger1974; Coleman, Reference Coleman1971). King Leopold II entrusted the administration of Katanga to a private company (Compagnie du Katanga), which was turned into the Comité Spécial du Katanga (CSK) as the colonial state took a majority share in the mineral concessions. Unable to attract Belgian prospectors, in 1900, the CSK joined forces with Robert Williams, a Scottish engineer who had also obtained prospecting rights in Northern Rhodesia (Katzenellenbogen, Reference Katzenellenbogen1973, p. 31). In 1906, the Union Minière du Haut Katanga (UMHK) arose from a merger between the CSK and William's Tanganyika Concessions Ltd. When the Belgian state took formal control over the Congo in 1908, the UMHK retained its copper mining monopoly. Production started in 1912 and by the late 1920s Belgian Congo had become the world's third largest copper exporter, accounting for c. 6% of world output (Perrings, Reference Perrings1979). Through its holding in the CSK, the colonial state retained the rights to two-thirds of all profits generated by the mines and the Congolese railways and by 1958 the state still held c. 60% of the shares (Perrings, Reference Perrings1979).
In Northern Rhodesia deposits of lead, zinc and copper were discovered in 1902, but large-scale investments in mining operations were halted until the mid-1920s, some fifteen years later than in Belgian Congo. Until the mid-1920s, Northern Rhodesia merely functioned as a labour reserve for mines and plantations in Katanga and Southern Rhodesia. The colony was also of strategic importance for food and coal supplies to the Katanga mines, for copper transports to coastal harbours and for railway connections with other parts of southern Africa.
Rhodesian copper deposits consisted of oxide ores yielding 3–5% pure copper, which were more costly to extract and refine than the 15–25% yields of the Katanga reserves. When the British Colonial Office took over control in Northern Rhodesia from the British South Africa Company (BSAC) in 1924, the BSAC retained its mineral concessions and attracted two investment groups to prospect and exploit the Rhodesian copper reserves: Beatty's Selection Trust Limited, a British concern with American financial and technical backing, and Sir Ernest Oppenheimer's Anglo American Corporation of South Africa. Small-scale underground mining had taken place intermittently in a few mines before, such as in Bwana Mkubwa and Broken Hill, but the new investments in mining technology were needed to create a breakthrough. Between 1925 and 1927, total copper production in the Copperbelt rose from 76 tons to 3,290 tons per year (see Figure 2). These companies also discovered new sulphide deposits containing copper ore, which could be extracted with a new floatation process (Burdette, Reference Burdette, Konczacki, Parpart and Shaw1990, p. 80). By 1930, four large mines were under construction: Roan Antelope (now Luanshya), Nkana (in Kitwe), Mufulira and Nchanga (in Chingola). The first copper was produced in Roan Antelope in 1931 and Nkana followed in 1932. Manufacturing plants were built to supply the mines with food, beverages and tobacco, and to smelt and refine the ore on site. The two concession companies remained in control of the copper industry until 1970, when the Zambian government took a 51% stake in the mines (Berger, Reference Berger1974).
Copper production in thousands of tons and copper prices in £ per ton, 1911–1964.
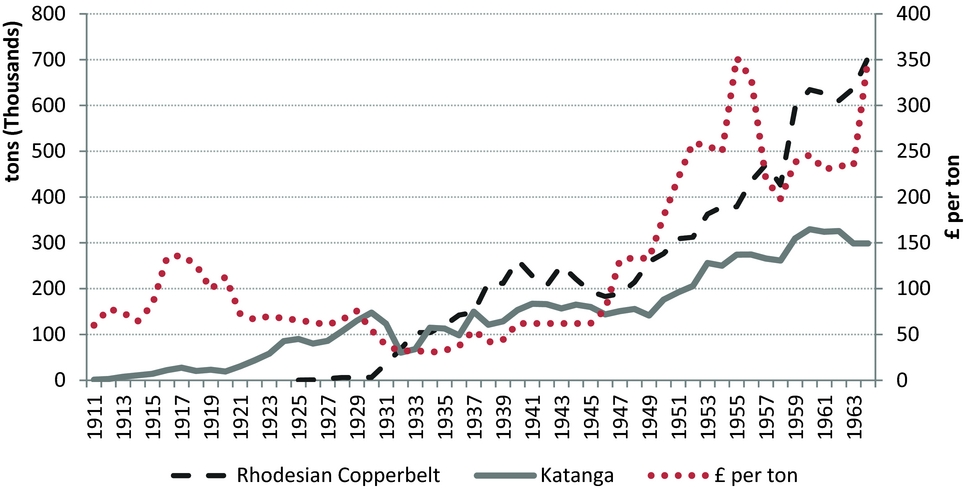
Due to rising demand from expanding automobile and electric industries in Europe and North America, copper prices had a solid floor during the 1920s, but plummeted from 24 cents per pound in 1929 to 6.25 cents in autumn 1931 (Ferguson, Reference Ferguson1999). Output from the UMHK fell from 150,000 tons in 1930 to 60,000 tons in 1932 and the African labour force was reduced by over two-thirds: from an average of 18,517 workers in 1930 to 5,065 in 1932. In Northern Rhodesia, the Bwana Mkubwa mine, the Broken Hill lead and zinc mine, and the copper mines of Nchanga and Mufulira all closed down just after they had started production. Construction work at Roan Antelope and Nkana was put on hold. The number of African employees, which had reached a peak of 31,941 during the construction boom in September 1930, dropped to 19,313 in September 1931 and to 6,677 by September 1932 (Ferguson, Reference Ferguson1999).
The industry recovered relatively quickly, however. Most of the mines in Northern Rhodesia were in operation again by October 1933. Copper prices reverted and production doubled between 1935 and 1943 in the Rhodesian Copperbelt. Stimulated by heightened war demand, the mining labour force in the Rhodesian Copperbelt surpassed 30,000 in 1942 and reached a peak in Katanga of 25,000 in 1944 (see Figure 3). With the availability of new techniques such as the ‘floatation’ for processing complex ores, as well innovations in underground mining technology, the scale of operations in Northern Rhodesia could grow far beyond the surface mining operations in the open pit mines of the UMHK. Rhodesian output levels overtook the UMHK during the Second World War and by 1960 almost doubled production in the Katanga mines: 634,000 versus 329,000 tons (see Figure 2).
Average annual no. of African copper mine workers in Katanga (UMHK) and the Rhodesian Copperbelt.

Production in the Copperbelt rose steeply in the 1950s and 1960s and peaked in 1972. The ‘golden age’ of post-war growth in Europe and the Korean war boom of 1953 reinvigorated international demand for copper. The Vietnam war again boosted copper prices and, from 1963 to 1964 alone, copper exports rose by 50% in the Congo and 66% in Northern Rhodesia. The mining labour force expanded up to the beginning of the mid-1950s (see Figure 3) and urbanization rates rose as more and more families permanently settled in the region. Rising profits and wages spilled over into local consumer demand. The tide turned with the first oil crisis in 1973, when copper prices started to decline and did not recover until the mid-1990s. The Vietnam war had ended, the world economy went into a prolonged recession and industrial substitutes for copper, such as optical fibres for telecommunications, gained ground.
As state budgets had come to lean on copper revenues, the ‘resource curse’ unfolded.Footnote 1 The Congo also lacked sufficient human capital to keep the mining sector going after independence, as bars on higher education for Africans in colonial times had seriously limited supplies of high-skilled workers (Buelens and Cassimon, Reference Buelens, Cassimon, Frankema and Buelens2013; Frankema, Reference Frankema, Frankema and Buelens2013). When Mobutu nationalized the copper mines in 1966–1967, the Congo had to call back in technical assistance from the Belgian-controlled UMHK. The Katanga secession war disrupted production, damaged infrastructures and ended with the Mobutu dictatorship in 1965. The war of liberation in the neighbouring Portuguese colony of Angola led to the closing of the Benguela railroad, cutting-off Katanga from export markets and from imports of machinery and petroleum.
The collapse of copper prices was equally detrimental to the Zambian economy. After independence in 1964, president Kenneth Kaunda tried to move the economy away from its dependence on foreign companies that controlled Zambia's commodity exports (Roberts, Reference Roberts1976). In 1969, the government first reverted all rights of ownership of minerals as well as exclusive prospecting and mining licenses to the state, and then acquired a 51% stake in Zambia's two main copper producing companies. The state gradually increased its control over the copper industry in the 1970s. It took over the responsibility for management and sales of Anglo American and Rhodesian Selection Trust in 1974. The two companies were merged into the Zambia Consolidated Copper Mines (ZCCM) in 1982. Although the first decade of independence had seen considerable economic progress, developments abated when the price of copper collapsed. The Zambian government was forced to borrow in order to maintain public services and social provisions and when interest rates shot up after the second oil crisis in 1979, the country was dredged into a long crisis. In the twenty years between 1974 and 1994, copper prices continued to fall relative to import prices. Per capita incomes declined by 50%, turning Zambia into one of the poorest countries in the world.
3. Labour recruitment by the UMHK before the Great Depression
The biggest challenge of the UMHK during the first two decades of its existence was to secure a steady supply of 10 to 20 thousand mining workers in an area with dispersed settlements of subsistence farmers who had no incentives to take up work in the mines. The UMHK resorted to aggressive practices of labour recruitment, which were actively supported by an invested colonial state. In 1910, a government-assisted recruiting agency, the Bourse du Travail de Katanga (BTK, later OCTK), was founded to recruit labour within the Congo, and especially in the central province of Kasai and the Lomami district in Katanga. In cooperation with local chiefs, colonial officials determined how many men could be recruited per village. Chiefs received compensation for each recruit. The colonial government also raised hut and poll taxes to enhance wage labour supplies and imposed an identification system to trace defaulting workers.Footnote 2 According to Northrup, recruitment practices followed a standard routine:
a recruiter from the mines went around to each village chief accompanied by soldiers or the mines’ own policemen, presented him with presents, and assigned him a quota of men (usually double the number needed, since half normally deserted as soon as they could). The chief then rounded up those he liked the least or feared or who were least able to resist and sent them to the administrative post together by the neck. From there they were sent on to the district headquarter in chains [. . .]. Chiefs were paid ten francs for each recruit. (cited in Hochschild, Reference Hochschild1998, p. 275)
Recruited workers frequently deserted during the journey to the mines or shortly after arrival. According to official reports, the most common causes for desertion were the desire to return to their families, the high death rates among workers, the way indigenous workers were treated (payment issues, morbidity, physical punishment), the low-quality nourishment and the ‘mentality of the blacks’. Labourers from the central area of the Congo also had difficulties to adapt to the mountain climate of Katanga. In 1913–1917, annual mortality rates of mining workers ranged from 70 to 140 per 1,000 (Roberts, Reference Roberts1976, p. 178).
Despite the widespread use of force and repression, this recruitment system did not meet demand. Up to 1925, about half of the UMHK workforce was recruited outside the Congo, in Northern Rhodesia, Mozambique, Nyasaland, Angola and Barotseland (see Table 1). The BSAC permitted labour recruitment for the Katanga mines in Northern Rhodesia because they provided traffic for the railways passing through the company's territory (Perrings, Reference Perrings1979). Moreover, since there were limited opportunities for commercial agriculture – also because white farmers were given preference – the wages earned by labour migrants across the border widened possibilities for local taxation.
Origin of labourers at the UMHK in percentages

Source: Annual Reports UMHK – Main-d'oeuvre indigène.
Note: From 1928 on, the place of origin of non-Congolese or Rwandan was not specified anymore, but they were all categorized as ‘foreigners’.
Labour migration from Northern Rhodesia into Katanga was regulated by inter-state contracts allowing a permanent Inspector of Rhodesian Labour at the largest Katangese mine, ‘Star of the Congo’/Lumumbashi (until 1933), and giving Williams & Co. the exclusive recruitment right. These contracts also stipulated that workers had to return to their home village at the end of their service term, where they would receive the last part of their wage according to the so-called deferred pay system. This way Rhodesian mine workers were able to fulfil their domestic tax obligations. Mine workers received contracts for 30 shifts to be fulfilled in a period of 35 to 40 days. The employer marked the completion of each days’ work on a ticket. Salaries were paid after 30 shifts were completed. Workers were allowed to complete six tickets of 30 shifts and could prolong for another six tickets, but most of them did not. By 1920, labour migration streams were well established, steadily growing and Rhodesian workers built up a good reputation for their accumulated work experience.
In the 1920s, the Belgian foreign office started to voice some concerns about violent recruitment practices in the Congo, Northern Rhodesia and Angola.Footnote 3 A 1925 report of the colonial government noted that: ‘Le recrutement par loi ne peut pas être forcé contre volontés de l'indigène, mais en pratique ils ont été forcés par les recruteurs’.Footnote 4 Not very surprising, as the Belgian Congolese government in 1922 had legalized the use of physical violence, such as whipping, to force workers to fulfil their labour contracts (Houben and Seibert, Reference Houben, Seibert, Frankema and Buelens2013; Perrings, Reference Perrings1979).
Indeed, it were not the concerns with coercive practices of labour recruitment that barred the regular flows of labour migrants to the Katanga copper mines, but rather the new prospects of mining operations at the Rhodesian side of the Copperbelt border. During the First World War, labour recruitment in Northern Rhodesia had been banned temporarily because of the heightened need for army recruits. Yet, from 1925 onwards the Rhodesian government imposed a permanent quota system, to retain labour resources within the colony. Table 1 shows how quickly the shares of ‘foreign’ workers decreased in the Katanga mines, from ca. 60% in the early 1920s to about 10% in the 1940s. As we will show in the next section, this development corresponded with strong upward pressure on wages in the late 1920s.
The collapse of copper prices during the Great Depression temporarily relieved UMHK's labour shortages. Given the acute oversupply of mining labour, absenteeism and desertion rates dropped sharply and the mining companies could afford to disregard living conditions of Africans in the compounds. According to Parpart (Reference Parpart1983, p. 49), the rate of accidents at work increased in the early 1930s. The UMHK decided to stop recruiting outside the Congo and the mandated territories of Ruanda and Urundi altogether in 1931. In 1932, the mining companies at opposite sides of the colonial border agreed to coordinate wages. After the depression, forced recruitment of labour had become unnecessary in the Rhodesian Copperbelt, since migrant workers came to the mines on their own initiative. The costs of the recruiting agency, transport, housing and food during the journey to the mines, as well as the taxes that had to be paid in foreign countries, could be saved and invested in workers’ wages to attract migrant labourers on a voluntary basis.
The long-term consequences of the depression for labour relations in Katanga were different, however. Confronted with the loss of the Rhodesian pools of migrant labour, the UMHK continued to recruit labour from within the Congo until the 1960s, albeit under more humane conditions. Moreover, food supplies by white settler farmers to the Katanga mines were now increasingly absorbed by Rhodesian mines. This opened up renewed opportunities for the rural population in Katanga to engage in commercial agriculture, which lowered incentives to engage in wage labour (Parpart, Reference Parpart1983).
In Section 5, we will look deeper into the adoption of labour stabilization programs in Katanga and take up the question why the combination of labour coercion and labour compensation was more pronounced in the Belgian Congo than in Northern Rhodesia. For now it suffices to note that the sudden loss of the Rhodesian labour pool to the UMHK initiated a fundamental change in the institutional response of the Belgian colonial state (the majority shareholder) to African labour scarcity.
4. Real wages of African copper mine workers in comparative perspective
Method
To convert nominal wages into comparative real wages, we adopt Allen's (2001) ‘barebones subsistence basket’ deflation method, an admittedly crude, but widely used and intuitively appealing method for conducting cross-spatial and inter-temporal price comparisons. The basic rationale is to compute the number of consumption baskets that an annual adult male's wage can buy. This number is called the ‘welfare ratio’, where a ratio of 1 represents barebones subsistence (the absolute poverty line). Wage income is defined as the total sum of monetary compensation (i.e., salary) and expenses incurred by the employer for food rations, firewood and housing (in-kind payments). The barebones subsistence basket we use is equal to the one designed by Frankema and van Waijenburg (Reference Frankema and Van Waijenburg2012) for Sub-Saharan Africa (see Appendix A). The subsistence basket for one worker provides a minimum amount of calories (1,940) and a minimum of proteins (42 grams). It is assumed that a family consisting of a man, his wife and two/three children requires three baskets for survival, which implies 555 kg of maize, 9 kg of beef, 6 kg of sugar, 9 litres of palm oil, 9 metres of cotton, 3.9 kg of soap, 3.9 litres of kerosene, 3.9 kg of candles and 2 MBTU of charcoal.
Although mine workers consumed different staple crops like cassava, millet, maize and possibly rice (for the best paid workers), we stick to maize because it was the cheapest and most widely consumed staple food in this part of Africa (the rations provided by the company actually included maize or maize meal and sometimes cassava, but no rice). Allen (Reference Allen2001), Allen et al. (Reference Allen, Bassino, Ma, Moll-Murata and Van Zanden2011) and Frankema and van Waijenburg (Reference Frankema and Van Waijenburg2012) add 5% to the value of the subsistence basket to account for housing rent. Since workers were housed by the mining companies for free, but not all the companies recorded information on the costs of housings (construction amortization/reparations), we omit the rent both from the wage and subsistence basket calculations.Footnote 5
In the case of Katanga, wages, costs of rations and the prices used to construct the subsistence basket are those paid by the UMHK, reported in the yearly reports of the Native Labour Department. Since our primary sources lack price data on coal, candles, cotton, soap and kerosene, we take import prices of cotton cloth, soap and kerosene from Congolese trade statistics (Annuaires Statistiques de la Belgique et du Congo Belge) and add 20% to its unit value to account for costs of transport, taxes and trade (Frankema and van Waijenburg, Reference Frankema and Van Waijenburg2012). We add 2.5% for candles to the total cost of the subsistence basket. Firewood was provided for free by the company.
For Northern Rhodesia, we derived price data from the Colonial Blue Books of Northern Rhodesia (1929 to 1948), which report retail prices for Livingstone. For scattered years after 1948, we have food prices reported by the mining companies. We interpolated price series for years we had no data. To accommodate a lack of price information for cotton, palm oil, coal (fuel) and candles, we use different methods. Since palm oil is produced in Africa, we use an average of African export prices reported in colonial trade statistics and subtract 20% for transport, taxes and trade costs. As for cotton cloth, which was usually imported, we use British African import prices reported in British trade statistics, plus a 20% margin. For coal and candles, we add in total 10% to the cost of the subsistence basket (2.5% for candles and 7.5% for coal and firewood).
The wage data for 1930 to 1949 derive from a report on the Mufulira mine and for 1950 to 1960 from the statistical Year Books published by the Northern Rhodesian Chamber of Mines, which contain average wages paid to African mine workers. When we only had information on wages per shift, we multiplied these by 312 days to obtain annual wages, in line with the assumptions adopted by Frankema and van Waijenburg (Reference Frankema and Van Waijenburg2012). The costs of rations (and wood) carried by the company derive from the same sources, except for the 1930s, when we used the Colonial Blue Books of Northern Rhodesia.Footnote 6
Before we discuss the results, we need to be clear on what this real wage method captures and what it does not. The standard assumption of 312 shifts per year is defendable for stabilized workers, but circular migrant workers would probably only make between 100 and 200 shifts per year before turning back to their villages, where they would take up farming incomes and contribute to other forms of production and household income, along with their kinship. Moreover, as workers’ wages would rise considerably above barebones subsistence, their consumption would have shifted towards more luxurious commodities. What we measure, therefore, is not the real income of mine-worker families, nor their actual consumption patterns. What we capture is the development of comparative purchasing power of mining wages and, indirectly, the comparative levels of labour compensation offered by the mining companies.
Results
The real wages of African copper mine workers in Katanga and the Rhodesian Copperbelt are shown in Figure 4. They provide us with three key insights. First, there was a notable long-term increase in labour compensation, which is consistent with the literature on the Central African Copperbelt, but has never before been demonstrated in a comparative quantitative analysis. Welfare ratios rose from around barebones subsistence (1–2 baskets) in the early 1920s, to around seven or eight baskets in the late 1950s. In fact, this increase was impressive by all standards of welfare development in a colonial and non-colonial economic context.
Welfare ratios of copper mine workers in Katanga and the Rhodesian Copperbelt, 1922–1958.
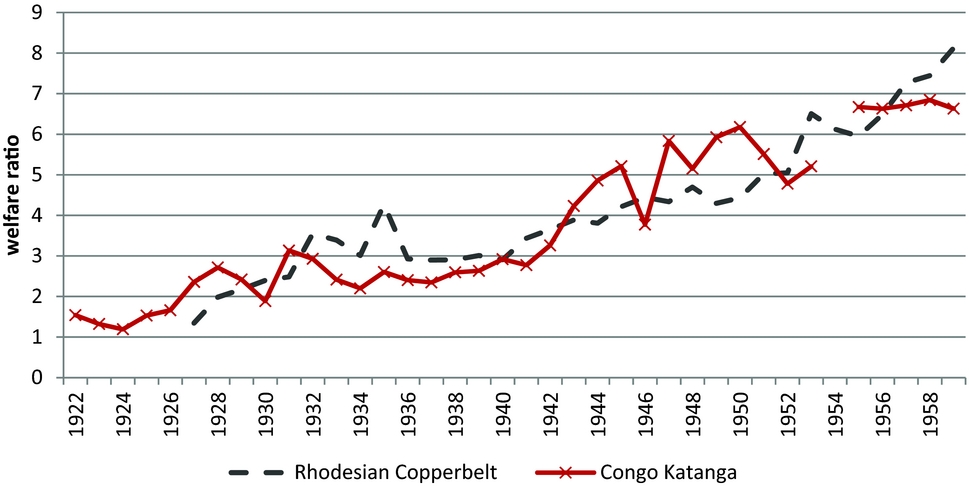
Second, periods of real wage growth and stagnation appeared to correlate with changes in the demand for mining labour. From 1922 to 1925, we observe a phase of rather stable and low real wages. In those years, the UMHK was still the only company in the Copperbelt in search of labour. Real wages started to shoot up as soon as the restrictions to UMHK labour recruitment in Northern Rhodesia took effect. Competition from Rhodesian mining companies enhanced the bargaining power of African mine workers. The rise in real wages came to halt during the depression of the 1930s and remained fairly stable around a welfare ratio of 3. Wage rises were no longer needed to secure sufficient labour supplies and the agreement of 1932 between the mining companies in the Copperbelt suppressed wage competition. Yet, real wages did not collapse, as nominal wage cuts were compensated by declining consumption prices and reduced costs of food rations.Footnote 7 With the onset of the Second World War copper prices boomed, and production volumes and the size of the mining workforce rose accordingly (see Figure 2). Real wages shot up again and this time the increase continued with a few interruptions up to the late 1950s.
Third, wage rates in Katanga and the Rhodesian Copperbelt followed a remarkably similar trend, which reveals the degree of coordination between mining companies at both sides of the border. Our series also hide an important difference in the composition of mine workers’ wages though. The UMHK paid considerably lower cash wages and made higher in-kind payments. These in-kind payments were reflected in both the quality and quantity of food rations (see Table 2). As we will argue below, this difference squares with the labour stabilization policies adopted in the Belgian Congo, and a greater reliance on circular migrant labourers in Northern Rhodesia, who were keen to bring home as much cash as possible. The share of nominal wages paid in cash rose sharply in Northern Rhodesia in the 1950s with the introduction of so-called inclusive wage schemes, when housing and food rations for workers and their families were no longer provided for free, but had to be covered from their cash wages (Northern Rhodesia's Chamber of Mines Year Books).Footnote 8
Share of wages paid in cash in Katanga and the Rhodesian Copperbelt, 1919–1959
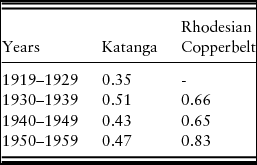
Source: Annual Reports UMHK – Main-d'oeuvre indigène and Northern Rhodesia's Chamber of Mines Year Books.
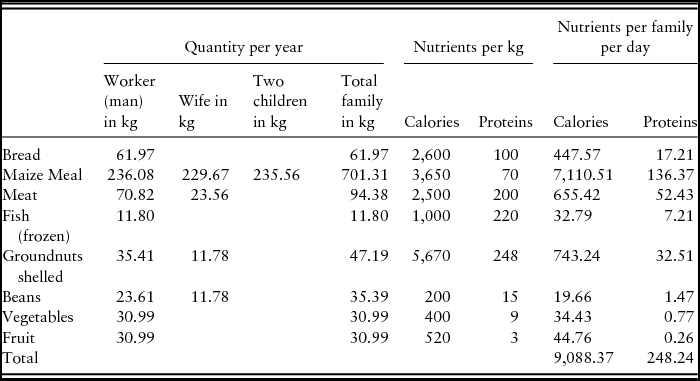
For some years, our sources report the exact contents of the food rations provided to the mine workers and their families (Annual Reports of the UMHK Native Labour Department and Northern Rhodesia's Chamber of Mines Year Book 1956), indicating that the UMHK rations contained higher caloric and protein values than the rations granted in the Rhodesian Copperbelt (see Appendix B). For instance, already in 1925 the UMHK provided daily rations to married workers with two children with over 10,000 calories and 300 grams of proteins, whereas a Northern Rhodesian Copperbelt mine in 1956 provided rations with a nutritional value of 9,000 calories (see Appendix Tables A1, Table B1, Table B2). To put these figures into perspective, the family subsistence basket we adopt to compute real wages has a total nutritional value of 5,800 calories and 129 grams of protein per day. To be sure, mine workers required more calories to perform their physical labour than an average subsistence farmer would have needed.
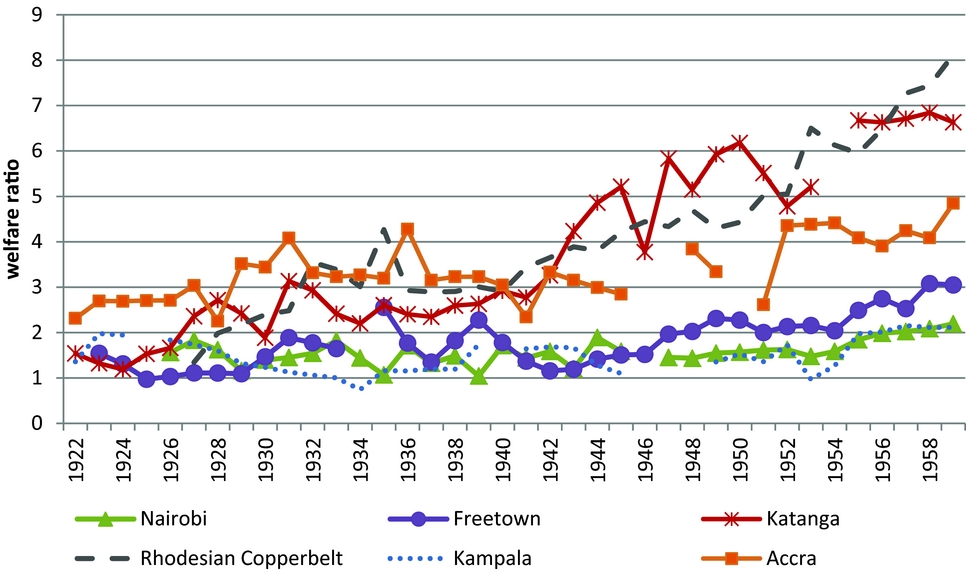
Figure 5 puts our real wage series in comparison with the welfare ratios that have been estimated for urban unskilled wage workers in several West and East African cities such as Freetown, Accra, Nairobi and Kampala. This comparison reveals that after the rise in real wages in the second half of the 1920s, levels of labour compensation in the mines rose to the high end of the African spectrum. In the 1940s, the gap grew to significant proportions, surpassing the real wage levels of Accra, which probably had the highest wages in West Africa at that time (Frankema and van Waijenburg, Reference Frankema and Van Waijenburg2012). By the 1950s, copper mine workers were among the best paid manual workers in Sub-Saharan Africa.
Welfare ratios in Katanga, Northern Rhodesia and various African capitals, 1922–1960.
There are four provisional explanations as to why the copper wages rose so far above prevailing market wage rates elsewhere. First, real wage trends reflected the gradual realization that investments in long-term relationships with employees and their families would eventually pay off, and therefore had to compensate mine workers for settling with their families in an alien area, for conducting severe physical labour, and for continuous exposure to high risks of accidents, disease and mortality. Second, especially from 1940 to the late 1950s, copper mining was an exceptionally profitable industry. This allowed the copper companies to outbid plantation wages, urban semi-skilled jobs and possibly also African government employees. Third, the increase in welfare ratios reflects a rise in the acquisition of semi-skilled labour, which complemented the technological advancements of the mining industry. Especially during World War II, when the colonies were temporarily cut off from the metropolitan countries, companies had to quickly upgrade the skills of indigenous workers in order to replace Europeans (Buelens and Cassimon, Reference Buelens, Cassimon, Frankema and Buelens2013, p. 237).
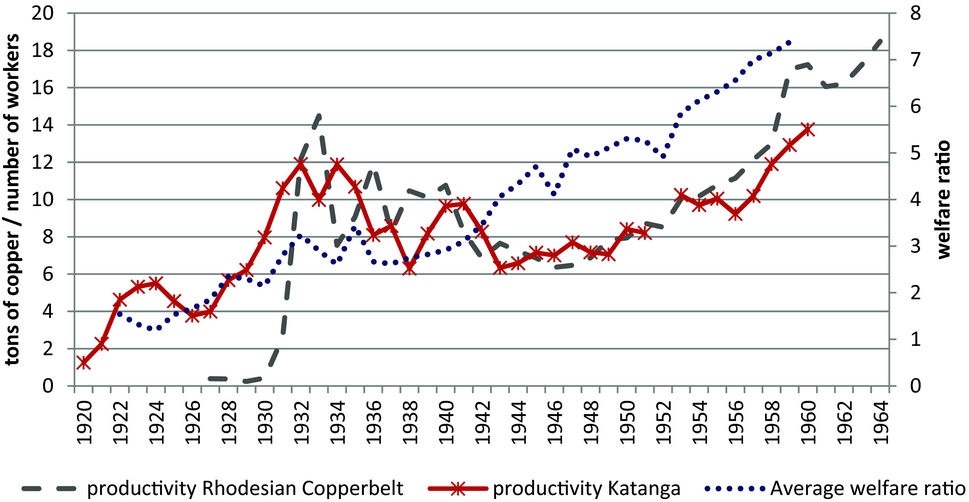
The accumulated profits of the Second World War demand boom were re-invested in technological improvements after the war. Rising mechanization fostered the productivity of labour in the mines of the Copperbelt, as is shown in Figure 6.Footnote 9 The productivity figures are high in the early 1930s, because the labour force had been drastically reduced during the Great Depression. They are relatively high again during the Second World War, as the mines were producing at full capacity. After the mid-1940s, there is a steady rise in tons of copper produced per worker, reflecting the increasing use of labour-saving technologies.
Productivity of labour (tons of copper per indigenous worker).
Fourth, the emergence of trade unions in Northern Rhodesia further contributed to income increases. The first indigenous mineworkers’ unions were formed in 1948 and merged into the ‘Northern Rhodesia African Mineworkers’ Union’ in 1949.Footnote 10 Its legal status was protected by a government ordinance, other than in South Africa, for instance. The Union proved its effectiveness after a strike in 1952, when indigenous mineworkers were offered substantial wage increases (Roberts, Reference Roberts1976, p. 205).
That copper-mine workers’ wages rose to exceptional heights is also corroborated by a comparison with wages of South African goldmine workers. In 1961, the nominal wages paid to African miners in the Copperbelt, all converted into current Great British Pounds (GBP), were over three times as high as in South Africa. Real wages indices in Table 3 show that the real levels of labour compensation in South Africa remained more or less stagnant between 1921 and 1961, while real incomes in the Copperbelt rose by factor 5 to 6. Since we do not have comparable retail prices for primary commodities purchased by South African gold mines, we cannot directly compare real wage levels. Yet, the annual nominal wage series show that the wages paid by the South African mines were initially higher, but were overtaken in the 1950s. More profound explanations for this remarkable difference in labour compensation trends are beyond the scope of this paper, but it seems that South Africa's apartheid system had rather different effects on material welfare growth than the stabilization programs adopted in the Copperbelt. This observation warrants further inquiry.
Annual nominal wages and index of real wages of African mine-workers in South Africa, Rhodesian Copperbelt and Katanga, 1921–1961 (1926=100)

Sources: Nominal wages and real wage index of gold miners in South Africa: Wilson (1972); Katanga: Annual Reports UMHK – Main-d'oeuvre indigène; Rhodesian Copperbelt: Official report on the mine of Mufulira (1930–1949); Year Books of Northern Rhodesia's Chamber of Mines (1950–1960). Exchange rate Franc to GBP: Perrings (Reference Perrings1979, p. 243) before 1939, and Clio Infra database from 1945, interpolated in between.
5. Labour stabilization
The main idea of labour stabilization was to settle (parts of) the African mining workforce with their families on the properties of the mining companies – in compounds or towns nearby – as to diminish the dependence on (foreign) migrant labour, lower the costs of recruitment and create an environment for long-term investments in workers’ health, skills and offspring. In the final two sections of this paper, we analyse the cross-border differences in welfare facilities, arguing that the wholehearted embracement of labour stabilization policies in the Belgian Congo and its more hesitant adoption in Northern Rhodesia had three underlying causes.
First, although it may seem as if the UMHK had enjoyed a critical ‘first-mover advantage’ in the recruitment of mining labour, thus raising entry barriers to the mining companies in Northern Rhodesia who arrived some 15 years later, the opposite was true: The Rhodesian companies benefitted from the pioneering role of the UMHK. The recruitment quota imposed by the Northern Rhodesian government in 1925 meant that the Rhodesian mining companies could tap into a steady flow of circular labour migrants, while it restricted supplies to the mines in Katanga. The changing role of the colonial border in separating markets for migration labour, forced the UMHK to expand its recruitment activities within the territories under Belgian control. The UMHK continued to recruit labour up to the 1960s, albeit in decreasing numbers (see Table 4). The immediate response to the quota system imposed by Northern Rhodesia was to extend the duration of labour contracts. Hence, for the Rhodesian mining companies the need to stabilize labour was lower.
Labour stabilization in Katanga

*Data are interpolated. Source: Annual Reports UMHK – Main-d'oeuvre indigène.
Second, whereas the Belgian colonial state had a majority stake in the UMHK from its inception and continued to support the industry with recruitment services, infrastructural investments and various labour regulations (e.g., constraint on unionism), the Northern Rhodesian state operated at a larger distance to the mining sector. In fact, fearing the social consequences of African ‘detribalization’ (i.e., the severance of indigenous peoples from their tribal roots), the Northern Rhodesian colonial office opposed the idea of permanent settlement of mining workers in mining towns against the mining companies’ plea for extending the duration of labour contracts. While the patriarchal culture of Belgian colonial governance reserved a key role for Catholic missions in the provision of welfare services such as education and health care, in Northern Rhodesia the government only pressed for missionary access to the mining compounds after the Copperbelt riots of 1935. Yet, missionary infiltration was regarded with much suspicion by the managers of the Rhodesian mines (Parpart, Reference Parpart1983).
The third reason, to be further discussed in Section 6, relates to the different relations between black and white mining employees. There were more white employees involved in the Rhodesian copper mines, and they sought to defend their positions by guarding a tight application of the industrial ‘colour bar’. Skilled jobs, whether technical or managerial, remained the preserve of whites, a right that was defended by the white workers’ trade union. In the Belgian Congo, there was no effective European labour-union organization (Katzenellenbogen, Reference Katzenellenbogen, Duignan and Gann1975, p. 418),Footnote 11 and during the interwar period the minority of white employees was gradually replaced by black workers, who were much cheaper to employ. Especially during the depression of the 1930s, the need to cut production costs was acute. Increasing investments in African workers’ skills were an integral part of labour stabilization programs in Katanga, and these investments only paid off in a context of long-term, if not life-long, employment relations.
Table 4 shows how rapidly labour stabilization programs in Katanga materialized. After 1925, the ticket system that provided six months to one year contracts was replaced by three year contracts and the latter became mandatory in 1927. The three year contracts covered 98% of the labour force by 1931 (Berger, Reference Berger1974). Three years was considered sufficient to make African workers adapt to an industrial environment, to bring along their families and to loosen their ties with their home communities. The percentage of women living in the compounds rose from about a quarter to three quarters in less than three decades and the share of un-recruited workers rose even faster. As a result, labour turnover rates decreased and length of service increased. In 1938, 12% was engaged for ten years or longer and 65% for under three years. In 1950, 54.7% was engaged for over ten years and 23.9% for less than three years (Annual Reports of UMHK – Main-d'oeuvre indigène).
Stabilization measures also involved active support for marriage and child birth. The UMHK advanced money for a bride price to unmarried men upon signing a labour contract and paid bonuses for each new born child. Mothers and infants up to five were encouraged to visit the infant welfare clinic for medical checks, where they received ration tickets for milk, sugar and soap. When children went to school, from the age of five, they were provided three cooked meals per day at the messes. Rations were usually issued twice per week to the employees and wives received half the amount of their husbands, except when they were pregnant. As Table 5 illustrates, the investments in a new generation of mining employees by the UMHK quickly took effect.
Living conditions of indigenous labour at the UMHK in the 1920s

Source: 1930 Report of the Health Inspector of Northern Rhodesia on Native Labour in Katanga.
Education for boys and girls was provided mainly by Franciscan and Benedictine missions. The curriculum emphasised labour discipline and manual skills. There were apprenticeship departments and professional schools for talented boys from the age of 15, as well as domestic work for girls. As a compound manager of Roan Antelope (Mufulira Copper Mines Ltd.) wrote to the Native Labour Association in 1938,
in terms of welfare, Union Minière is undoubtedly ahead of us. Practically the whole work is carried out by the Roman Catholic priests and sisters [. . .]. Women and children at U.M. are treated as being the mine's strength and under their discipline and control. Schools are provided and women participate e.g. in horticulture. (ZCCM Archives, 10.7.10B)
Although Northern Rhodesian mines virtually banned forced labour recruitment in the 1930s, the welfare conditions in the compounds were, in most cases, poorer than in Katanga. Following the tax increase in the Copperbelt of 1935, riots broke out in which mine workers voiced their complaints about inadequate compensation for (lethal) accidents, inappropriate living conditions and insufficient rations, as well as the bad treatment by European supervisors and brutality of the African police force (Parpart, Reference Parpart1983, pp. 59–60).Footnote 12 During this outbreak of labour unrest six African protestors were killed by mining police troops. The colonial government responded by pushing for better welfare programs and by creating arrangements for missionaries to perform their charity work inside the compounds, a measure that was not well received by the employers.
The Northern Rhodesian mining companies hesitated to copy the labour stabilization programs of the Katangese mines, and instead looked at the model of the South African mining industry, which favoured a circular migrant labour force and a strict colour bar policy (Berger, Reference Berger1974). Rhodesian companies resented the costs of housing and feeding women and children when there was no pressing need to do so. The majority of Rhodesian miners used to combine several months of work in the mines with rural subsistence farming in their villages during agricultural high seasons. Yet, the events of 1935 also showed that not all dismissed workers had returned to their home villages, and that high unemployment rates in the mining towns were a potentially destabilizing factor.
In fear of African ‘detribalization’, the Northern Rhodesian government kept promoting circular migrant labour. Opposition to the permanent settlement of mine workers was also fed – in the same vein as in South Africa – by a lack of faith in a stable future of the copper industry, inducing risks of high structural urban unemployment and towering welfare expenses on disability, unemployment, retirement and wasteful urban administrations. Moreover, short-term labour contracts and the deferred payment system were thought to enhance economic growth in the rural areas, thus spreading the copper wealth into more sustainable sectors of the indigenous economy.
Labour stabilization thus developed more slowly in the Rhodesian Copperbelt than in Katanga, although the rapid expansion of copper production during the 1940s and the increasing technology and skill-intensity of mining operations made the extension of labour contracts desirable (Ferguson, Reference Ferguson1999). Technological advances and rising wage costs supported investments in labour-saving machinery and in complementary labour skills. In the meantime, the colonial office retained a legal restriction on the provision of housing and the right of residence to workers without a labour contract. Only after independence urban settlement of miners became truly permanent, including a pension-system that offered life-long income security.
Several reports comment upon the clashes between the government and the mining companies on the issue of labour stabilization from the 1940s. A 1942 report for the General Manager of Mufulira Mines Ltd. ‘Covering a wide and controversial number of subjects related to native labour’ stated that the deferred payment system gave workers the ‘wrong impression of the wage they received’ and that it reduced their purchasing power, because prices were higher in villages. Regarding ‘detribalization’ the report declared that urbanization was inevitable and not necessarily bad if there was sufficient work (ZCCM Archives, 10.7.10B).
A 1945 ‘memorandum on native labour’ by the managers of the four most important mines pleaded for a labour system that interchanged long-term labour contracts with long periods of leave to allow employees to go home. These home visits would facilitate the employee's return at the end of his working life and save the company the costs of retirement. The UMHK in the Congo had been paying nominal pensions of 50 francs per month since 1938, conditional upon the pensioners returning to their home villages and it was assumed that the burden of their subsistence requirements would be met by their farming relatives (Perrings, Reference Perrings1979, p. 240).
But labour stabilization was also desirable from the worker's point of view. In the 1940s, more and more workers preferred to stay in the mining towns instead of returning to the countryside. Parpart has argued that in search for European life styles, the wives of mine workers were keen to stay in the mining towns. Schooling for children provided by the United Missions in the Copperbelt (UMCB) since the late 1930s also made families more likely to stay. In the 1940s, over 90% of the students at UMCB schools had been there for over five years (Parpart, Reference Parpart1983, p. 89).
6. The industrial colour bar
The promotion of black workers to positions that used to be the preserve of white employees, was a contested issue everywhere, but colour bar policies appeared more flexible in the Belgian Congo than in Northern Rhodesia. Exchange rates may explain part of the difference. In 1919, when parity between the Congolese and the Belgian franc was introduced, the Belgian franc started losing value against the major currencies. The exchange rate of the franc against the sterling pound continued to drop between 1920 and 1925 (Perrings, Reference Perrings1979, p. 46). Most of the white skilled workers were paid in sterling, as were the indigenous workers from Northern Rhodesia and Nyasaland. This raised the incentives of the UMHK to replace white and ‘foreign’ African labour by the Congolese who were paid in francs – especially during the Great Depression – and stimulated the development of training programs in industrial and supervisory skills for indigenous employees.Footnote 13
Yet, the European electorates in Northern Rhodesia also had a strong desire to secure the system of race relations that prevailed in Southern Rhodesia and South Africa, even though the colonial government in Northern Rhodesia had formally abandoned the colour bar. During World War II, the white mining workers’ union, formed in 1936, demanded the implementation of the ‘colour bar clause’ that reigned in South Africa and Southern Rhodesia, which prohibited promotion of Africans to supervising or managerial positions. Although this clause was never adopted, the company's management took great care to secure ‘white’ jobs (Berger, Reference Berger1974).
The Rhodesian mining companies resented the colour bar because it raised labour costs and eventually also made it more difficult to attract African workers. The 1945 ‘memorandum on native labour’ stated that
A tendency still exists among Europeans to consider Africans as something sub-human that neither requires or is entitled to fair or reasonable treatment. Europeans of this class are definitely a menace in relation to African employees and should not be tolerated in an industry in which they are in close contact with Africans. People of such mentality can never make good “bosses”.
According to the authors of the memorandum the main reason for the persistent belief in the colour bar by white settlers was to safeguard the labour market prospects of their children, while in the Belgian Congo it was acknowledged that ‘an African is as good as a white man’. A Northern Rhodesian report of 1958 on the conditions of native labour in Katanga comments in the same vein that ‘the [UMHK] company recognises no colour bar whatsoever. Although no African has as yet been found fit to do the same work as the European supervisors, it is claimed that the Company would have no hesitation in appointing a suitable candidate’. The different application of the industrial colour bar was reflected in growing differences in the ratios of white to black workers at opposite sides of the border (see Table 6). In 1936, the white–black workers’ ratio in Katanga of around 1:20 was less than half of the Northern Rhodesian ratio of 1:8.
Share of white to black labour
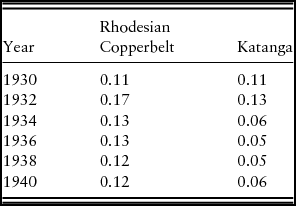
Source: Annual Reports UMHK – Main-d'oeuvre indigène and Perrings (Reference Perrings1979).
The different policies resulted in different income earning opportunities and occupational mobility of African labourers (see Table 7). InFootnote 14 Northern Rhodesia, the wage scheme for African employees was narrower, consisting of three wage scales (A, B and C) for surface and for underground labour. Grade A included all workers who had undergone some training, in highly responsible jobs and those literate in English (often ‘boss boys’ or ‘senior boss boys’). Grade B was an intermediate group with a certain amount of mechanical skills and knowledge, such as boss boys with blasting licenses, second-grade artisans or clerks, police and others. Grade C covered unskilled labour. Salaries increased with length of service. The maximum skill premium (including experience, not only training) defined as the ratio between the highest and lowest paid African worker in an underground mine was around 5.3: 80s for grade A workers, after 72 completed tickets, versus 15s for grade C worker at his first ticket. In 1948, a more elaborate system of seven wage scales was adopted to raise the premium for skilled black workers and create a special scheme for surface employees and underground workers. The number of wage scales was expanded steadily to 12 until 1955. Also, a portion of the African workforce was paid monthly instead of in tickets after 1954.
Wage range by time period, minimum and maximum wage in Katanga and the Rhodesian Copperbelt

Sources: Annual Reports UMHK – Main-d'oeuvre indigène, Northern Rhodesia's Chamber of Mines Year Books, and Perrings (Reference Perrings1979).
Wage mobility in the UMHK mines was larger. In Katanga, already in 1913, the wage structure was amplified from the standard rate for indigenous to a scaled wage structure with six grades: (1) underground, (2) surface, (3) pick and shovel men and those in the brickyards, (4) agricultural workers, (5) porters and (6) unskilled labour. The three mining grades were at the top of the wage scale varying between 15 francs (11/8 s.) and 30 francs (23/6 s.) (Perrings, Reference Perrings1979). In 1928, the UMHK adopted a more complex wage structure under which the wage for each category was raised according to proficiency and length of service. To support labour stabilization, starting rates were higher if workers engaged for longer periods. For voluntary mining workers, there were five classes and the cash wage rate ranged from 2.50 francs (maximum) for the 5th (lowest) class, first term, to 25 francs for the 1st class with 72 or more months of service, which gives a skill premium of 10. Voluntary workers were paid higher wages than recruits because of direct competition with the mines across the border. For recruited labour, the possibilities to ascend were lower. Recruits from Ruanda-Urundi earned between 1.50 francs in the first term when contracting for one year, and 3.00 francs after 30 months, when engaging for two years (see Perrings, Reference Perrings1979, p. 264).
7. Conclusion
This paper has shown how both coercion and compensation of African labour were integral elements of the institutional responses to labour scarcity in the Central African Copperbelt. We have also explored how and why these responses varied across the borders of Northern Rhodesia and the Belgian Congo. Confronted with endemic shortages of mining labour, the UMHK made more extensive use of both carrot and stick. The UMHK continued to recruit labour up to 1960, receiving continued support from the colonial government, while the Rhodesian mines relied on voluntary migrant workers, most of whom were circular migrants. Within the mining compounds, the UMHK offered living conditions that were suited to stabilize the mining workforce, invest in their health, education, housing conditions, skills and in their offspring. African workers in the Katangese mines were also granted more opportunities of promotion. Living conditions in the Rhodesian mining compounds also improved, but welfare policies were less systematic and less coordinated. These differences can be attributed to a wholehearted embracement of labour stabilization programs in the Belgian Congo, as opposed to a more contested and hesitant adoption of stabilization policies in Northern Rhodesia.
Our comparative real wage series have shown that the compensation levels of African copper mine workers rose impressively as coercive labour recruitment practices were replaced by voluntary migration and stabilized workforces. There were hardly any differences in remuneration levels between mines in Katanga and Northern Rhodesia, although the latter tended to pay higher amounts in cash, while the former offered higher rations. The similarity in real wage levels was the result of a mutual agreement to moderate competition for wage workers in an era where labour coercion gradually gave way to labour compensation. Yet, the quality of other welfare facilities such as medical care, schooling and housing was considerably higher in Katangese mines than in most Rhodesian mines.
The Congolese mining industry adopted a more ‘paternalistic’ management style, reflected amongst others in the close cooperation with Catholic missionaries who assisted in the provision of education and health care. The UMHK remained a state-owned company during colonial times, whereas private companies dominated the copper industry in Northern Rhodesia. In Katanga, extensive medical and schooling services were co-financed by the colonial state. Conflicts of interest between the colonial state and private companies in Northern Rhodesia revolved around labour stabilization, the colour bar and the presence of missionaries at mining compounds. White and black trade unions were absent in the Belgian Congo until after WWII, and their influence as well as workers’ affiliations to them remained moderate. In Northern Rhodesia, white labour unions for a long time prevented the advancements of Africans into higher ranks. Ironically, those trade unions also set an example for the creation and functioning of the Northern Rhodesian African Mineworkers’ Union, which managed to negotiate some substantial improvements in working conditions in the late colonial era.
Historical developments often produce this type of dialectics. This is one of the main reasons why colonial institutions are difficult to cast in comparative static approaches. The history of labour recruitment and labour relations in the Copperbelt thus illustrates the need for dynamic conceptualizations of colonial institutional development and a departure from binary dichotomies between extractive and inclusive institutions.
Acknowledgements
For their comments on earlier drafts of this paper, we would like to thank the participants of the 10th New Frontiers in African Economic History Workshop, participants of the Utrecht Economic and Social History Group Seminar, Jan Luiten van Zanden, Gareth Austin, Duncan Money and Elise van Nederveen Meerkerk. We also acknowledge financial support from the Netherlands Organisation for Scientific Research for the project ‘Is Poverty Destiny? Exploring Long Term Changes in African Living Standards in Global Perspective’ (NWO VIDI Grant no. 016.124.307).
Appendix A
Barebones subsistence basket for a family of two adults and two children

Appendix B
Yearly family food basket and nutrients per day in 1925, provided by Union Minière du Haut Katanga

Yearly family food basket and nutrients per day in 1956, Northern Rhodesia
Appendix C: Data Sources
Wage Data for Katanga: Annual Reports of UMHK Native Labour Department (Main-d'oeuvre indigène) 1920–1965.
Price data for Katanga: Annual Reports of UMHK Native Labour Department 1920–1965, Annuaires Statistiques de la Belgique et du Congo Belge.
Maize: Annual Reports of UMHK Native Labour Department.
Meat: Annual Reports of UMHK Native Labour Department.
Palm Oil: Annual Reports of UMHK Native Labour Department.
Salt: Annual Reports of UMHK Native Labour Department.
Cotton cloth: 5% of total cost of subsistence basket.
Soap: Congolese Import Statistics (Annuaires Statistiques de la Belgique et du Congo Belge) plus 20% of its value; other, 2.5% of total cost of subsistence basket.
Kerosene: Congolese Import Statistics (Annuaires Statistiques de la Belgique et du Congo Belge) plus 20% of its value for selected years; other, 2.5% of total cost of subsistence basket.
Candles: 2.5% of total cost of subsistence basket.
Charcoal: provided for free by UMHK.
Wage data for the Rhodesian Copperbelt: Official report on the mine of Mufulira (1930-1949); Year Books of Northern Rhodesia's Chamber of Mines (1950 to 1960).
Price data for Rhodesian Copperbelt: Colonial Blue Books of Northern Rhodesia, which are retail prices for Livingstone (1929 to 1948) (TNA CO100/30-96).
Maize: Colonial Blue Books (1929 to 1948), 1955 report on costs of living by Mufulira Mining Ltd.
Meat: Colonial Blue Books (1929 to 1948), 1955 report on costs of living by Mufulira Mining Ltd.
Palm Oil: British trade statistics, average export price of colonies in Africa, minus 20% margin.
Salt: Colonial Blue Books (1929 to 1948), 1955 report on costs of living by Mufulira Mining Ltd.
Cotton Cloth: British African import prices reported in British trade statistics, plus 20% margin.
Soap: Colonial Blue Books (1929 to 1948), 1955 extrapolated.
Kerosene: Colonial Blue Books (1929 to 1948), 1955 report on costs of living by Mufulira Mining Ltd.
Candles: 2.5% of total cost of subsistence basket.
Charcoal: 7.5% of total cost of subsistence basket.



