The diagnosis of bipolar disorder in children and adolescents remains controversial. Clinical investigators such as Kraepelin observed the onset of manic depression in adolescents and occasionally even in childhood (Kraepelin, 1921). Case reports of pediatric mania have been documented back as far as the 1800s (Greves, 1884), and possibly even earlier (Glovinsky, 2002); and sporadic case reports have been published in the last 30 years. However, the conventional wisdom has long been that bipolar disorder is primarily a disorder with adult onset, occurring only rarely if at all before late adolescence. Epidemiological studies have found few (Lewinsohn, Klein, & Seeley, 1995) or no cases (Costello et al., 1996) of bipolar disorder in adolescents or preadolescents, and before the 1980s the condition was rarely diagnosed or treated clinically in youths (Carlson & Strober, 1978; Davis, 1979; Kasanin, 1931; Weinberg & Brumback, 1976).
The situation has changed dramatically in the last 10 years. There has been a rapid increase in the rate at which bipolar disorder is diagnosed in children. Marketing research indicated in 2001 that approximately 95,000 children and adolescents were already being medicated for bipolar disorder in the United States (Hellander, 2002), and service utilization records indicated that 11% of youths who were county wards in the state of Illinois were being treated for bipolar disorder in 2001, a 250% increase from the rate in 1994 in the same state (Naylor, Anderson, Kruesi, & Stoewe, 2002). There has also been a sharp rise in the number of popular articles (e.g., Kluger & Song, 2002) and books (e.g., Papolos & Papolos, 2002) in the past decade, along with an increase in the number of scholarly publications (see Lofthouse & Fristad, 2004, for a review).
The change in the clinical rate of diagnosis is too large to be driven primarily by changes in gene prevalence or activity, and changes in environmental risk factors could not account for the incidence more than tripling over the course of a decade. Instead, there clearly have been major changes in mental health practice, with a greater willingness to look for bipolar disorder and to identify it in childhood and early adolescence. Unfortunately, it is unclear whether the surge in diagnosis reflects the accurate recognition of a condition previously often missed, as was the case with unipolar depression prior to the 1980s (Kovacs, 1989). The concern is that the “bipolar” label often might be inappropriately applied to youths whose emotional and behavioral issues might actually not be a manifestation of the same illness connoted by that label in adults. The concern that the same label might be capturing different conditions in childhood versus adulthood has been heightened by discussions of perceived differences in the phenomenology, comorbidity, and course of bipolar disorder in pediatric versus adult samples (Biederman, Klein, Pine, & Klein, 1998; Carlson, 2002; Klein, Pine, & Klein, 1998). Adding to the complexity is the fact that different research groups have used various different diagnostic interviews, different conceptualizations of the disorder, and different ascertainment patterns and inclusion or exclusion criteria to define their samples (Biederman et al., 1995; Geller & Luby, 1997; Leibenluft, Charney, Towbin, Bhangoo, & Pine, 2003). Not only do these definitions often differ in potentially important respects from the DSM-IV criteria (American Psychiatric Association, 2001), but they also are different than the definitions employed by most practicing clinicians (Papolos & Papolos, 2002).
The goal of this paper is to review the program of research focusing on investigating different methods of assessing bipolar disorder in children and adolescents. This research has attempted to identify developmental continuities and discontinuities by starting with diagnostic criteria and instrumentation initially developed for adults with bipolar disorder and examining their performance when applied to younger samples. The drawback of this methodology is that it does not make accommodations for the developmental appropriateness of item content, particularly with questionnaires (Geller et al., 2002). Conversely, the advantage is that different age groups are being measured against the same yardstick, making it clear when there are dissimilarities in symptom rates or other aspects of phenomenology. Recent research on evidence-based models of assessment of pediatric bipolar disorder also relies heavily on statistical methods drawn from signal detection theory (Swets, Dawes, & Monahan, 2000), the evaluation of medical tests (Kraemer, 1992), and evidence-based medicine (Guyatt & Rennie, 2002; Sackett, Straus, Richardson, Rosenberg, & Haynes, 2000). This particular review places assessment research in a larger context of the central issues pertaining to the assessment and diagnosis of pediatric bipolar disorder. The review also seeks to find points of connection and contrast with other published research. Another overarching goal is to candidly reflect on some of the methodological limitations of the research to date, and to identify directions for future research.
This review addresses the following themes:
- What are the benefits and costs of involving clinical judgment in the diagnostic process, particularly with regard to diagnosis and mood severity ratings?
- How valid are parent, teacher, and youth self-report of manic symptoms?
- How much cross-situational consistency is typically shown in mood and behavior?
- To what extent does a parent's mental health status influence their report of child behavior?
- How do different measures compare in terms of detecting bipolar disorder? What are the challenges in comparing the performance of measures across research groups? Are there leading candidates for research or clinical use?
- What are the evidence-based strategies for interpreting measures as diagnostic aids?
- How will test performance change when a test is used in a new setting and what implications will this have for research samples as well as clinical practice?
- What is the role of family history of mood disorder within an assessment framework?
- What are the implications of assessment research for the understanding of phenomenology of bipolar disorder from a developmental framework?
The Benefits and Costs of Involving Clinical Judgment in the Diagnostic Process, Particularly With Regard to Diagnosis and Mood Severity Ratings
Clinician ratings play a central role in research on bipolar disorder. Research diagnoses are typically made via a semistructured diagnostic interview (Fristad, Teare, Weller, Weller, & Salmon, 1998; Geller et al., 2001; Kaufman et al., 1997; Orvaschel, 1995), which provides more latitude for clinical judgment than is allowed in more structured interviews. Clinician ratings of the severity of depressed (Poznanski, Miller, Salguero, & Kelsh, 1984) and manic symptoms (Axelson et al., 2003; Fristad, Weller, & Weller, 1992, 1995; Young, Biggs, Ziegler, & Meyer, 1978) are also central to characterizing the phenomenology of cases and to measuring treatment outcomes. The arguments in favor of emphasizing clinician ratings focus on the improved validity of the ratings. Mood disturbances in youths can be difficult to differentiate from symptoms of other conditions (Bowring & Kovacs, 1992; Kim & Miklowitz, 2002), and clinical judgment might help in teasing these components apart. Clinical judgment also could play a role in discerning whether a behavior is developmentally “within normal limits.” Similarly, raters are often in a position to gauge whether an adult is overreporting symptoms, pathologizing developmentally appropriate behaviors, or offering naïve responses to questions about clinical behaviors (see Drotar, Stein, & Perrin, 1995, for a discussion of the role of follow-up clinical probing in scoring responses on checklists).
These potential benefits are offset to some degree by increases in cost and decreases in the interrater reliability of instruments. Semistructured interviews are more expensive because they require the use of staff to conduct the interview, whereas parents and teenagers are often able to complete rating scales independently. The cost also rises because the flexibility in interview structure and scoring requires increased training if the procedures are to be done with adequate interrater reliability, and it also becomes more important to add mechanisms to prevent rater drift. The best-validated semistructured interviews also add considerably to the length of time required for the interview, with sequential interviews of the parent and youth resulting in total interview times in the range of 1.5 to 6 hr (Geller et al., 2001; Kaufman et al., 1997).
A less discussed, but more pernicious, problem is that raters might use different anchors for ratings in a way that makes direct comparisons across sites or groups much more difficult to interpret. Anchoring effects could occur either because of formal differences in the implementation of the rating system, or because of differences in the range of behavior that raters encounter in a given setting (Epley & Gilovich, 2004). One example of differences in anchoring comes from the way that the Kiddie Schedule for Affective Disorders and Schizophrenia (K-SADS; Geller et al., 2001; Kaufman et al., 1997) interview is rated across sites. Geller et al. (2002) provide thorough descriptions of clinical presentations and how they were scored. This level of detail helps calibrate ratings across sites, and illuminates potential methodological differences that may drive apparent differences in findings. For instance, consider a vignette of an adolescent female telling a school principal to go “screw himself.” Some groups would most likely consider this an example of irritable mood, and more context would be needed to determine whether this would be scored in the depression, mania, or some other section of the K-SADS. According to Geller et al. (2002), raters adequately trained in the use of the Washington University (WASH-U)-K-SADS would consider the vignette as evidence of irritable mood, but also consider it evidence of hypersexuality, because the profanity contained sexual terminology. Further, the WASH-U-K-SADS guidelines specify that this vignette exemplifies severe grandiosity, because the behavior shows a loss of contact with the reality that there would be consequences for insulting a school principal. It also is noteworthy that the WASH-U algorithms consider severe grandiosity or severe elated mood (scores of 5 or 6 on the WASH-U-K-SADS) to be evidence of psychosis due to the loss of contact with reality. Thus, this vignette would potentially be considered psychotic behavior in one study, but not in another. The differences in anchors make it easier for a behavior to be considered “threshold” or “severe,” and also make it easier to be considered psychotic. The WASH-U algorithm also provides more gateways into being labeled “psychotic” than are being used by some other groups. It is not clear without external validators that particular set of anchors or scoring algorithm is better. Clearly, one strategy will be more sensitive to mania and psychosis, and the other will be more specific, at the possible cost of missing bipolar cases. However, these methodological differences clearly help understand how groups are documenting markedly different rates of particular symptoms or psychosis (Kowatch, Youngstrom, Danielyan, & Findling, 2005).
Data from the Young Mania Rating Scale (YMRS; Young, Biggs, Ziegler, & Meyer, 1978), the most widely used clinical rating scale for the severity of manic symptoms, also provide an instructive example of how differences in setting and modal clinical presentations may contribute to anchoring effects. Ten sites provided YMRS data from youths with research diagnoses of bipolar spectrum disorders (aggregate N = 824 bipolar spectrum cases; Youngstrom, Findling, Sachs, et al., 2003). The average scores for bipolar cases differed significantly across sites, F (9, 776) = 30.39, p < .00005, with site means ranging from 10.0 to 34.5. Counterintuitively, the average YMRS score from the inpatient unit was among the lower means (17.2), and the three highest averages all came from outpatient settings (all three means greater than 32.0). Furthermore, there were Site × Item interactions, indicating that that there were differences either in the clinical presentation of bipolar cases, or else differences in the way that raters were scoring items at different sites, F (90, 5212) = 25.62, p < .00005. Overall, site differences accounted for 15% of the variance in YMRS scores, representing a medium to large effect size. Both the fact that there were significant differences in item scoring and the relative ranking of the site averages suggest that anchoring effects may play a large role in determining clinical ratings of mania.
Some of these differences in ratings across sites may be due to the use of different algorithms for generating a summary score when clinical raters are confronted with inconsistent data from the parent versus the child. Changes in the scoring algorithm could have substantial effects on final scores, and lead directly to shifts in diagnostic sensitivity and specificity. Taking the higher score (a “disjunctive” strategy) maximizes sensitivity (i.e., the percentage of true bipolar cases correctly identified) but penalizes specificity (i.e., the percentage of nonbipolar cases correctly identified; Youngstrom, Findling, & Calabrese, 2003). Multiple groups have experimented with a “structured” YMRS that used clearer scoring guidelines and more detailed anchors in an effort to improve interrater reliability. Structured YMRS ratings were consistently higher than typical YMRS ratings, even when both sets of ratings were completed by the same raters. Clinical judgment aims to improve the validity of the decision, but typically involves a reduction in the interrater reliability of scoring decisions that sets an upper limit on the potential validity of the resulting scores. Research groups have made different choices in terms of how to integrate data from multiple informants. Some have tended to interpret the higher score as being accurate (Tillman et al., 2004) or at least generally more clinically valid (Fristad et al., 1998); others have tended to use an average of the scores, and yet other groups have placed more emphasis on clinical judgment resolving each discrepancy separately (Findling et al., 2001; Youngstrom, Meyers, et al., 2005). In many published studies, the method used to resolve discrepancies is not specified.
Implications
Based on the available evidence, clinical ratings probably remain a necessary but not sufficient component of the assessment of pediatric bipolar disease (PBD). Clinical ratings have the potential to disentangle which behaviors are attributable to mood disorder versus other contributing factors in a way that simple checklists cannot, but often clinical presentations remain ambiguous. The more that clinical ratings rely on judgment, the wider the lid opens for a Pandora's box of issues including the different interpretation of anchors, anchoring effects due to differences in setting, and changes in algorithm further magnifying apparent discrepancies across sites. The pattern of findings strongly suggests that one should not put great faith in common rules of thumb when applied to these instruments, such as a YMRS score of 13, indicating hypomania, or a 16, indicating moderate mania. Although these benchmarks are widely employed in treatment studies, it is clear that any particular threshold is likely to connote highly variable amounts of extremity and impairment across sites. Findings also support the wisdom of the recent recommendation that researchers continue to use the Child Behavior Checklist (CBCL) or some other parent and self-report measures as a way of gathering standardized information using a consistent methodology that does not introduce the potential for differences in clinical judgment (Nottelmann et al., 2001).
Differences in methodology and clinician ratings are also important to bear in mind when considering the rates of bipolar disorder reported internationally. PBD is much less commonly diagnosed in Europe, India, Australia, and South American (Hazell, Lewin, & Carr, 1999; Soutullo et al., 2005; Tramontina, Schmitz, Polanczyk, & Rohde, 2003) than in the United States. Some of the difference is probably attributable to variations in clinical ratings. It is possible that there also are differences in the age of onset of bipolar disorder across countries. Recent work shows that the age of onset is significantly earlier in the United States than Europe, and the earlier onset is also associated with significantly more exposure to risk factors in the United States (e.g., higher rates of familial mood disorder, higher familial rates of completed suicide, greater comorbidity, and more frequent physical and sexual abuse; Post et al., 2006).
The Validity of Parent, Teacher, and Youth Self-Report of Manic Symptoms
Although it is a truism in child assessment that assessors should gather data from multiple informants (Sattler, 1998), there has been much debate about the relative value of parent, teacher, and youth report of hypomanic and manic symptoms. It has been uncertain who might be the optimal informant with regard to mania, and also who might be sufficiently accurate to provide reliable diagnostic information by themselves. This is a central question, because some research has relied entirely on adolescent self-report to establish diagnoses (Lewinsohn, Klein, & Seeley, 1995; Teplin, Abram, McClelland, Dulcan, & Mericle, 2002), whereas other investigations have relied almost entirely on parent report, especially in prepubertal children (Wozniak et al., 1995). Those who incorporate both parent and child interviews into the diagnostic process have also used different algorithms for resolving discrepancies, such as consistently taking the more severe score as the summary score, regardless of source (Geller et al., 2001), versus relying on best clinical judgment or discussion with both informants to achieve consensus (Findling et al., 2001). If there are differences in the sensitivity of parents, teachers, or youths to mania, then this will result in differences in the rate of cases identified, and it could also generate differences in apparent clinical features of the condition. Teacher ratings have also featured prominently in discussions of the validity of the PBD diagnosis: there have been discussions about whether revised diagnostic criteria should require demonstration of impairment in multiple settings before making a diagnosis of mania, versus parent report being sufficient to establish a diagnosis even in the absence of corroborating information (Carlson & Youngstrom, 2003; Leibenluft et al., 2003).
What is necessary to evaluate the relative validity of different informants would be a design where they report on similar behaviors and are evaluated against the same diagnostic criterion (cf. Richters, 1992). The Achenbach System of Empirically Based Assessment (Achenbach, 1991a, 1991b, 1991c) offers an opportunity to compare parent, teacher and youth impressions, because eight of the core syndrome scales and 89 of 118 behavior problem items are identical across all three versions. The CBCL has been the most widely used parent-reported scale in research in PBD to date, with published results from at least eight different research groups on three continents (Hazell et al., 1999; Kahana, Youngstrom, Findling, & Calabrese, 2003; Mick, Biederman, Pandina, & Faraone, 2003, provides a meta-analysis of prior studies; Tramontina et al., 2003). However, fewer studies have reported teacher report on the Teacher Report Form (TRF) in the same sample (Carlson, Loney, Salisbury, & Volpe, 1998; Geller, Warner, Williams, & Zimerman, 1998; Hazell et al., 1999; Kahana et al., 2003; Youngstrom, Findling, Calabrese, Gracious, et al., 2004), and yet fewer have included youth self-report data from the Youth Self-Report (YSR) Form (Hazell et al., 1999; Kahana et al., 2003; Youngstrom, Findling, Calabrese, Gracious, et al., 2004).
What consistently emerges from these articles is that parent CBCLs show elevations on multiple scales, and that the magnitudes of these elevations compared to the scores of youths diagnosed with other disorders (most typically attention-deficit/hyperactivity disorder [ADHD]) are larger based on parent report as opposed to teacher report or self-report. YSR scores did not differ significantly between bipolar and ADHD cases in one sample (Hazell et al., 1999), and failed to show any incremental predictive value after controlling for parent CBCL in another sample (Kahana et al., 2003). Thus, effect sizes for bipolar versus nonbipolar comparisons consistently appear to be smallest for self-report on the YSR, and largest on the CBCL.
To compare the diagnostic value of each potential informant directly, Youngstrom, Findling, Calabrese, Gracious, et al. (2004) compared parent, teacher, and youth report on six measures in a sample of 324 youths ages 11 years 0 months to 17 years 11 months. The measures included the parent, teacher, and youth versions of the Achenbach, parent report on the General Behavior Inventory (PGBI; Youngstrom, Findling, Danielson, & Calabrese, 2001), parent report on a questionnaire version of the YMRS (P-YMRS; Gracious, Youngstrom, Findling, & Calabrese, 2002; Youngstrom, Gracious, Danielson, Findling, & Calabrese, 2003), and adolescent self-report on the GBI (Danielson, Youngstrom, Findling, & Calabrese, 2003; Reichart et al., 2004). The same publication also presented a comparison of parent and teacher ratings in a younger sample using the same instruments, with 318 youths ages 5 years 0 months to 10 years 11 months old. The criterion diagnoses were based on a K-SADS with sequential interviews of the parent and child by the same rater, and with discrepancies resolved using best clinical judgment. All cases were reviewed with a licensed medical doctor clinician before final diagnoses were assigned, and more than 60% of the cases were subsequently reinterviewed by a medical doctor before continuing into other research protocols.
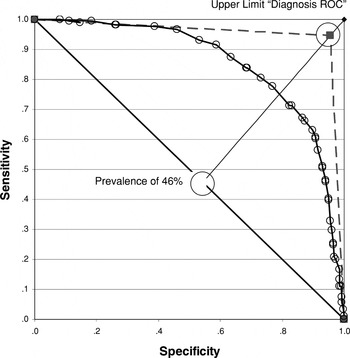
The diagnostic efficiency of each test was quantified using receiver operating characteristic (ROC) analyses (Figure 1), which examine the trade-off between diagnostic sensitivity and specificity across the full range of test scores, captured by the area under the curve (AUC) statistic (Kraemer, 1992).

A receiver operating characteristic (ROC) plot of the diagnostic efficiency of a 10-item PGBI discriminating any bipolar spectrum diagnosis (n = 291) from all other diagnoses (n = 346). The dashed line represents the threshold imposed by the criterion diagnosis having a kappa reliability of .90.
In the adolescent sample, the three parent report measures all performed significantly better than the teacher or youth report. On the Achenbach instruments, the parent CBCL Externalizing score earned an AUC of .78, the PGBI hypomanic/biphasic score earned an AUC of .84, and the P-YMRS earned an AUC of .80. The TRF fared significantly worse than all three parent measures (p < .005), with an AUC of .70. The adolescent self-report on both measures was comparable to the diagnostic validity of teacher report on the TRF, with AUCs of .71 on the YSR and .67 on the GBI; thus, youth report was also significantly worse than parent report in discriminating bipolar cases.
In the younger sample, the three parent measures performed similarly well. The CBCL Externalizing had an AUC of .82, the PGBI an AUC of .81, and the P-YMRS an AUC of .83 (95% confidence intervals = 9–12%). The TRF not only performed significantly worse than any of the parent measures, but it also did not succeed in discriminating bipolar cases significantly better than at a chance level, with an AUC of .57. Neither youth nor teacher report helped identify additional cases with bipolar disorder in either age group after controlling for parent report on any of the measures.
The better performance of parent report versus youth report on the GBI has been replicated in a new sample, with many of the participants drawn from an urban community mental health center (Youngstrom, Meyers, et al., 2005). Furthermore, in the new sample parent report outperformed YSR on a two other measures, the Mood Disorder Questionnaire (MDQ; Hirschfeld et al., 2000), and a self-report version of the YMRS adapted for comparison to the P-YMRS. In the sample of 124 adolescents, the PGBI had an AUC of .80 versus .65 for adolescent self-report; the Parent MDQ (P-MDQ) had an AUC of .75 versus .63 for self-report, and the P-YMRS had an AUC of .70 versus .50 for self-report. In each instance, the parent report provided statistically significant classification superiority.
These results are consistent with prior findings that PBD elevates the parent report more than the teacher or youth report (Carlson et al., 1998; Geller et al., 1998; Hazell et al., 1999), but the findings sharply contradict the prevailing clinical wisdom that assessments should rely on self-report for information about mood disorders (Loeber, Green, & Lahey, 1990). The advantage of relying on parent report becomes even larger when using measures that concentrate on symptoms of mania: The CBCL and YSR AUCs differed by .07, but the measures including more manic symptoms yield differences of .12 to .20 in performance. Several factors are likely to be operating here. One is that manic symptoms tend to manifest as externalizing behavior problems, which are readily observed and reported by collateral informants (Youngstrom, Loeber, & Stouthamer-Loeber, 2000). Another is that lack of insight into one's behavior is an associated feature of mania (Dell'Osso et al., 2002; Pini, Dell'Osso, & Amador, 2001), with self-report of manic symptoms having less validity as a consequence (Ghaemi et al., 2005; Miller, Klugman, Berv, Rosenquist, & Ghaemi, 2004; Youngstrom, Findling, & Calabrese, 2004).
Implications
At least in terms of identifying cases of bipolar disorder, the parent report appears to be the most valid source of information. This finding holds true in multiple samples and across several different measures, suggesting that it is a general trend and not an artifact of a particular sample or instrument. The relative validity of parent report becomes even greater when instruments include more content pertaining to manic symptoms. It is possible that teachers would provide more useful information about bipolar illness if they were asked directly about manic symptoms. There are studies providing circumstantial evidence that the teacher report of manic symptoms has validity at least in terms of predicting greater impairment (Carlson & Youngstrom, 2003; Thuppal, Carlson, Sprafkin, & Gadow, 2002), but these measures have not been formally evaluated in terms of diagnostic efficiency yet. Findings suggest that a parent or similar adult familiar with the youth should routinely be involved in the assessment process whenever bipolar disorder is a potential concern. These results also raise the possibility that studies relying primarily on the self-report of manic symptoms may be less sensitive to identifying cases of bipolar disorder and may also underestimate the severity of manic symptoms.
How Much Cross-Situational Consistency Is Typically Shown in Mood and Behavior?
An important and highly controversial issue is how much agreement should be expected between parents, youths, and other informants such as teachers about manic symptoms. A frequent clinical presentation involves a highly distressed and concerned parent, along with a youth and teacher who report few if any of the same concerns. This constellation of opinions might reflect greater sensitivity to the symptoms of mania by parents, or possibly that the problems associated with mania are sometimes limited to the home environment; or that the parent's perceptions are inaccurate and exaggerated. There are mechanisms that could explain distorted parent report, including the effects of the parent's own distress or mood disorder on their ratings of child behavior (Richters, 1992; Youngstrom, 1999; Youngstrom et al., 2000), or the recent popularity of the bipolar diagnosis causing parents to interpret behaviors as evidence of mania instead of other more common processes. A consistent finding has been that when parent data are compared to youth or teacher data on a similar instrument, levels of parent-endorsed mania, and other behavior problems are significantly higher than the levels reported by the youth or teacher (e.g., Carlson & Youngstrom, 2003; Findling et al., 2002; Geller et al., 1998; Hazell et al., 1999; Youngstrom, Findling, Calabrese, Gracious, et al., 2004), corroborating the clinical impression that parents are often the most worried about mania as well as other aspects of their child's functioning. Some suggest that future revisions of diagnostic criteria go so far as to stipulate that manic symptoms must be evident in multiple settings before considering a diagnosis of bipolar disorder, especially in a child (see Leibenluft et al., 2003, for discussion of narrow versus broad definitions of PBD).
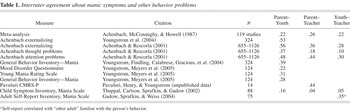
When judging the degree of agreement between parent report and other informants' descriptions of manic symptomatology, it is vital to bear in mind the general level of agreement between different informants about child behavior. The average level of youth, teacher, and parent agreement is modest about behavior problems in general. An early meta-analysis found that youths agreed with adult informants r = .22 on average, and parents and teachers agreed r = .28 with each other (Achenbach, McConaughy, & Howell, 1987). Data from standardization samples typically indicates moderately higher levels of agreement, such as the correlations from the restandardization of the Achenbach instruments (see table 9-3 of Achenbach & Rescorla, 2001). Table 1 reports these benchmarks as well as parent–youth agreement about manic symptoms based on multiple independent samples (Youngstrom et al., 2004; Youngstrom, Findling, Calabrese, Gracious, et al., in press). Results indicate that parent–youth agreement about manic symptoms is somewhat lower than agreement about externalizing problems (which was r = .53 on the Achenbach scale in the Youngstrom, Findling, Calabrese, Gracious, et al., 2004, sample), but well within the range of agreement reported about other dimensions and measures.
Interrater agreement about manic symptoms and other behavior problems

Referral patterns and regression artifacts
It is the rare child or teenager that self-refers for mental health services, with the possible exception of school-based mental health services. Typically, the youths presenting at outpatient mental health centers arrive because parents are concerned about their behavior or functioning. Overall, there is surprisingly little agreement between the parent and youth about which (if any) behaviors are cause for concern (Yeh & Weisz, 2001).
The fact that outpatient referrals are most often driven by parental concerns, combined with the modest to moderate levels of agreement between informants about youth functioning, sets up a situation that has profound implications for clinical presentation. Essentially, outpatient clinics are selecting for high levels of parent reported problems: if the parent is not worried, they will not bring the youth to the clinic. When referrals are driven by one source, the predicted levels of symptoms reported by other sources can be established via simple regression equations. If parent-reported externalizing problems are extremely high, for example, then self-reported levels of externalizing should be higher than average, but also lower than the level of parent-reported problems, based on the imperfect correlation of parent and youth report (Campbell & Kenny, 1999).
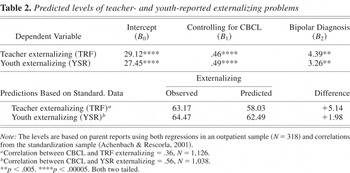
The standardization sample of the Achenbach measures (Achenbach & Rescorla, 2001) provides benchmarks for the degree of anticipated agreement between parents, teachers, and youths on the Achenbach forms. Two previously unpublished sets of different analyses indicate that the level of externalizing problems reported by teachers and youths in cases with K-SADS diagnoses of bipolar disorder are actually significantly higher than would be expected based on the typical correlation found across informants. One analysis (Table 2) used the cross-informant correlations from the standardization sample to predict the average TRF externalizing and YSR externalizing scores based on the level of CBCL externalizing scores in the bipolar cases. These analyses showed that the youth self-reported levels of externalizing problems were two points higher than would be predicted based on the level of parent-reported problems, and teacher-reported problems were 5 points higher than would be expected based on parent report alone.
Predicted levels of teacher- and youth-reported externalizing problems

The second set of analyses investigated whether K-SADS bipolar cases had significantly more youth- or teacher-reported problems after statistically controlling for parental concerns. These analyses regressed teacher or youth report of externalizing on diagnosis (bipolar spectrum, yes or no) after controlling for CBCL externalizing (using the data described in Youngstrom, Findling, Calabrese, Gracious, et al., 2004). Findings again showed that cases with K-SADS bipolar diagnoses evinced higher levels of both self-reported (+3.3 points, p < .01) and teacher-reported (+4.4 points, p < .01) externalizing problems. Both sets of analyses strongly indicate that the level of impairment (measured as externalizing problems) shown by cases with K-SADS diagnoses of bipolar disorder are actually significantly higher than would be expected based on the level of parent-reported problems alone.
Implications
Overall, cross-informant agreement about manic symptoms appears to be well within the range of levels of agreement typically found between parents, youths, and teachers. At present, much less data are available about teacher report of manic symptoms in youths, or reports of manic symptoms on rating scales completed by significant others such as roommates or spouses in adults. Based on the evidence reported earlier that collateral informants are more valid reporters of manic symptoms than are the affected persons themselves (cf. Altman, 1998), future research should evaluate multiple informants' reports of manic symptoms.
Because referrals to outpatient clinics are usually driven by requests from worried parents, it is generally true that average scores on parent measures are higher than self-report or teacher-reported scores on similar measures. This pattern is not necessarily due to parents having higher levels of concern overall (cf. Achenbach & Rescorla, 2001, where comparisons of raw scale scores often indicate higher levels of youth-reported internalizing problems, and teacher-reported attention problems), but rather because cases with high levels of youth or teacher-reported concerns are relatively less likely to present to a clinical or research infrastructure than are youths with comparable levels of parent-reported problems. Indeed, after controlling for the level of parent-reported externalizing problems, youths with bipolar diagnoses show significantly higher levels of self- and teacher-reported externalizing problems than would be expected. These findings not only provide evidence of cross-situational impairment, but they flatly contradict the perception that parental concerns are typically exaggerated. If anything, parental concerns about manic behavior appear to have greater than typical validity, not less.
The Extent to Which a Parents' Mental Health Status Influences Their Report of Child Behavior
Perhaps the most vexing concern about relying on parent report of youth mood symptoms is the possibility that the parent's mental health history (Youngstrom et al., 2000) or current mood status (Youngstrom, Ackerman, & Izard, 1999) might influence their description of child functioning. The issue is especially pernicious given the high degree of heritability of bipolar disorder (McGuffin et al., 2003). As a consequence, parent report is most likely to be influenced by mood in precisely those cases where youths are at greatest risk of developing bipolar disorder (i.e., affected youths are more likely to have affected parents, whose judgment might be compromised as a result of their own mood states). Although there is a large literature examining the effects of depression on parent ratings (Richters, 1992), much less has been published on the effects of bipolar disorder or mania in particular on ratings of other people's behavior.
The one study of which we are aware directly looking at the effects of parental diagnoses of bipolar or unipolar disorder on cross-informant agreement found that parents with unipolar diagnoses reported significantly more Internalizing problems than did the adolescents, and parents with bipolar diagnoses reported significantly more youth manic symptoms than the youths reported themselves (Youngstrom, Findling, & Calabrese, 2004). However, even after controlling for parental diagnostic status, youths with K-SADS bipolar diagnoses still reported significantly fewer manic symptoms than did parents (p < .0005), strongly suggesting psychological “minimization” by the affected youths.
Implications
The effects of mania on interrater agreement are much less well understood than the effects of depression and negative emotional states. Although parent report appears to be influenced by parent mental health status, the effects are not large enough to entirely discount the generally greater validity of parent report suggested by the ROC analyses and regression analyses reported above. It is worth noting that the above analyses also demonstrated validity despite including a large number of parents affected by mood disorder. On the whole, findings indicate that parent report possesses important advantages in terms of diagnostic and clinical validity that are not fully compromised by potential mood-induced biases. Based on the available evidence, it seems that both research and clinical investigations would do well to include parent report of manic symptoms (or at least the report of an adult with longstanding familiarity with the youth's behavior so that they can identify changes in mood and functioning). In situations where parent report is readily available, then youth and teacher report measures have not demonstrated incremental value in terms of predicting diagnosis (Youngstrom, Findling, Calabrese, Gracious, et al., 2004), but they may be useful adjunctive measures for the purposes of treatment and outcome assessment (Youngstrom, Findling, et al., 2003).
How Different Measures Compare in Terms of Detecting Bipolar Disorder, the Challenges in Comparing the Performance of Measures Across Research Groups, and Leading Candidates for Research or Clinical Use
As the number of potential measures for detection of PBD swells, it becomes increasingly important to be able to compare the measures and establish which have the greatest validity for clinical decision making as well as defining phenotypes for research. In theory, it should be possible to compare the diagnostic efficiency of different measures based on published findings, using a consistent metric to calibrate performance such as the AUC from ROC analyses (Zhou, Obuchowski, & McClish, 2002). The AUC is preferable to other measures such as test sensitivity and specificity, because it does not depend upon a single test threshold, and it also is unrelated to the base rate of the target diagnosis (unlike indices such as the positive and negative predictive values, or the overall percent correct; Zhou et al., 2002). It is possible to statistically test differences in AUC estimates of different tests based on the same sample, or the same test based on different samples (Hanley & McNeil, 1983).
Two factors complicate the agenda of comparing test performance based on published articles. One issue is the fact that different studies have used different operational definitions of bipolar disorder. More narrow definitions may tend to result in higher estimates of diagnostic sensitivity, particularly for index tests whose content includes more manic symptoms. Similarly, inclusion criteria that emphasize greater levels of impairment in the manic group (such as ascertainment from inpatient versus outpatient settings, or ascertainment from clinical versus community settings) will tend to yield higher estimates of diagnostic sensitivity because a larger percentage of bipolar cases will tend to score above threshold on both measures of general impairment as well as measures of mania (Zhou et al., 2002).
The second issue is that the composition of the comparison (i.e., nonbipolar) sample can vary dramatically across studies. Differences in the general level of impairment of the comparison group will have a direct effect on specificity estimates. Less impaired groups will be easier to separate from the target group, yielding higher estimates of specificity (Zhou et al., 2002). It is also important to consider the rate of occurrence of diagnoses that are difficult to differentiate from bipolar disorder. For example, both unipolar depression and ADHD demonstrate high degrees of symptom overlap with the clinical presentation of bipolar disorder (Bowring & Kovacs, 1992; Kim & Miklowitz, 2002). Samples that include higher rates of unipolar depression or ADHD would be expected to show lower levels of diagnostic specificity as a result, because nonbipolar cases would have a greater tendency to show spuriously high scores on measures intended to capture bipolar disorder.
The possibility that these two factors could markedly influence the apparent performance of diagnostic tests was empirically confirmed in a reanalysis of published data using two different sets of inclusion and exclusion criteria. The original analysis used a broad definition of bipolar disorder, lumping together youths who met strict criteria for bipolar I with youths meeting criteria for bipolar II, cyclothymia, and bipolar not otherwise specified (NOS; mostly due to inadequate duration of mood states to meet strict DSM-IV criteria for the other bipolar categories). The comparison group in the original analysis consisted of all other youths completing the assessment protocol, regardless of diagnosis (Youngstrom, Findling, Calabrese, Gracious, et al., 2004). As a result, the comparison group included a large percentage of youths with ADHD, unipolar depression, or both concurrently, along with a variety of other diagnoses.
The reanalysis limited the bipolar cases to those that satisfied the more restrictive inclusion criteria documented in Geller et al. (2003). Similarly, the reanalysis distilled the comparison group according to Geller et al.'s (2003) exclusion criteria, creating a group comprised entirely of youths meeting criteria for ADHD without any comorbid mood disorder or youths with no Axis I diagnosis at all.
Comparing the two sets of analyses clearly indicated that that diagnostic efficiency of all index tests was significantly better under the more distilled conditions for sample construction (Youngstrom, Meyers, Youngstrom, Calabrese, & Findling, in press). The AUCs of tests under the distilled conditions replicated the estimates reported in an independent sample (Tillman & Geller, 2005), providing excellent convergent evidence that similar tests perform comparably well under similar conditions, even across research groups. Unfortunately, the findings also indicated that not all tests were equally influenced by changes in sample characteristics. Although all index tests showed significantly degraded performance under more clinically generalizable sampling conditions, the tests that were optimized in samples under distilled conditions showed the largest decrement (Youngstrom, Meyers, et al., in press). Both the sensitivity and specificity of index tests changed markedly as a function of changing the sample composition.
These empirical findings reinforce the point that studies comparing the diagnostic performance of multiple measures in the same sample not only have greater statistical power, but also greater internal validity for comparing the relative performance of index tests (Hanley & McNeil, 1983). To date, we are aware of five published articles that compare multiple measures within the same sample (Findling et al., 2002; Youngstrom, Findling, Calabrese, Gracious, et al., 2004; Youngstrom, Gracious, et al., 2003; Youngstrom, Myers, et al., 2005, in press). Two of these publications (Findling et al., 2002; Gracious et al., 2002) have been superseded by a publication that subsumes the original dataset in a larger sample and more comprehensive analyses (e.g., Youngstrom, Findling, Calabrese, Gracious, et al., 2004). The pattern that consistently emerges across all of the studies is that parent report measures significantly outperform youth report and teacher report measures. Parent report measures that include more manic item content have a slight but sometimes statistically significant advantage over other parent-reported measures in terms of AUC. The superior performance of instruments such as the Hypomanic/Biphasic Scale of the GBI (Youngstrom et al., 2001), the Parent-Report Mood Disorders Questionnaire (adapted from Hirschfeld et al., 2000), and the Parent YMRS (Gracious, Youngstrom, Findling, & Calabrese, 2002) is mostly a function of their improved specificity, reducing the number of false positive test results in nonbipolar cases. It is worth noting that virtually no large studies to date have included teacher-reported mania scales, making it difficult to determine whether they also would show superior specificity compared to more global measures of behavior problems.
Within the realm of self-reported measures of mania or externalizing behaviors, there appears to be much less distinguishing the different index tests in terms of performance. Measures with more manic content do not significantly outperform the YSR externalizing scale. This is probably in part a result of the lessened insight into illness and behavior associated with manic states, but it also may be exacerbated by the reactive nature of many of the items in the scales. Questions that ask about irritable mood, for example, tend to produce significantly lower scores in self-report than collateral report. For example, the GBI item asking about times “when almost everything got on his/her nerves and made him/her irritable or angry” (#54) was substantially more endorsed by parents than youths with bipolar diagnoses (Cohen's d = 1.5). It is worth speculating that rephrasing of the questions so that endorsement seemed less pejorative to the respondent might not only yield higher mean scores, but also more valid (albeit indirect) scores. For example, in clinical interviews, it often is productive to assess irritable mood by asking the patient if there have been more arguments with parents, teachers, or significant others, or if the patient has noticed an increase in the “friction” of interpersonal interactions. It might be feasible to develop a self-report measure that assesses manic symptoms in a way that avoids defensive response sets, similar to some innovative measures of antisocial personality traits (Andershed, Gustafson, Kerr, & Stattin, 2002).
Based on the results of analyses comparing multiple measures, it appears that the PGBI (particularly the 10-item mania form; Youngstrom, Myers, et al., 2005) and the Parent MDQ (P-MDQ) are the two best-performing measures diagnostically. The P-YMRS appeared promising in initial studies, but has performed slightly less well than the PGBI and P-MDQ, perhaps due to the inclusion of two psychometrically weak items (#10, bizarre appearance, and #11, lack of insight; Gracious et al., 2002). Other parent measures with adequate representation of manic symptoms are likely to perform well (e.g., Gadow & Sprafkin, 1994; Pavuluri, 2002), although the few studies published have tended to use samples that might exaggerate diagnostic efficiency compared to what the instrument would deliver in most clinical settings.
Implications
Given the large effects that diagnostic definitions and sample construction can have on estimates of diagnostic efficiency, it is imperative that more work be done comparing multiple measures in the same sample, and that these studies extend sampling to include underrepresented participant groups and a breadth of clinical settings. It cannot be assumed that a published estimate of diagnostic efficiency will generalize to all settings or populations, when there are frequent empirical demonstrations to the contrary (Kraemer, 1992). When reviews are made of studies of diagnostic efficiency, then preference should be given to meta-analytic methods that formally code aspects of study characteristics such as operational definition of bipolar disorder, quality of the reference standard diagnosis, severity of impairment in the bipolar and nonbipolar groups, generalizability of the inclusion and exclusion criteria, and other such study parameters that could have a major impact on findings (Bossuyt et al., 2003). Priority areas for new studies include evaluations of teacher measures with item content including potentially specific markers of mania such as elated mood, grandiosity, and episodic changes in mood or energy. Priority should also be given to exploration of new self-report measures that are less reactive and less susceptible to fluctuations in insight, as well as to the study of collateral informant measures of mania in adult age groups.
The specific choice of measure depends on the application. If the purpose is identifying cases for further assessment, and false negatives are considered worse than false positives, then the CBCL externalizing scale is a good choice. Most bipolar cases tend to score fairly high on the externalizing scale, and so low scores are actually quite decisive in most settings at ruling bipolar disorder out. If the purpose is to help rule bipolar diagnoses “in,” or to identify a relatively pure sample for research purposes, then more diagnostically specific measures would be preferred, such as the PGBI or the P-MDQ. Higher scores on these measures are unlikely to occur in nonbipolar cases, although many bipolar cases also might fail to attain high scores at different phases of illness. There are many promising measures under investigation that cannot be directly compared to other measures because of differences in sample composition or definitions of bipolar disorder, but this situation is likely to change rapidly as more studies contrasting multiple measures in the same samples are published.
The Evidence-Based Strategies for Interpreting Measures as Diagnostic Aids
Sensitivity and specificity
The sensitivity and specificity of a test are the most commonly reported features that have direct clinical application. Tests with high sensitivity are more effective at ruling diagnoses “out”: subthreshold scores on such tests will rarely occur in cases that have the disorder. Conversely, tests with high specificity are more helpful at ruling a diagnosis “in.” By establishing a stringent threshold that would be exceeded by few cases without the target condition, highly specific tests make the likelihood of a true diagnosis higher when the threshold is exceeded (Sackett et al., 2000).
There are several shortcomings to sensitivity and specificity from a practical viewpoint. One is that they are not intrinsic properties of a test, but instead are parameters that can change in different settings (Kraemer, 1992). This contradicts a fairly widespread belief that sensitivity and specificity are invariant across samples (Baldessarini, Finklestein, & Arana, 1983), but data reviewed above have demonstrated exactly these sorts of shifts in performance in measures detecting bipolar disorder (e.g., Youngstrom, Meyers, et al., in press). For this reason, it is imperative that more research examine the diagnostic efficiency of multiple tests across different age groups, demographic groups, and clinical conditions, so that researchers and clinicians can select estimates that more closely approximate the populations with which they work.
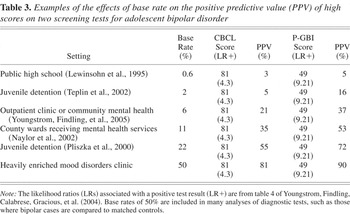
A second issue is that neither sensitivity nor specificity provides a direct gauge of the accuracy of a test result for a specific case, nor for a group of cases sharing positive tests results. These probabilities, that a test result is accurate and correctly indicates the true diagnostic status, are what would be most useful both clinically and in defining research samples. Such probabilities can be estimated, and they are variously referred to as the positive (PPP) and negative predictive values or predictive (NPP) powers (Kraemer, 1992). The PPP and NPP are Bayesian probability estimates that combine information from the test result with the prior risk of having the target condition. Put another way, the likelihood of a youth having a diagnosis is not just a function of their test result, but also of other factors that contribute to their risk. One of the most widely discussed factors is the base rate, or the frequency with which a disorder presents at a particular setting. PPP and NPP can be calculated from a combination of the base rate, sensitivity, and specificity of the test. The PPP and NPP, although much easier to interpret and apply than sensitivity and specificity, are commonly not reported because they are directly dependent on the base rate. The effects of base rate on PPP are illustrated in detail in the following section. Until recently, the lack of base rate estimates for PBD further complicated efforts to estimate PPP and NPP; but base rate estimates from different infrastructures are now becoming available (see Table 3 for a partial listing; Youngstrom, Findling, et al., 2005).
Examples of the effects of base rate on the positive predictive value (PPV) of high scores on two screening tests for adolescent bipolar disorder

A third issue is that sensitivity and specificity both change as a direct function of the threshold chosen on the index test. For example, considering CBCL externalizing T scores of 80 or higher a “test positive” result for bipolar disorder will have higher specificity and lower sensitivity than setting the test positive threshold at a T score of 70. Fewer nonbipolar cases would score in the 80+ range than in the 70+ range, but using the lower threshold would reduce the number of true bipolar cases missed. Published articles evaluating the same index test will produce different estimates of sensitivity and specificity if different thresholds are used. It then becomes unclear whether differences in diagnostic efficiency are due to changes in test performance, or simply because different thresholds were used. The problem of comparing test performance across samples can be solved by reporting a global measure of performance such as the AUC. However, the more challenging issue is deciding where the optimal decision threshold is for a test, and how to pick a threshold that would be robust and generalizable.
Quality calibrated test performance
Kraemer (1992) has developed a method for calibrating the sensitivity, specificity, and total percentage correct (which she calls “efficiency”) so that optimal thresholds become more obvious. The calibration process algebraically adjusts the sensitivity and specificity according to the rate of cases testing positive or negative at that threshold. Put another way, it is weighting the sensitivity, specificity, and efficiency estimates based on the marginal distributions. Intuitively, a sensitivity of 90% is much more impressive if only 20% of a sample tested positive than if 90% of the sample tested positive. Indeed, a sensitivity of 90% could be achieved by a random or useless test if one were willing to treat 90% of cases as “test positives.” Cohen's kappa, the percentage of correctly identified cases after adjusting for the marginals, is identical to Kraemer's calibrated efficiency.
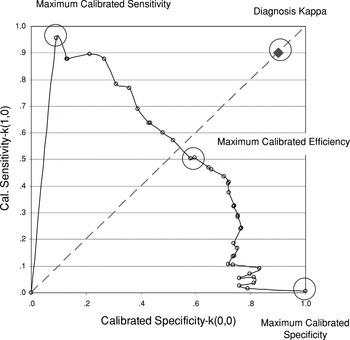
It is possible to graph calibrated sensitivity as a function of calibrated specificity, producing what Kraemer calls a “Quality ROC” (QROC) plot. Unlike an ROC plot, the QROC plot can make it visually obvious what might be optimal places to cut a test to maximize sensitivity, specificity, and efficiency, adjusting each for chance performance. The QROC transformation changes the ROC curve into a shape that Kraemer describes as a “leaf” or the “hull” of a boat (see Figure 2). When calibrated sensitivity is plotted as a function of calibrated specificity, the point most closely approaching the top of the chart maximizes sensitivity above chance performance, and the point furthest to the right on the QROC curve maximizes specificity. The point closest to the top right corner maximizes Cohen's kappa, which would be the optimal place to set the test threshold if the costs and benefits of positive and negative results are equal.

A quality receiver operating characteristic (QROC) curve for a 10-item PGBI discriminating any bipolar spectrum diagnosis (n = 291) from all other diagnoses (n = 346). The diamond in the upper right-hand corner denotes the diagnostic efficiency of the criterion diagnosis (κ = .90).
Kraemer's approach is appealing because it offers a mathematical framework for identifying decision thresholds. It also allows for the incorporation of costs and benefits, which can shift the choice of threshold (although these sorts of patient preferences and clinical utilities have not been formally operationalized in the area of PBD yet). Another important feature is that it identifies multiple thresholds for a test, each optimized for a different purpose (i.e., maximizing sensitivity, specificity, or overall accuracy). This can help remind test users to think about the purpose for which they are using the test. However, despite these advantages, the QROC approach has not led to identification of robust decision thresholds on measures examined in the area of PBD. Instead, QROC strongly indicates that it is unlikely that robust decision points can be identified for tests discriminating PBD. Figure 2 presents a QROC plot for the 10-item version of the Hypomanic/Biphasic Scale from the PGBI. Of the measures evaluated in this particular sample, this index test presents a “best case” scenario (i.e., largest AUC, .86 in this sample versus a maximum potential AUC of .95 given the interrater reliability of the gold standard diagnosis). The shape of this QROC curve is quite different from the prototypic QROC curves presented in Kraemer (1992), and at the same time is it representative of the shape of QROC plots for the CBCL, TRF, YSR, parent and youth report on the GBI, parent and youth report on the MDQ.
Inspection of Figure 2 indicates that the statistically optimal threshold to maximize sensitivity is so low as to be clinically trivial. Setting the score at a 1 or higher results in an uncalibrated sensitivity of 1.00 and specificity of .79, and a calibrated sensitivity of .97. The problem is that setting the threshold this low creates a huge number of test positives (89% of this sample), with the consequence that there is little advantage to giving the test versus just treating everyone as a “test positive” for bipolar disorder. Similarly, the statistically optimal threshold to maximize specificity is extremely stringent. The recommended threshold score of 23 or higher, yielding a calibrated specificity of .85, is close to the absolute maximum score of 30. Although most cases scoring this high are likely to have bipolar disorder, the majority of bipolar cases will appear as false negatives (sensitivity = .19). Thresholds this high would require screening huge numbers of cases to identify a large enough number of cases to enable statistical analysis also: the threshold is high enough that it might miss four out of five true bipolar cases, and less than 10% of the validation sample scored in this range.
Finally, the QROC plot makes clear that there is no obvious best threshold in terms of maximizing kappa. Instead of there being a clear peak aimed at the top right corner of Figure 2, there is a long line of points nearly equidistant from the corner. In numeric terms, there is a wide range of threshold scores that produces nearly identical kappa scores. Threshold scores of 6+ to 15+ all offer kappa values greater than .50, with a sample specific maximum kappa of .55. Any advantage of a particular score relative to the rest of the pack is likely to be attributable to sampling error and not a robust improvement in performance. The QROC plot is indicating visually that there is little to choose between among a wide range of scores, at least when evaluating different measures in the context of PBD.
Likelihood ratios (LRs)
Evidence-based medicine is emphasizing a slightly different framework for interpreting tests, advocating LRs as the preferred way of presenting and interpreting diagnostic tests (Guyatt & Rennie, 2002; Jaeschke, Guyatt, & Sackett, 1994a, 1994b; Sackett et al., 2000). The downsides of LRs are that they are unfamiliar to most clinicians and rarely discussed in psychological research. They also do not readily accommodate the use of cost and benefit utilities to weight decision making, but because utilities have not been formally developed in PBD, this is not a big sacrifice.
LRs marry the strengths of specificity and sensitivity with the strengths of the predictive powers. Specifically, LRs can be derived from sensitivity and specificity, and share their algebraic independence from the base rate of a disorder; but they also can be used to estimate the predictive powers in a straightforward manner. The LR associated with a positive test result is simply a ratio of the percentage of positive results among those with the disorder divided by the percentage of positive results in cases without the disorder (e.g., sensitivity divided by [1 − specificity]). The higher the LR, the more the test result increases the probability of a true positive diagnosis. LRs >10 (or <.10) are often clinically decisive: they are sufficiently extreme to change the probability of a diagnosis from 50 to 91% (or to 9% in the case of LR = .10). Because they derive from sensitivity and specificity, or from the normative percentiles of bipolar and nonbipolar distributions of scores on a test (Frazier & Youngstrom, in press), LRs are also likely to be more stable across samples than PPP or NPP.
“Nomograms” are figures that eliminate the need for any calculation, allowing the user to connect the prior probability of having bipolar disorder with the LR to determine the revised probability (the PPP; Sackett et al., 2000). Regardless of whether using a calculator or a nomogram, the LR approach captures at least as much information as would reliance on sensitivity and specificity, and it also makes it easy to recalculate PPP and NPP for different settings by incorporating local base rate information. It also is more flexible than PPP and NPP, because the framework can use information besides the base rate as a prior probability value. For example, a clinician could use LRs and a nomogram to combine information about the base rate of bipolar disorder at their setting with the change in risk associated with a positive family history of bipolar disorder (more on this below), as well as elevated scores on the CBCL externalizing scale.
Another potential advantage of the LR methodology is that it could potentially preserve more information from test scores than reflected by sensitivity and specificity estimates based on a single threshold. Employing a single-threshold functionally dichotomizes the index test, with a substantial loss of information (Cohen, 1983). Instead, a test could be divided into a number of categories, such as quintiles, and LRs estimated separately for each category. This approach is recommended because it not only retains more information about the diagnostic value of test scores, but it also allows asymmetries in the information value to emerge. When the multilevel LR approach was applied to bipolar diagnoses in two samples of youths, clear evidence of such asymmetry emerged: the index tests examined were often much more powerful at decreasing the risk of bipolar disorder (i.e., low scores generating LRs well below 1.0) than at increasing the risk of bipolar disorder even when cases earned very high scores (Youngstrom, Findling, Calabrese, Gracious, et al., 2004; see especially their table 4).
Implications
There are a growing number of tests that can make a clinically significant contribution to the identification of cases with PBD. However, it appears that with most of the tests, there will not be a single optimal threshold that will produce optimal efficiency (such as a higher kappa coefficient than attainable by other scores). The base rate of bipolar disorder also appears vary widely across clinical settings (Youngstrom, Findling, et al., 2005), heightening the importance of considering base rate when interpreting tests. The LR approach, which is preferred by advocates of evidence-based medicine, offers the potential to utilize more information from test scores and also contextualize scores based on the local prevalence of bipolar disorder as well as other risk factors.
Psychometric tests such as the PGBI and CBCL clearly have a role in evidence-based assessment of PBD, as has been elaborated in detail elsewhere (Youngstrom, Findling, et al., 2005). There are now published examples that provide detailed examples of applying the LR approach to clinical cases (Youngstrom & Duax, 2005; Youngstrom & Kogos Youngstrom, 2005). More work is clearly needed to extend the multilevel LR approach to other promising tests, including new screening measures, as well as neuropsychology tests and other performance measures that have demonstrated statistical differences between youths with and without bipolar diagnoses, but which currently have unknown diagnostic utility (e.g., Dickstein et al., 2004; Toichi et al., 2006).
How Test Performance Changes When a Test Is Used in a New Setting and Implications for Research Samples and Clinical Practice
At least three major factors will affect test performance in predictable ways when tests are used in new settings. Broadly speaking, these are (a) the base rate of the condition, or how often it occurs at the new setting of interest; (b) factors that affect the definition or severity of the target condition; and (c) factors that affect the composition and severity of the nontarget group.
Effects of base rate
The prevalence of bipolar disorder in the setting where the test is used (as opposed to the setting where the test was initially evaluated) has a huge effect on the accuracy of the test results. If bipolar disorder is rare, then most people scoring positive on a screening test still will not have bipolar disorder, even if the test is fairly specific to bipolar disorder. The positive predictive power, or true positive rate of a test, can be calculated from the specificity, sensitivity, and base rate. The nomogram approach detailed above provides a nonmathematical way of estimating the PPV.
Table 3 provides examples of how test performance can vary depending upon the base rate. The table relies on published estimates of the base rate from different settings, to offer clinically relevant standards of comparison. The accuracy of extreme high scores on the CBCL externalizing scale could vary from 3 to 81%, depending upon the prevalence at the setting, even with the diagnostic sensitivity and specificity remaining exactly the same. The Negative Predictive Values are not tabled, but they will almost always be larger, in light of the low prevalence of bipolar disorder in most settings.
The table concentrates on threshold scores based on the CBCL externalizing scale and the PGBI. However, the same principles hold true for other definitions of screening tests and proxy measures of bipolar disorder, such as latent class analyses of item scores (Hudziak, Althoff, Derks, Faraone, & Boomsma, 2005). If a proxy measure was developed in a sample with a higher rate of bipolar disorder than the subsequent samples in which it is applied, then the majority of cases satisfying the proxy criteria may still not actually have bipolar disorder themselves. This is an important point to consider, because proxy measures such as the CBCL are often less expensive, easier to implement in a standardized manner, and will more often be available in large-scale epidemiological, longitudinal, or twin studies, and other venues for secondary analyses than would be the case for training- and labor-intensive protocols such as the K-SADS. These considerable advantages will be offset by the fact that many or most members of the proxy definition will still not have bipolar disorder, undermining the validity of any conclusions based upon examination of the proxy group (Youngstrom, Youngstrom, et al., 2004). For this reason, findings that are based on proxy definitions of bipolar disorder, especially in samples where the based rate of bipolar disorder is likely to be less than 25%, need to be interpreted cautiously (Galanter et al., 2003; Hazell, Carr, Lewin, & Sly, 2003; Hudziak et al., 2005).
The same general concerns apply with equal force to interpreting tests in clinical situations. Test results should not be interpreted without careful attention to base rates, particularly when high scores on the best contemporary tests are not sufficient to raise the probability of bipolar disorder to higher than 50% in most clinical settings. At the same time, accurate base rate estimates may not always be available, and published rates can vary markedly even within the same type, as is evident from comparing the estimates in the Pliszka, Sherman, Barrow, and Irick (2000) versus Teplin et al. (2002) studies (see Table 3).
Effects of factors changing the definition of disorder or severity of presentation
The sensitivity of a test will improve when the target group is more dysfunctional, or when it exhibits a more narrowly prototypical presentation of the illness. Enrolling participants from a setting entailing higher levels of clinical care will probably yield higher levels of impairment, and potentially greater diagnostic sensitivity as a consequence. Using a broader and more clinically generalizable definition of bipolar disorder will undercut the apparent sensitivity of tests oriented towards narrow phenotypes, but might have less impact on tests that focus on aggression or other less specific markers of bipolar disorder. Because relatively few tests have been developed against a narrow phenotype (cf. Tillman & Geller, 2005), sensitivity is unlikely to degrade (and might even improve) when tests are applied in comparable or more severe settings. It is more likely that tests validated in outpatient settings will demonstrate lower sensitivity to bipolar disorder in arenas such as public schools. Students with bipolar disorder presenting to public schools need to have illnesses mild enough or managed well enough that they are able to continue attending school.
Factors that affect the composition and severity of the nontarget group
Despite the challenges pertaining to diagnostic efficiency in the bipolar group, it is likely that factors influencing the characteristics of the nonbipolar group will have the more pernicious effect in most settings. Earlier discussion focused on factors influencing the construction of the comparison group in samples where measures are validated. The results demonstrated empirically that the specificity of tests evaluating bipolar disorder changes markedly depending upon the comparison group (Youngstrom, Meyers, et al., in press). The same processes will also affect test performance when the test is exported to new settings; however, the changes in test performance will be invisible unless an independent criterion diagnosis is also gathered to recalibrate the test's diagnostic efficiency. This is almost never done because of the costs involved.
It is possible to make some lawful predictions about how test performance would change, though. If the rate of diagnoses that are difficult to distinguish from bipolar disorder increases relative to their rate in the test validation sample, then the specificity of the test will be lower in the new sample. If the severity of impairment in the nonbipolar group is worse in the new sample than the validation sample, specificity is also likely to worsen. In practical terms, studies that attempt to identify bipolar cases using screening tools or other proxy definitions in samples participating in ADHD treatment protocols will risk having higher rates of false positive bipolar diagnoses than would be projected based on the test's published specificity. ADHD is associated with a higher rate of false positive scores on most measures of mania, and so using a measure in a sample where ADHD is more common will increase the rate of false positives. These observations do not mean that bipolar disorder does not occur in settings oriented towards ADHD, just that it will be more difficult to tease out bipolar “needles” in a haystack of attention problems and high motor activity.
In similar fashion, it would be difficult to separate bipolar depression from unipolar depression in situations where unipolar depression is more common. This will become an increasingly frequent clinical challenge as pharmaceutical companies add the recommended language about routine screening for bipolar disorder to the packaging inserts for antidepressant medications, and consumers and clinicians pay more attention to distinguishing between the types of mood disorder. For example, the Hypomanic/Biphasic Scale of the PGBI discriminated bipolar spectrum disorders from a group with no diagnosis with an AUC of .98, but bipolar versus unipolar depression had an AUC of .80 (Youngstrom et al., 2001). In a related vein, detecting bipolar cases will also be challenging in forensic settings, because the impulsivity and aggressiveness associated with antisocial behavior not driven by mood processes will still lead to elevated false positive scores on measures of mania. Forensic settings also add the complication that reliable parent-report information is rarely available, so recognition of mania usually depends upon self-report (Pliszka et al., 2000; Teplin et al., 2002).
Effects of heuristics
There is not a uniform agreement among experts in the field, and certainly not among front-line clinicians that such a thing as childhood or adolescent bipolar disorder ever occurs. A bias against the existence of the target disorder clearly will have a significant impact on the rate at which that disorder is diagnosed. Furthermore, diagnostic quality across settings spans a wide range (from careful and thorough to haphazard), and is affected by such factors as the amount of time spent with the patient and the parent, the degree to which collateral information is pursued, and the training and supervision of the clinician(s) involved.
Implications
Tests for bipolar disorder have performance characteristics that change markedly depending on the clinical features of the setting in which they are used. The fundamental issues of shifts in sensitivity, specificity, and base rate apply to all medical diagnostic testing (Zhou, Obuchowski, & McClish, 2002). However, they have been little discussed in the area of PBD. The net impact of these factors is that proxy definitions of PBD that appear to show good overlap with the criterion diagnoses in one sample may capture few, if any, bipolar cases in another sample. Proxy measures hold tremendous appeal because they are less expensive, more readily standardized, often highly reliable, and readily available in many existing datasets. However, the apparently precise phenotypic definition offered by the proxy measure may detect mostly cases that would not fit a narrow phenotype of bipolar disorder, because of the low prevalence. At the same time, the proxy definition may apply to only a subset of the cases of “true” bipolar disorder, due to imperfect sensitivity of the proxy definition. These disconnects between the proxy and the criterion diagnosis are reconcilable with developmental models of psychopathology: bipolar disorder is likely to involve multiple risk factors and processes, and the proxy definitions in some cases might be more direct measures of such a process. Proxy definitions, such as screening “test positive” results, clearly should not be equated with bipolar disorder. Until the relationship between a proxy and the criterion diagnosis is better understood, it is difficult to know how to interpret studies of behavioral genetics (Hudziak et al., 2005), longitudinal course (Hazell et al., 2003), or treatment response (Galanter et al., 2003) that are based on proxy measures.
The Role of Family History of Mood Disorder Within an Assessment Framework
Family psychiatric history plays a large role in the clinical assessment of PBD, and in fact, is the only 1 of 30 risk factors evaluated in the literature that has proven robust enough to warrant routine clinical consideration (Tsuchiya, Byrne, & Mortensen, 2003). Although we need to “diagnose the child, and not the family,” family history is informative because of the strong contributions of both genes (e.g., McGuffin et al., 2003) and family environmental processes (e.g., Hammen, Adrian, Gordon, Jaenicke, & Hiroto, 1987; Miklowitz & Alloy, 1999) to the development and recurrence of bipolar disorder. Recent reviews have established that offspring of parents with bipolar disorder are at heightened risk for developing psychopathology in general, with the risk being somewhat higher for bipolar disorder in particular versus mood, anxiety, or behavior disorders in general (DelBello & Geller, 2001; Lapalme, Hodgins, & LaRoche, 1997). Meta-analysis indicates that on average 5% of the youths with a bipolar affected biological parent have developed bipolar disorder themselves at the time of participation in the included studies, versus 0% of the cases in the pooled comparison groups (Hodgins, Faucher, Zarac, & Ellenbogen, 2002).
It is possible to estimate an LR for the change in risk associated with having a first-degree relative with bipolar disorder. The recommended rule of thumb is to assign an LR of 5.0 to cases where a first-degree relative (e.g., biological parent or full biological sibling) has a confirmed history of bipolar disorder, and to assign half that risk (LR = 2.5) in instances where a second-degree relative has a history of bipolar disorder (Youngstrom, Findling, et al., 2005). This value was founded on the 5% prevalence of bipolar disorder in at-risk youths from the meta-analysis, compared to a 1% population prevalence. Several caveats need to be mentioned about the 5.0 LR estimate. The rates of bipolar disorder in the at-risk groups in the meta-analyzed studies varied a great deal, from 1 to 16%, with more heterogeneity than could be attributed just to sampling error. Perhaps more importantly, the 1% rate for the general population is higher than the rate of bipolar disorder reported in several epidemiological studies of youths (Costello, Mustillo, Erkanli, Keeler, & Angold, 2003; Lewinsohn, Klein, & Seeley, 1995). The 1% figure was chosen based on several considerations, including (a) epidemiological studies might be less sensitive to bipolar disorder because of reliance on self-report or because of issues of score anchoring or rater training; (b) epidemiological studies tend to underestimate the occurrence of bipolar spectrum disorders, because they often only inquire about episodes of mania, and not hypomanic episodes or symptoms (which are necessary for diagnoses of bipolar II or cyclothymia, in addition to bipolar NOS; Kessler, Rubinow, Holmes, Abelson, & Zhao, 1997); (c) bipolar spectrum illnesses besides bipolar I still appear to be quite impairing (Findling et al., 2005; Lewinsohn, Seeley, Buckley, & Klein, 2002), and thus deserving of consideration, even though not consistently included in epidemiological estimates; and (d) increasing the estimated prevalence in the general population is conservative, as it enlarges the denominator and therefore shrinks the LR and downsizes the degree of risk assigned to detecting a bipolar relative.
Given the controversy about labeling youths as having “bipolar disorder,” the authors of the evidence-based recommendations opted for a cautious stance with regard to the risk associated with positive family history. However, a good case could be made that the LR of 5.0 is too low. More conservative estimates of the prevalence of bipolar disorder in the general population would drive the LR much higher. More importantly, family histories of bipolar disorder themselves appear to be specific, but not very sensitive (Kendler, Prescott, Jacobson, Myers, & Neale, 2002; Kendler & Roy, 1995). In other words, research quality family histories, such as those gathered via the Family History–Research Diagnostic Criteria method (Andreasen, Endicott, Spitzer, & Winokur, 1977), tend to be accurate about the cases identified, but still tend to miss many cases that actually had mental health issues. The little evidence available suggests that typical clinical practices entail even less thorough assessment of family history, which would further erode the sensitivity of the assessment to familial bipolarity. The other issue that complicates clinical assessment yet further is that bipolar disorder appears to be underrecognized in minority populations (Bhatnagar et al., 2006; DelBello, Soutullo, & Strakowski, 2000; Neighbors, Trierweiler, Ford, & Muroff, 2003; Strakowski et al., 1997). Thus, family histories in non-White populations are likely to be even less sensitive to bipolar disorder.
Two further advantages of carefully assessing family history are both related to treatment. One issue is that response to pharmacological interventions is likely to be moderated by genes or genetic polymorphisms, such that the history of response or nonresponse of relatives could be valuable in guiding the treatment selection for the youth (e.g., Duffy et al., 2002). The more general advantage is that careful assessment of family history provides a sense of the context and interpersonal network surrounding the affected youth, which can help promote positive outcomes even in individually focused therapy modalities as well as family therapy (Geller, Tillman, Craney, & Bolhofner, 2004; Miklowitz, George, Richards, Simoneau, & Suddath, 2003; Miklowitz, Goldstein, Nuechterlein, & Snyder, 1988).
Implications
Family history is definitely an important risk factor to assess, and one that contributes prominently to evidence-based assessments of bipolar disorder (Youngstrom, Findling, et al., 2005). However, multiple factors mandate further research on the role of family history, both in terms of differential diagnosis, and also in terms of predicting treatment response. Newer studies are likely to change estimates of the prevalence of bipolar spectrum illness both in biologically at risk and low-risk populations, especially as broader phenotypic definitions of bipolar illness are applied (Leibenluft et al., 2003). In addition, there is evidence suggesting that treatment factors, such as lithium responsiveness, may also run in families, and it is likely that there will be other familial moderators of treatment outcomes identified at both the biological and environmental levels.
What Are the Implications of Assessment Research for the Understanding of the Phenomenology of Bipolar Disorder from a Developmental Framework?
One of the major potential contributions of assessment research to the understanding of developmental psychopathology comes from the use of consistent methods across different age cohorts. Only by using the same instrumentation does “homotypic continuity,” or the persistence of the same behavioral expressions of the same underlying trait, become clear. Furthermore, differences in symptom-level data when measured with a consistent methodology also provide strong evidence of developmental change, and provide a framework for using longitudinal data to gauge whether change is evidence of instability (e.g., remission or recovery, as well as later correction of initially false positive diagnoses) versus heterotypic continuity, whereby the same underlying process is expressed in the form of different behaviors due to the interaction of the process with developmentally determined environmental contexts (Cicchetti, Rogosch, & Toth, 1994). Of course, there are potential measurement issues that could also contribute to apparent change in the responses on psychometric items, such as cognitive limits to the reliability of self-report in younger samples (Anastasi & Urbina, 1997), changes in the developmental contexts in which behavior is observed (e.g., decreased need for sleep is something that could readily be observed by parents of school-aged children, but not of most college students), and heterotypic continuity making the content of certain items developmentally less appropriate even though the underlying mania still is manifesting.
To date, studies of phenomenology in PBD have concentrated on description of presentation within younger age groups, versus formal statistical comparison with adult samples. A recent meta-analysis of these studies (Kowatch et al., 2005) found that irritable mood was present in almost all cases of PBD. Elated mood, although not the most impairing symptom, was also present during at least one manic episode in the majority of cases across studies, regardless of whether elated mood was required as an inclusion criterion. In contrast, grandiosity appears to have lower sensitivity to bipolar disorder, occurring in only 60% of cases on average. Concerns have also been raised that irritability and grandiosity both may not be highly specific to bipolar disorder (Carlson, 2005). Hypersexuality had the lowest sensitivity of any of the symptoms examined, occurring in fewer than a third of cases. It is possible that physical maturation moderates the rate of hypersexuality, such that frequencies will increase with age.
The development of a 10-item measure to detect mania provides a statistical window into the features that best distinguish PBD from other disorders (Youngstrom, Frazier, Findling, & Calabrese, 2006). The 10 items were drawn from the pool of 73 items on the PGBI. Thus, the item pool included items describing depressed, manic, hypomanic, and mixed states. Additionally, the item pool consisted of clinically associated features as well as DSM symptoms, casting a broader descriptive net. Items selected for the short form demonstrated the largest statistical separation between two groups: Those with any bipolar spectrum diagnosis, versus all of the remaining participants in the protocol regardless of diagnosis. The best discriminating items were all members of the original Hypomanic/Biphasic Scale, despite the fact that unipolar depression and ADHD were included at roughly equal rates in the comparison group. The items assessing elated mood were among the 10 best discriminating items, whereas the items pertaining to grandiosity did not discriminate well enough for retention. Seven of the 10 best discriminating items included reference to periods of “extreme happiness or intense energy.” Irritable mood items were also among the most discriminating, but the PGBI items all embed irritable mood in the context of other mood symptoms. For example, one item asks, “Have there been times of several days or more when, although your child was feeling unusually happy and intensely energetic (clearly more than his/her usual self), he/she also had to struggle very hard to control inner feelings of rage or an urge to smash or destroy things?”
Examination of the most discriminating items also indicates that rapid shifts in mood and energy, although not DSM-IV symptoms strictly speaking, are highly indicative of PBD. The majority of the most discriminating items also were originally classified as “biphasic” or mixed state items by Depue et al. (1981). Both of these observations suggest that PBD is characterized by rapid shifts in mood and energy, with mixed episodes that involve rapid oscillation between different mood states. These data are consistent with clinical observations by others (Geller et al., 2003), and they are perhaps consistent with Kraepelin's observation that younger age cohorts showed more time in mixed states with a volatile and shifting mood presentation (Kraepelin, 1921). Interestingly, data from a large sample of adults with bipolar disorder found evidence of rapid mood shifts in a subset (44%) who, as a group, showed significantly earlier age of onset, higher rates of substance use and anxiety, more suicide attempts, and more relatives with a history of rapid mood switching (MacKinnon et al., 2003).
Implications
Understanding of phenomenology and developmental continuity will require a combination of approaches. These should include clinical and qualitative methods that seek to take developmental context into account when considering different behaviors that may reflect similar underlying processes (Geller et al., 2002). At the same time, there will be great value in using a common assessment methodology longitudinally or across age cohorts to identify similarities in phenomenology at different ages, as well as revealing mechanisms of growth and change in mood systems. Within the constraints imposed by developmental considerations with regard to behavior content, investigations using measures such as the GBI, Mood Disorder Questionnaire, or other instruments with good coverage of mania should be a high priority. These studies should include collateral informant ratings, such as parent or peer report; and collateral perspectives will be especially useful as they become available in adult samples to facilitate comparisons with parent-reported data about child functioning.
General Conclusions
Research in BD has largely been balkanized by age, with study in childhood and adolescence lagging behind research in adult populations until recently. There have been few instances of investigators working across the life cycle, with one of the results being that similar clinical presentations may have been described using different terminology, obscuring the underlying continuity in phenomenology and process. There have been relatively few prospective longitudinal studies following at-risk or syndromal cohorts of youths to date (cf. Hammen, Burge, & Adrian, 1991; Hammen, Burge, Burney, & Adrian, 1990; Lewinsohn, Klein, & Seeley, 2000; Radke-Yarrow, 1998), and most of the extant studies are old enough that many of the current questions about phenomenology in youth were not formally incorporated into the research design (Birmaher et al., in press).
Despite these limitations, it is informative to compare and contrast the research about the assessment of bipolar disorder in children and adolescents with extant work with adults. Exporting of adult definitions of bipolar I, bipolar II, and cyclothymia into pediatric settings has resulted in the identification of groups of youths who show a similar phenotypic presentation that is highly impairing, is associated with elevated parent and self-reports of mood problems, shows familial linkage to BD, demonstrates a course strikingly consistent with adult bipolar disorder (e.g., heightened risk of substance use, incarceration, and suicide), and appears to respond similarly to both many pharmacological (DelBello, Schwiers, Rosenberg, & Strakowski, 2002; Findling et al., 2003; Kowatch et al., 2000) and psychosocial interventions (Feeny, Danielson, Schwartz, Youngstrom, & Findling, in press; Miklowitz et al., 2004). In other words, PBD, defined according to DSM-III-R or DSM-IV criteria, satisfies many of the same criteria for establishing the validity of a disorder as does the adult version (Robins & Guze, 1970). Despite the contentiousness surrounding definitions of child phenotypes, there also appears to be a high amount of consistency across research groups in terms of the symptom phenomenology and associated comorbidity (Weckerly, 2002), with most of the apparent differences in findings attributable to changes in methodology (Kowatch et al., 2005).
Research in adult populations is also uncovering many features that suggest greater continuity with PBD than conventional wisdom has believed. These include higher rates of prevalence of “spectrum” conditions that do not satisfy strict DSM criteria for bipolar disorder (Judd & Akiskal, 2003; Lewinsohn et al., 2000), earlier ages of onset of adult cases than previously suspected (Kessler, Berglund, Demler, Jin, & Walters, 2005; Kogan et al., 2004), particularly for rapid-cycling illness (Schneck et al., 2004), shorter modal durations of mood episodes such as hypomania than required as duration for index episodes in DSM criteria (Angst et al., 2003), and a more prominent role for irritable mood than elated mood in the clinical presentation of many manic and most mixed episodes (Bauer et al., 1991). As a whole, the body of evidence suggests that the “classic” bipolar presentation with distinct mood episodes, good premorbid functioning, and good interepisode recovery is clearly rare in childhood (Carlson, 2002); but this “Cade's Disease” presentation also appears to not represent the majority of adult cases of bipolar illness (Ghaemi, Ko, & Goodwin, 2002), especially as evidence mounts in favor of a larger prevalence of spectrum presentations (Akiskal & Pinto, 1999; Judd & Akiskal, 2003).
Viewed from a distance, the literature reviewed here also indicates that self-report screening tools and symptom measures are performing similarly well in adolescent as adult samples. For example, compare the results for evaluating the MDQ in adolescents in Youngstrom, Meyers, et al. (2005) versus Miller et al. (2004) in adult clinical samples; or compare Danielson et al. (2003) to Depue et al. (1981) for the GBI. At the same time, the consistently higher validity of parent report than adolescent self-report raises important questions for adult studies of bipolar disorder. It is reasonable to hypothesize that collateral informants familiar with adult behavior would demonstrate greater diagnostic efficiency than found with self-report, based both on the robust advantage of parent report and also on the established evidence for impaired insight during some mood states (Pini et al., 2001). Collateral report could become an important adjunct or alternative to clinician-rated assessments of mood in settings, lessening issues of rater training and anchoring effects, and improving assessment in settings where clinical ratings are prohibitively expensive. Besides these potential advantages in terms of utility, though, the child assessment literature suggests other important reasons to include collateral measures in adult studies: Reliance solely on self-report may underestimate the rates of occurrence, and it also offers an incomplete understanding of phenomenology. The role of irritable mood, for example, changes depending on the patient versus the collateral's point of view, and self-report probably is further moderated by the state of insight. Behavioral genetics studies are beginning to find different heritabilities for self- versus parent- or teacher-reported traits (Faraone, Tsuang, & Tsuang, 1999; Hudziak et al., 2003), probably precisely because of these issues of informant perspective.
A broad survey of the field also identifies places where it would be profitable to ask similar questions at different ages, even with cohort-based analyses. The high rate of comorbidity between bipolar disorder and ADHD in pediatric samples has been replicated across research groups and methods (Kowatch et al., 2005; Youngstrom, Youngstrom, & Starr, 2005), but the rate of comorbidity in adult epidemiological and clinical samples is virtually unknown, because adult studies have until recently not formally assessed ADHD. The few published rates in adult samples are also likely to be less sensitive to ADHD because they rely primarily on retrospective report over long time frames (e.g., Kessler et al., 2005; Kogan et al., 2004), and because self-report is dramatically less valid than parent or teacher report as a modality for detecting ADHD (Pelham, Fabiano, & Massetti, 2005). Conversely, the relationship between PBD and both adaptive and nonadaptive personality variables is obscured because of discontinuities in assessment strategies: Axis II symptoms and related dimensions are almost never assessed in pediatric samples (cf. Kasen et al., 2001), and measures of “temperament” are not isomorphic with measures of “personality” (Shiner, 1998).
Without employing consistent methods, there is no fulcrum against which to leverage developmental models that might inform lingering questions, such as what adult investigators describe as the ambiguous relationship between bipolar disorder (especially rapid cycling variants) and borderline personality disorder (Benazzi & Akiskal, 2005; Deltito et al., 2001; O'Connell, Mayo, & Sciutto, 1991). Here, too, the use of similar methods to ask related questions is likely to expose considerable developmental continuity (Kutcher, Marton, & Korenblum, 1990; Kwapil et al., 2000; MacKinnon & Pies, 2006). The use of instruments such as the GBI is promising not only because it offers similar instrumentation across age cohorts, but also because the consistency of findings so far suggests that the models of underlying processes developed and validated in adults will be profitable avenues for pediatric research as well. Specifically, the nomothetic network linking GBI dimensions of hypomanic/biphasic and depressive symptoms to constructs such as the Behavioral Facilitation System or Behavioral Activation System and the Behavioral Inhibition System (Depue & Lenzenweger, 2001) suggests that the Gray–Quay model of psychopathology has strong relevance for PBD. Studies looking at biological markers such as dopamine and cortisol functioning have a high probability of illuminating risk and process mechanisms in younger ages as well (Depue & Collins, 1999; Depue, Kleiman, Davis, Hutchinson, & Krauss, 1985).
Another line of inquiry suggested by the overview involves having raters with prior experience working with different age groups produce ratings of symptoms and mood severity based on the same interview, perhaps by teleconferencing or videotape. This model was productive in establishing similarities and differences in Continental versus American conceptualizations of schizophrenia (Zubin & Gurland, 1977), and would probably be equally helpful in resolving uncertainties about perceived discontinuities in presentation. Alternately, statistical models are now available that enable comparison of symptoms across age groups in large samples, allowing for recognition of differences in severity and changes in the connection between a particular symptom and the latent trait (Embretson & Reise, 2000). Multigroup Item-Response Theory models could use items from the YMRS, the GBI, or other instruments with large samples available at different age cohorts, in order to examine possible differences in symptom patterns.
Overall, the differences in methodology employed across age groups seem to overshadow developmental differences in the manifestation and correlates of bipolar disorder. When similar methods are brought to bear, then a largely consistent picture comes into focus. Current differences in methods also point the way towards a next wave of research, where cross-pollination should lead to rapid progress in the integration of research on bipolar disorder across the life cycle.
Recommendations
It is important that clinician judgment remain a component of research diagnosis and clinical case formulation. At the same time, even when using a standardized instrument, clinicians could form biased judgments about bipolar disorder, so parent and self-report should always be considered as well.
Research to date indicates that of all collateral informants, parents are the ones to pay attention to when the diagnostic consideration is bipolar disorder. Teacher and self-report are a distant second place and, at least with the state of the art instruments, either provides little incremental validity when a familiar parent's impressions are available.
Teachers and youth reports may still be useful. Given the reality that most clinical referrals are parent driven, it is no surprise that parent measure scores are higher than those from other informants. However, when parent report is unavailable (e.g., detention settings), cross-informant data will tend to prove useful.
The CBCL externalizing scale is sensitive to bipolar disorder (i.e., most cases will score high on it), but it is not specific to bipolar disorder (i.e., many cases will score high for reasons besides having bipolar disorder). The same appears true for the various “bipolar profiles” of scores derived from the CBCL. Thus, the CBCL is useful for identifying possible cases of bipolar disorder for further testing, but it should not be used in isolation to identify cases clinically or for research purposes. Bipolar-specific scales, such as the PGBI and P-MDQ will provide more specificity, while maintaining similar levels of sensitivity.
When evaluating the usefulness of a measure with respect to diagnostic efficiency, it is not enough to consider a single cut score. Rather, it is increasingly evident that, as base rates vary across settings, the LR approach gives test scores more meaning, because it enables estimation of the accuracy of the test result in each setting.
For any of the available assessment tools, a positive result should not be treated as if it were a definite diagnosis of bipolar disorder. Instead, “screen positives” should trigger more thorough and careful clinical evaluation.
Family history of illness and treatment response is an important domain for assessment.
The developmental continuity between what is being called PBD and the recognized adult version remains unclear. Ongoing longitudinal studies will continue to consider whether there are qualitative differences between the two phenomena. Emerging evidence suggests that complicated pediatric presentations will persist often into adolescence or young adulthood, without becoming more “classic” in bipolar presentation. This may actually represent homotypic continuity that has been obscured by changes in the diagnostic labels used with children versus adults experiencing the same symptoms of mood dysregulation.