Soil structure is a significant factor affecting soil function. It regulates a wide range of vital activities that enable plant and animal life to thrive while maintaining environmental quality in soil. Moreover, it also regulates soil water retention and infiltration, gas exchange, storage and release of soil organic carbon and nutrients (Neira et al., Reference Neira, Ortiz, Morales and Acevedo2015). Soil structure and function also impact the habitats of a plethora of soil microorganisms, fostering their diversity and controlling their activities (Glenn & Dilworth, Reference Glenn, Dilworth, Wright, Baligar and Murrmann1991). Soil function is inextricably linked to soil quality, emphasizing the multiple functions of soil and its chemical, physical and biological properties (Bünemann et al., Reference Bünemann, Bongiorno, Bai, Creamer, De Deyn and de Goede2018). In addition to environmental and economic performance, the main ecological functions of soils are water storage and filtration, biomass production, nutrient storage and recycling, carbon storage and as habitats for biological activity (Kome et al., Reference Kome, Enang, Tabi and Yerima2019; Arthur et al., Reference Arthur, Tuller, Moldrup and de Jonge2020). However, soil structural damage has become a focus in terms of global environmental problems with the increase of industrial and urban pollution and pesticide varieties. Therefore, there is an urgent need to develop materials that improve soil structure and function and enhance the sustainable use of soil.
Clay minerals that occur naturally in soils are essential for soil function. Generally, soils contain 15–25% clay minerals, with those of particle sizes which are <2 μm being the most beneficial for soil function (Newman, Reference Newman1984; Churchman, Reference Churchman2010). Clay minerals in these soils provide adequate soil surface to interact with water and nutrients and form spatial structures that are conducive to farming and root growth (Newman, Reference Newman1984). Soils containing 30–35% clay minerals tend to take on the properties of the clay minerals themselves. Although excess clay minerals can give soils some unfavourable properties, they contribute significantly to the structure and properties of soils. Clay minerals contribute to soil functions through their properties and extensive inner and outer surfaces, especially the inner surface. In soils, clay minerals mainly have negatively charged surfaces and smaller particle sizes and larger surface areas than other soil particles. Hence, most solutes in soils are positively charged and adsorb spontaneously to the surfaces of clay mineral particles. A larger surface area results in more minerals adhering to the clay mineral particles. The ability of soil clay minerals to adsorb chemicals (e.g. cations, water and organic molecules) is dependent on the extent of these surfaces (Churchman, Reference Churchman2018; Churchman et al., Reference Churchman, Singh, Schapel, Sarkar and Bolan2020). Clay minerals play an important role in various fields, from research to industry, due to their unique physical structures and chemical characteristics (Dong et al., Reference Dong, Ren, Sun, Li, Zhang and Kong2019, Reference Dong, Ren, Sun, Li, Zhang and Kong2020; Yang et al., Reference Yang, Gao and Yang2021). Moreover, the physicochemical properties of clay minerals in natural soils are determined mainly by their sheet/aggregate structures, cation-exchange capacities (CECs) and adsorption abilities, which also determine their significance in various fields of application (Wang et al., Reference Wang, Li, Shi, Jin, Sun and Zhang2013; Churchman & Velde, Reference Churchman and Velde2019; Rahmani et al., Reference Rahmani, Hazzab, Aimer, Ghenaim and Terfous2020). Hence, the management and modification of intrinsic clay minerals are growing research areas.
Different clay minerals are classified based on the existence of tetrahedral and octahedral layers in their structure. In highly weathered regions, most soils contain 1:1 clay minerals (mainly kaolinite) that have small CECs and surface areas; 2:1 swelling or expandable clay minerals are composed mainly of montmorillonite and vermiculite, both of which have large specific surface areas (SSAs) and CECs (Kome et al., Reference Kome, Enang, Tabi and Yerima2019). These clay minerals play an important role in determining the structure and function of soils. According to Schulten & Leinweber (Reference Schulten and Leinweber2000), the physical and chemical properties of clay minerals, including their charge density, surface area, CEC, dispersion and expansibility, affect their aggregation significantly. Clay minerals play a prominent role in stable microaggregate formation, which greatly influences nutrient adsorption and availability in soils (Asano & Wagai, Reference Asano and Wagai2014; Hernandez-Soriano et al., Reference Hernandez-Soriano, Dalal, Warren, Wang, Green and Tobin2018; Krause et al., Reference Krause, Rodionov, Schweizer, Siebers, Lehndorff and Klumpp2018; Totsche et al., Reference Totsche, Amelung, Gerzabek, Guggenberger, Klumpp and Knief2018). Moreover, clay minerals have large and mainly negatively charged surfaces, thus retaining and releasing some cationic nutrients into the environment under appropriate conditions (Newman, Reference Newman1984; Firmano et al., Reference Firmano, Melo, Montes, de Oliveira Junior, de Castro and Alleoni2020). Therefore, clay minerals control the availability of soil nutrients through influencing the physical, chemical and biological processes involved in nutrient storage and release (Kome et al., Reference Kome, Enang, Tabi and Yerima2019). Furthermore, soil organic carbon (SOC) is both a source and sink of plant nutrients. Soil is the largest terrestrial pool of organic carbon (OC), and ~80% of OC active in the carbon cycle is stored within soil networks (Kome et al., Reference Kome, Enang, Tabi and Yerima2019). Clay minerals are the most reactive fraction for forming long-lasting associations with OC in soils (Churchman, Reference Churchman2010, Reference Churchman2018; Sarkar et al., Reference Sarkar, Singh, Mandal, Churchman, Bolan, Garcia, Nannipieri and Hernandez2018; Singh et al., Reference Singh, Sarkar, Sarkar, Churchman, Bolan and Mandal2018). Many studies have demonstrated the importance of clay minerals in the sequestration and preservation of OC in soils, and the addition of clay minerals to soils can enhance the storage of carbon (Vogel et al., Reference Vogel, Mueller, Höschen, Buegger, Heister and Schulz2014, Reference Vogel, Heister, Buegger, Tanuwidjaja, Haug, Schloter and Kögel-Knabner2015; Hong et al., Reference Hong, Chen, Fang, Algeo and Zhao2019). This is due to the correlation between SOC content and soil clay mineral properties, including the amount of clay minerals and CEC (Chotzen et al., Reference Chotzen, Polubesova, Chefetz and Mishael2016; El-sayed et al., Reference El-sayed, Khalaf, Gibson and Rice2019). Moreover, clay minerals also play an important role in soil biological activity. At present, the investigation of mineral–microbe interactions is still in its infancy (Cuadros, Reference Cuadros2017). Developing clay minerals and modified clay minerals as suitable materials to improve soil structure and function is progressing rapidly, but it is not yet mature. The lack of understanding of the microstructures of clay minerals and their underlying mechanisms in complex soil environments hinders their application to soil improvement.
The present review introduces the structural and functional modification techniques of various clay minerals, and the advantages of clay mineral materials in soil structure and function improvement are discussed in terms of the physicochemical properties of clay minerals. Clay minerals are indicators of soil structure and function (Blanco & Lal, Reference Blanco and Lal2010). A proper understanding of clay minerals holds important practical significance for soil structure and function, soil fertility and the bioavailability of heavy metals in soils (Scherer et al., Reference Scherer, Feils and Beuters2014; Kim et al., Reference Kim, Yoon, Kim, Yang, Owens and Kim2015; Moterle et al., Reference Moterle, Kaminski, dos Santos Rheinheimer, Caner and Bortoluzzi2016). Currently, the importance of clay minerals in nutrient dynamics in agroecosystems is only acknowledged marginally in many soil research studies (Conti et al., Reference Conti, de la Horra, Effron and Zourarakis2001). However, the influence of clay minerals, including clay minerals in soils and added clay minerals, on soil ecosystems is significant. Soil clay minerals influence the physical properties and conditions that control the soil/water balance (Tisdall & Oades, Reference Tisdall and Oades1982; Karathanasis, Reference Karathanasis1989). Following this, recent advances in the synthesis and application of clay-mineral materials to soil structure and function improvement are reviewed, focusing on areas such as soil structure, soil fertility, plant growth and soil microbial activity. Furthermore, the application of clay minerals as soil carbon sequestration materials is also introduced. Finally, we discuss the current issues and challenges facing the application of clay-mineral materials to soil improvement and highlight the key technologies and development trends for the future. This review provides some guidance for ongoing theoretical work on clay mineral materials in sustainable agricultural development and applications.
Clay minerals regulate the structure and function of soil
Clay minerals affect soil structure and function mainly through their physicochemical properties, such as soil pH values, fertility, nutrient availability, SOC retention and stability, microaggregate formation and the number and activity of soil microorganisms (Fig. 1). As indicated in Fig. 1, clay minerals control the availability of nutrients and the physical, chemical and biological processes involved by regulating the release and circulation of nutrient elements in soil solutions. Therefore, a comprehensive understanding of the effects of clay-mineral materials on soil structure and properties is essential in terms of managing soil ecosystems adequately. The use of clay minerals as possible materials for regulating the structure and function of soils has been investigated extensively. This paper reviews the progress in research over the last decade on the effects of clay minerals and their modified materials on soil structure and function.
Role of clay minerals in soil physical properties and nutrient supply and availability (reprinted with permission from Delgado & Gómez, Reference Delgado, Gómez, Villalobos and Fereres2016).

Kaolinite
Various scientists have conducted many studies to explore the effects of the physicochemical characteristics of kaolinite on the structure and function of soils, focusing on soil fertility, usability and productivity. Kaolinite, as a non-expansive variable-charge crystalline clay mineral, has a low CEC and a low SSA, which reduce the stability of aggregates (Schulten & Leinweber, Reference Schulten and Leinweber2000). Churchman et al. (Reference Churchman, Singh and Marchuk2018) used simulations to determine that that the SSA and CEC of soil kaolinites were invariably greater than those of conventional kaolinites. In addition, the mineral's ability to prevent soil-water repellence is due to its large surface area and superior surface chemistry, as demonstrated by Daniel et al. (Reference Daniel, Uddin, Harper and Henry2019) in laboratory-scale studies. Problems with soil-water retention affect large areas of farmland and native land across the globe. Diamantis et al. (Reference Diamantis, Pagorogon, Gazani, Gkiougkis, Pechtelidis and Pliakas2017) used field experiments to examine the role of kaolinite additives in water retention and repellence of sandy soils, indicating that the application of kaolinite can mitigate the phenomenon of soil water repellence effectively. Moreover, porewater has a significant influence on the compressibility of soils, which in turn affects the stability of soil structures. Gratchev & Towhata (Reference Gratchev and Towhata2016) compared the behaviour of undisturbed and remoulded kaolinite samples to determine the influence of soil structure on consolidation properties. The results showed that the structure of kaolinite has a significant effect on soil compressibility. In contrast, biochar–kaolinite can increase the dispersibility of soils by amending the surface charge and colloidal dynamics of the clay mineral fraction (Mai et al., Reference Mai, Nguyen, Pham, Nguyen, Nguyen and Do2020). These studies show that the presence of kaolinite in soils contributes significantly to soil water retention, which indicates that kaolinite should be regarded as a natural product with soil structure-improvement applications.
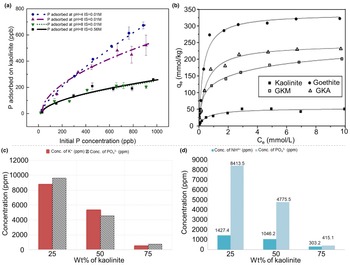
As a 1:1 phyllosilicate, kaolinite fixes phosphorus very effectively. According to Hao et al. (Reference Hao, Mänd, Li, Alessi, Somelar and Moussavou2021), kaolinite absorbed phosphorus strongly under acidic conditions, but it released phosphorus quantitatively under various pH conditions, indicating that kaolinite served as a carrier for phosphorus transfer (Fig. 2a). Moreover, Yan et al. (Reference Yan, Shi and Gong2018) found that kaolinite was transformed to illite (a 2:1 phyllosilicate) in ferralsols after applying mineral-soil regulators (K+, Mg2+ and Si4+). In addition, the observed trends of PO4 sorption competition suggested that the PO4 sorption capacity of the 2:1 clay mineral may be close to or even greater than the 1:1 clay mineral (Yan et al., Reference Yan, Shi and Gong2018). In soils, goethite and kaolinite often exist in binary association, influencing significantly the physical and chemical properties of soil. Hence, Wei et al. (Reference Wei, Tan, Liu, Zhao and Weng2014) found that the adsorption capacity of the goethite–kaolinite mixture (q max = 198.17 mmol g–1) for phosphate increased only slightly. That of the goethite–kaolinite association (q max = 230.24 mmol g–1) increased significantly, indicating that the goethite–kaolinite association was a highly effective adsorbent for PO4 (Fig. 2b). However, the microscopic mechanism of phosphorus fixation by kaolinite is still unclear. Roshanravan et al. (Reference Roshanravan, Soltani, Rashid, Mahdavi and Yusop2015) reported that urea–kaolinite controlled-release products could be used for agriculture and agricultural production due to their high nutrient use efficiency, controllable soil solubility and potential economic benefits. In addition, Makó et al. (Reference Makó, Kristóf, Horváth and Vágvölgyi2009) and Al-Rawajfeh et al. (Reference Al-Rawajfeh, AlShamaileh and Alrbaihat2019) found that a mechanochemical process could be designed to synthesize amorphous kaolinite to be used as a sustained-release carrier of N, P and K nutrients to act as a fertilizer (Fig. 2c,d). The mechanochemical reaction allowed the intercalation of target materials in the kaolinite layer without changing its crystal structure and the layered double hydroxide (Makó et al., Reference Makó, Kristóf, Horváth and Vágvölgyi2009; Solihin et al., Reference Solihin, Tongamp and & Saito2010). One of the most significant properties of layered materials is their ability to insert various substances (atoms, ions or molecules) into the interlayer (de Castro et al., Reference de Castro, Ferreira, Eulálio, de Souza, Novais and Novais2018). Hence, the studies of interlayer reactions in kaolinite to understand the functioning of kaolinite represent a crucial research field.
(a) The adsorption of P onto kaolinite at four different environmental conditions including pH and ionic strength (IS) (reprinted with permission from Hao et al., Reference Hao, Mänd, Li, Alessi, Somelar and Moussavou2021). (b) Adsorption isotherms of phosphate by kaolinite, goethite, goethite–kaolinite mixture (GKM) and goethite–kaolinite association (GKA) as a function of KCl concentration (reprinted with permission from Wei et al., Reference Wei, Tan, Liu, Zhao and Weng2014, Elsevier B.V.). (c) Nutrient release profile of a kaolinite–KH2PO4 sample system with varying amounts of kaolinite (wt.%; reprinted with permission from Al-Rawajfeh et al., Reference Al-Rawajfeh, AlShamaileh and Alrbaihat2019, Elsevier B.V.). (d) Nutrient release profile of a kaolinite–(NH4)2HPO4 sample system at various amounts of kaolinite (wt.%; reprinted with permission from Al-Rawajfeh et al., Reference Al-Rawajfeh, AlShamaileh and Alrbaihat2019, Elsevier B.V.).

In soils, clay minerals are some of the most abundant and active inorganic colloids. They have specific surface electrical properties and affect significantly the activity of microorganisms. For example, the adsorption quantities of Pseudomonas putida on various clay mineral surfaces varies significantly (goethite > kaolinite > montmorillonite; Jiang et al., Reference Jiang, Huang, Cai, Rong and Chen2007). In addition, kaolinite can increase bacterial activity by providing essential mineral elements in soil solution (Stotzky, Reference Stotzky1986; Merino et al., Reference Merino, Iglesias, Mansilla, Casalongué and Alvarez2021). However, Wu et al. (Reference Wu, Chen, Rong, Cai, Dai and Huang2014) found that kaolinite inhibited significantly glucose decomposition by P. putida. The changes in the physicochemical properties of kaolinite, such as greater CEC and SSA, reduced the mortality rate of bacteria (Brennan et al., Reference Brennan, Moynihan, Griffiths, Hillier, Owen, Pendlowski and Avery2014). Although these studies have focused on the effects of clay minerals on bacterial physiological activity, adhesion, growth and survival, there are still critical gaps in our exploration of the interactions between functional cells and clay minerals.
In terrestrial ecosystems, SOC (nearly 80% C) plays a major and active role in the global carbon cycle (Singh et al., Reference Singh, Sarkar, Biswas, Bolan and Churchman2017). The decomposition of SOC is controlled largely by microbial activities that are affected by clay minerals directly or indirectly (Hao et al., Reference Hao, Nianpeng, Shenggong, Guirui, Yang and Ruomeng2016; Xu et al., Reference Xu, Liu, Yao, Zhang, Zhang and He2022). Therefore, understanding the interactions between clay minerals and SOC is crucial to our understanding of soil ecology, requiring immediate research attention. Some investigators have proposed several adsorption mechanisms of SOC on clay minerals, such as electrostatic interactions, hydrophobic effects and ligand exchanges (Lee et al., Reference Lee, Park, Fenter, Sturchio and Nagy2010; Han et al., Reference Han, Sun, Jin and Xing2016; Chen et al., Reference Chen, Koopal, Xiong, Avena and Tan2017). In the aqueous phase, various mechanisms may operate simultaneously to varying degrees due to polydisperse and multifunctional SOC and the various charge properties of clay surfaces (Chen et al., Reference Chen, Koopal, Xu, Wang and Tan2019). Based on kaolinite's properties, Chen et al. (Reference Chen, Koopal, Xiong, Avena and Tan2017) calculated the contribution of humic acid (HA) groups adsorbed on kaolinite minerals to determine their adsorption mechanisms and found that most HA tends to adsorb on the kaolinite siloxane plate faces through hydrophobic effects. Moreover, the aliphatic components of HA are more easily adsorbed on the surface of kaolinite than the aromatic components (Wang & Xing, Reference Wang and Xing2005; Ghosh et al., Reference Ghosh, Wang, Kang, Bhowmik and Xing2009), and kaolinite was associated strongly with polysaccharide compounds (Singh et al., Reference Singh, Sarkar, Biswas, Churchman and Bolan2016). Although kaolinite has a weak interaction with SOC among clay mineral species, kaolinite modification materials have advantages due to the adjustability of their structures.
Halloysite
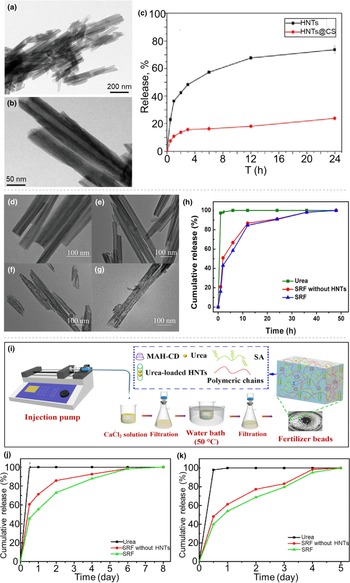
Although halloysite and kaolinite have similar structures with SiO4 tetrahedral layers and AlO6 octahedral layers, there is little research on soil improvement using halloysite. Halloysite as a carrier has been used widely in the loading and controlled release of various reagent molecules. Currently, there are almost no reports on halloysite as a carrier of active compounds in soil applications. Wang et al. (Reference Wang, He, Liu, Zhou, Jiao and Li2020) synthesized halloysite–chitosan, a potential fertilizer carrier or controlled-release vector, to improve nutrient availability (Fig. 3a–c). Wei et al. (Reference Wei, Wang, Chu and Li2019) and Shen et al. (Reference Shen, Wang, Li, Liu, Liu, Wei and Li2020) synthesized urea-loaded halloysite-composite fertilizers, which improved the urea release and water retention properties of soils, indicating that the added functionality of the halloysite improved significantly the performance of the fertilizer (Fig. 3). Gray-Wannell et al. (Reference Gray-Wannell, Holliman, Greenwell, Delbos and Hillier2020) documented the adsorption properties of phosphate on halloysite (7 Å) nanotubes and investigated the effects of varying the morphology and surface area of halloysite nanotubes on phosphate adsorption capacity. Moreover, the addition of composts containing halloysite improves soil chemical properties and nutritional status, increasing the total contents of primary nutrients such as Ca, K, P and S (Medina et al., Reference Medina, Calabi-Floody, Aponte, Santander, Paneque and Meier2021). Liuskanto (Reference Liuskanto2015) found that the retention rates of phosphate (57%), nitrate (14%) and potassium (16%) were all improved when halloysite was added to peat. The addition of halloysite retained phosphorus best out of these three elements. However, the reasons for such retention need to be studied further.
Transmission electron microscopy images of (a) halloysite (Hal) nanotubes (HNTs) and (b) Hal–chitosan (Hal@CS) and (c) release of urea from Hal and Hal@CS (reprinted with permission from Wang et al., Reference Wang, He, Liu, Zhou, Jiao and Li2020, Elsevier B.V.). Transmission electron microscopy images of (d) Hal, (e) 2A-Hal, (f) 4A-Hal and (g) 6A-Haland (h) release behaviour of urea, slow-release fertilizers (SRFs) without Hal and fertilizers with Hal in distilled water (reprinted with permission from Wei et al., Reference Wei, Wang, Chu and Li2019, Elsevier B.V.). (i) The preparation process and schematic of the double network structure of the water-release fertilizers. Release of urea by the water-release fertilizers without Hal and the water-release fertilizers with Hal in (j) distilled water and (k) soil (reprinted with permission from Shen et al., Reference Shen, Wang, Li, Liu, Liu, Wei and Li2020, Elsevier B.V.). MAH-CD = polymerizable β-cyclodextrin; SA = sodium alginate.

It has been shown that microorganisms regulate the formation of halloysite by promoting the deposition of Fe, Si and Al on its surface (Minyard et al., Reference Minyard, Bruns, Martínez, Liermann, Buss and Brantley2011). However, little research has been conducted on the effects of halloysite on bacteria in the soil. Kadmiri et al. (Reference Kadmiri, El Mernissi, Azaroual, Mekhzoum, Qaiss and Bouhfid2021) prepared halloysite–alginate to explore the influence of the clay mineral on the survival and activity of bacteria and their influence on wheat plants, aiming to produce low-cost, efficient and slow-release bacterial fertilizer capsules. There has been little research on halloysite as an additive in soil for purposes such as agriculture or growing platforms to retain moisture and nutrients in soils. It is important to understand whether and how halloysite minerals affect the structure and properties of soils.
Montmorillonite
Montmorillonite is one of the main mineral components of clay soils. As mentioned previously, the swelling potential of soil depends upon its mineralogical constitution. In the presence of montmorillonite minerals, the soil is able to shrink and swell due to the formation of diffuse double layers and flocculation (Sridharan & Prakash, Reference Sridharan and Prakash1999). Physical properties such as montmorillonite content, CEC and SSA are the essential characteristics that control the thermohydromechanical behaviour of expansive soils (Mehta & Sachan, Reference Mehta and Sachan2017). Moreover, many researchers have found the swelling phenomenon of soils to be due to the montmorillonite content in their clay minerals (Abdullah et al., Reference Abdullah, Dawood, Awad and Agila2009; Chittoori et al., Reference Chittoori, Puppala and Pedarla2018; Pandya, Reference Pandya2018). At low salinities, further expansion of montmorillonite eventually results in complete delamination into monolayers (Tester et al., Reference Tester, Aloni, Gilbert and Banfield2016). It is worth mentioning that it is difficult to determine the major clay minerals present in soils from the free expansion ratio alone due to the diffuse double-layer repulsion effect of montmorillonite and the flocculation effect of kaolinite (Prakash & Sridharan, Reference Prakash and Sridharan2004; Reddy et al., Reference Reddy, Mohanty and Rao2020). In addition, Lerma et al. (Reference Lerma, Palencia and Combatt2018) synthesized granular montmorillonite–poly(acrylic acid) composites with high ionic retention capacities (108–194 and 263–313 meq 100 g–1 for major and minor elements, respectively), high water absorption capacities (273–568%) and high CECs (124–666 meq 100 g–1). The high-performance modified montmorillonite composites have structural components similar to soil particles, and these montmorillonite materials might be used for the structural mimicry and functional architecture of the humified structure of soils. A comprehensive evaluation of soil quality and water dynamics also provides essential information for soil improvement. Zhen et al. (Reference Zhen, Zheng, He, Han and Zhang2016) and Jia et al. (Reference Jia, Zhang, Yang and Zhang2018) showed that montmorillonite-enriched siltstone could increase significantly the water-holding capacity in soils. However, these studies are based on laboratory simulations. Zhang et al. (Reference Zhang, Zhen, Cui, Zhang and Zhang2020) applied the montmorillonite-enriched material as an addition in a field experiment to evaluate the influence of such additions on soil functions, including on the soil water content dynamic, plant growth and water use. Furthermore, modifications of montmorillonite were demonstrated to improve soil sustainable remediation capabilities and to ensure long-term agricultural sustainability (Zhang et al., Reference Zhang, Qiu, Qiu and Zhang2014; Yang et al., Reference Yang, Li, Lu, Wang, Zhu, Ding and Wang2016). However, the study of the mineralogy and microstructure of expansive soils treated with montmorillonite is still limited.
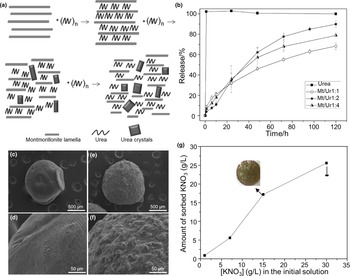
Montmorillonite is a hydrated aluminium silicate with a layered structure. Exchangeable cations balance the negative charge on the surface in the interlayer space. Therefore, cationic compounds tend to insert into the interlaminar space of montmorillonite, forming dispersed complexes (Wang et al., Reference Wang, Juang, Lee, Hsu and Lee2004). The mechanochemical intercalation of compost in clay layers is demonstrated by the variation of montmorillonite spacing, which results in a slow-release pattern of nutrients (Souza et al., Reference Souza, Chiaregato and Faez2018; Messa et al., Reference Messa, Souza and Faez2020). Hence, montmorillonite has been used widely as a filler to improve various properties of fertilizers. Some attempts made to encapsulate urea into montmorillonite have been reported previously. The nanohybrid montmorillonite composite can be used as an environmentally friendly fertilizer that could be applied widely to solve the global problem of low nitrogen use efficiency in agriculture (Fig. 4a,b; Pereira et al., Reference Pereira, Minussi, Cruz, Bernardi, Ribeiro, Luiz and Luiz2012; Kottegoda et al., Reference Kottegoda, Sandaruwan, Perera, Madusanka and Karunaratne2015; Madusanka et al., Reference Madusanka, Sandaruwan, Kottegoda, Sirisena, Munaweera and De Alwis2017).
(a) Scheme of the proposed path for urea intercalation in the extrusion process. (b) Release rate of urea as a function of time for pure urea and each of the composites at pH 7 and room temperature (reprinted with permission from Pereira et al., Reference Pereira, Minussi, Cruz, Bernardi, Ribeiro, Luiz and Luiz2012, American Chemical Society). Field emission gun–scanning electron microscopy images of (c & d) chitosan microspheres and (e & f) ChMMt33 microspheres. (g) Effect of the initial concentration on the K-content microspheres (reprinted with permission from dos Santos et al., Reference dos Santos, Bacalhau, Pereira, Souza and Faez2015, Elsevier Ltd). Mt/Ur = weight ratio of montmorillonite and urea.

Moreover, montmorillonite provides excellent sorption properties because of its rough and porous surface. Because of these properties, large amounts of fertilizer can be adsorbed onto chitosan–montmorillonite microparticles. dos Santos et al. (Reference dos Santos, Bacalhau, Pereira, Souza and Faez2015) and Messa et al. (Reference Messa, Souza and Faez2020) prepared a novel fertilizer-loaded chitosan–montmorillonite, which was applied for prolonged potassium nitrate release in soils (Fig. 4c–g). Adding montmorillonite minerals is a promising alternative for improving specific properties, such as increased adsorption capacity for water and compounds. The synthesis of hydrochar–montmorillonite nanocomposites through hydrothermal carbonization of glucose in the presence of montmorillonite is an example of obtaining fit-for-purpose materials using biomass from photosynthesis (Yuan et al., Reference Yuan, Wei and Theng2021). The use of montmorillonite minerals is justified because they are low-cost, readily available and environmentally friendly, making them suitable for extensive agriculture applications. Another difficulty is the need to monitor fertilizer release in soils. Typically, synthetic fertilizer is added to soils, and a certain amount of soil is processed and tested at specified intervals to determine the amount of fertilizer released, which is a time-consuming and difficult experimental programme. Most such studies have been carried out based on laboratory simulation, so it is necessary to conduct large-scale field experiments to study the slow-release effect of montmorillonite-additive fertilizers.
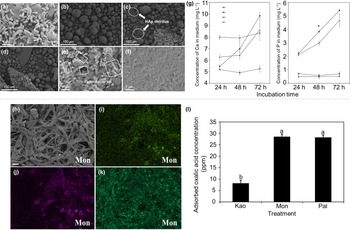
Montmorillonite plays a vital role in influencing soil pH value, CEC and water-holding capacity, and these are also important factors determining soil bacterial diversity. Therefore, montmorillonite minerals can alter the soil environment and affect microbial activity and population dynamics (Ding et al., Reference Ding, Pronk, Babin, Heuer, Heister, Kögel-Knabner and Smalla2013). Studies have demonstrated that montmorillonite minerals facilitate the growth of microorganisms that protect bacteria from malign metals (Ugochukwu et al., Reference Ugochukwu, Jones, Head, Manning and Fialips2014b; Ruan et al., Reference Ruan, Wu, Lai, Wang, Li and Chen2018). In fact, the large adsorption capacity and surface area of montmorillonite maintain the development and stability of microbial populations and microaggregates (Kögel-Knabner et al., Reference Kögel-Knabner, Guggenberger, Kleber, Kandeler, Kalbitz and Scheu2008). In addition, the interaction between montmorillonite and microorganisms can control the transport of metals and organic molecules (Biswas et al., Reference Biswas, Chakraborty, Sarkar and Naidu2017; Li et al., Reference Li, Zhou, Fiore and Yu2019). These interactions are related closely to the transformation of montmorillonite minerals, soil development and the cycling of various elements (Liu et al., Reference Liu, Dong, Bishop, Zhang, Wang and Xie2012; Dai et al., Reference Dai, Zhao, Dong, Wang and Huang2014). For example, Su et al. (Reference Su, Han, Wu, Yan, Lv and Tian2019) studied the release and sorption of phosphorus and the bacterial activity influenced by montmorillonite and phosphate-solubilizing bacteria (Fig. 5a–g). Zhang et al. (Reference Zhang, Hu, Han, Wu, Tian and Su2019b) investigated the complex impacts of montmorillonite minerals and Aspergillus niger on phosphorus release and found that montmorillonite could enhance microbial activities and drive phosphorus transport with the support of fungi in the ecosystem (Fig. 5h–l). Moreover, the adsorption of microorganisms on the surface of montmorillonite and the subsequent encapsulation of active microbial biomass on montmorillonite have important effects on SOC storage (Konhauser et al., Reference Konhauser, Owttrim, Hodgson, Warchola, Mloszewska and Sutherland2017). In soil-systems, clay-mineral compositions can influence the incidence, growth and biochemical activity of microorganisms. Correlations between montmorillonite minerals and microbial activity have been presented, but the effects of clay minerals on microbial bioactivity have not attracted sufficient attention in soil nutrient utilization research.
SEM images of the precipitates collected from various treatments. (a) Enterobacter sp. (San) cells were adsorbed on the montmorillonite (Mt) surface in beef extract peptone medium after 24 h of incubation (the initial composite before the treatment of San + hydroxylapatite (HAp) + Mt). Morphology of HAp particles in (a) control treatment, (b) San + HAp, (c) Hap + Mt and (d) San + HAp + Mt. Morphology of San adsorbed on the surface of Mt in San + HAp + Mt at (e) 24 h and (f) 72 h of incubation. (g) Concentrations of Ca and P analysed using inductively coupled plasma during 72 h of incubation (n = 3). A statistical analysis of P concentration was performed between San + HAp and San + HAp + Mt at the same incubation times, and the asterisk indicates a significant difference at p < 0.05 (reprinted with permission from Su et al., Reference Su, Han, Wu, Yan, Lv and Tian2019, Elsevier B.V.). (h) SEM images of Aspergillus niger after 5 days of incubation with montmorillonite (Mon) (scale bar represents 10 μm). Energy-dispersive spectrometry showed the chemical distribution of (i) Al, (j) Si and (k) P in the presence of various clay minerals. (l) The acid sorption (pure oxalic acid at 50 ppm) ability of kaolinite (Kao), montmorillonite (Mon) and palygorskite (Pal) based on high-performance liquid chromatography analysis. Different lower-case letters indicate significant differences among the treatments (p < 0.05) (reprinted with permission from Zhang et al., Reference Zhang, Hu, Han, Wu, Tian and Su2019b, Elsevier B.V.).

Several studies have investigated the relationships between the structural properties of montmorillonite and its function in stabilizing SOC through interface adsorption (Saidy et al., Reference Saidy, Smernik, Baldock, Kaiser, Sanderman and Macdonald2012, Reference Saidy, Smernik, Baldock, Kaiser and Sanderman2013; Kleber et al., Reference Kleber, Eusterhues, Keiluweit, Mikutta, Mikutta and Nico2015; Sodano et al., Reference Sodano, Said-Pullicino, Fiori, Catoni, Martin and Celi2016). The characteristics of montmorillonite such as its SSA and CEC have a positive relationship with SOC adsorption (Kahle et al., Reference Kahle, Kleber and Jahn2004). Montmorillonite generally has a larger CEC than kaolinite, having great potential to adsorb positively charged metal ions such as Fe ions (Greenland, Reference Greenland1971). Hence, montmorillonite-based materials have better adsorption and stabilization capacities for SOC than kaolinite-based materials (You et al., Reference You, Zhu-Barker, Doane and Horwath2022).
The HA and montmorillonite aggregation process can be described as follows: HA and montmorillonite draw close to each other under the action of long-range van der Waals forces, and then short-range actions at the interface make the aggregation of the particles more stable (Gao et al., Reference Gao, Xu, Li, Li, Tian and Li2021). Several studies have indicated that montmorillonite promoted the incorporation and physical protection of SOC through the formation of microaggregates (Angst et al., Reference Angst, Mueller, Cajthaml, Angst, Lhotáková and Bartuška2017; Vidal et al., Reference Vidal, Hirte, Franz Bender, Mayer, Gattinger and Höschen2018, Reference Vidal, Watteau, Remusat, Mueller, Nguyen Tu and Buegger2019). When SOC was sequestered in the presence of montmorillonite, more root-derived carbon was released within the rhizospheric soil, which could improve the long-term storage of OC (You et al., Reference You, Zhu-Barker, Doane and Horwath2022). Moreover, the presence of Fe also controlled the stability of the adsorbed SOC in montmorillonite. The surface charge of montmorillonite remains negative if a limited amount of Fe is adsorbed. The adsorption of SOC to Fe-treated montmorillonite is believed to occur via non-coulombic mechanisms or cation bridging (You et al., Reference You, Zhu-Barker, Doane and Horwath2022). Another study claimed that montmorillonite and HA combined together to form a sandwich structure with Ca2+ in the middle, resulting in a stabilization effect (Gao et al., Reference Gao, Yang, Tian, Ding, Hu, Liu and Li2015). As a result, different types of ions would lead to different HA fixation mechanisms, resulting in different interactions and aggregation phenomena. Therefore, it is necessary to examine systematically the effects of divalent cation additives on the binding mechanisms of HA to clay minerals.
Vermiculite
Vermiculite is an excellent soil-water regulator, and its good air permeability and water permeability have positive effects on root development, which can be of use in hydroponic agriculture and soil conditioning. When added to soils, it regulates soil water, air capacity and heat balance, resulting in favourable conditions for plant nutrition. Vermiculite is usually used to improve the structure and air permeability of heavy clay soils and the water retention of light sands (Marinova et al., Reference Marinova, Toncheva, Zlatareva and Pchelarova2012). Vermiculite, a 2:1 swelling or expandable clay mineral, has a large SSA and high CEC, which dictate the suitability and behaviour of soils for various land applications (Kome et al., Reference Kome, Enang, Tabi and Yerima2019). Vermiculite is a layered silicate that holds many essential nutrients such as Ca2+, Mg2+, K+ and Na+ in cation form (Kumari & Mohan, Reference Kumari, Mohan and Do Nascimento2016). This is because vermiculites with large permanent layer charges and large CECs can retain ammonium and potassium ions in soils (Nieder et al., Reference Nieder, Benbi and Scherer2011; Zhang et al., Reference Zhang, Jiang, Miao, Yu, Xu and Cui2019a).
Moreover, vermiculites usually have a greater capacity for NH4+ fixation in soils than other clay minerals (Nieder et al., Reference Nieder, Benbi and Scherer2011; Wang et al., Reference Wang, Liao, Zhang, Li, Xia and Cao2011; Matocha et al., Reference Matocha, Grove, Karathanasis and Vandiviere2016). Raheb & Heidari (Reference Raheb and Heidari2012) found that the non-exchangeable potassium contents of montmorillonite-dominant soils were lower than those of vermiculite-dominant soils, and exchangeable potassium was correlated significantly with the clay-mineral content, OC and CEC. Similarly, Ghiri et al. (Reference Ghiri, Abtahi, Karimian, Owliaie and Khormali2011) observed that soil potassium could be released at a greater rate by expansive clay minerals, especially vermiculite. Therefore, it would be of great significance to evaluate the effects of vermiculite soils on NH4+- and K+-based fertilizer applications and crop nutrient utilization efficiency.
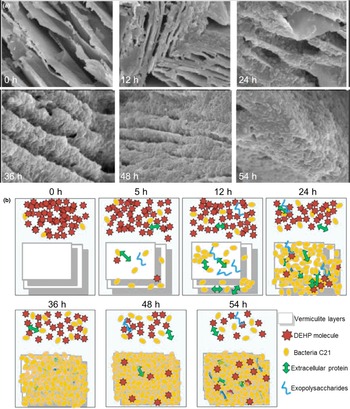
Several studies on the interaction between bacteria and vermiculite are concerned with soil environmental protection. According to Kang et al. (Reference Kang, Wu, Li, Bo, Li and Tran2015), the presence of vermiculite can promote the decomposition of glucose and bacterial reproduction and improve the biological reduction rate of Cr(VI). Vermiculite can also adsorb and degrade organic compounds by binding to microorganisms to form compounds (Wen et al., Reference Wen, Wu, Ren and Gao2016). The mechanism of di-(2-ethylhexyl) phthalate (DEHP) degradation by this bacterium adsorbed on vermiculite is shown in Fig. 6 (Wen et al., Reference Wen, Wu, Ren and Gao2016). Cells with extracellular polymers adsorb to the vermiculite surface, which forms the biofilm skeleton, and the cells proliferate slowly to form dense biofilms. The adsorption of vermiculite enhanced the mass transfer effect and increased the biodegradation rate. Moreover, adding vermiculite/fly ash mixtures increased significantly the number of fungi species, carbohydrate utilization by microorganisms and enzyme activity levels (Dong et al., Reference Dong, Shao, Xu, Liu, Xu and Hu2021).
Changes in the morphological structure of vermiculite during biofilm growth. (a) Biofilm formation observed using environment scanning electron microscopy (ESEM). (b) Proposed mechanism of di-(2-ethylhexyl) phthalate (DEHP) removal during biofilm formation on vermiculite (reprinted with permission from Wen et al., Reference Wen, Wu, Ren and Gao2016, Elsevier B.V.).

Similarly to montmorillonite, vermiculite has a large CEC and SSA. Thus, it exhibited a more significant adsorption capacity for SOC than kaolinite due to the formation of fulvic acid–vermiculite complex, which improved its interfacial affinity for non-polar compounds (Zhang et al., Reference Zhang, Xiang, Bao, Xiong and Liu2017). Vermiculite was used to reduce soil bulk density, increasing both SOC and crop yield (Pan et al., Reference Pan, Shang, Zhang, Chen and Cui2020). In fact, SOC stabilization in hydromorphic soils is controlled strongly by its adsorption onto Fe (hydr)oxide–vermiculite systems (Sodano et al., Reference Sodano, Said-Pullicino, Fiori, Catoni, Martin and Celi2016). In these soils, the frequent alternations in redox conditions lead to significant changes to the surface characteristics of vermiculite, which are important for the adsorption and desorption of SOC (Cucu et al., Reference Cucu, Said-Pullicino, Maurino, Bonifacio, Romani and Celi2014; Sodano et al., Reference Sodano, Said-Pullicino, Fiori, Catoni, Martin and Celi2016). Moreover, experiments have also shown that the formation of ‘Ca2+bridges’ between organic matter and aluminosilicate minerals improved the sorption of SOC to vermiculite, and the bridges reduced the bioavailability of SOC (Weng et al., Reference Weng, Koopal, Hiemstra, Meeussen and Van Riemsdijk2005; Mikutta et al., Reference Mikutta, Mikutta, Kalbitz, Scheel, Kaiser and Jahn2007). For example, peat-modified vermiculite was found to be able to improve SOC levels, optimizing soil–root microbial communities and increasing crop yield (Pan et al., Reference Pan, Shang, Zhang, Chen and Cui2020; Wu et al., Reference Wu, Liu, Shang, Liu, Liesack and Cui2022).
Natural vermiculite has a high CEC, making it especially useful for agricultural and ecological purposes. It contains calcium, magnesium, potassium, iron, silicon and other trace elements, which makes vermiculite a natural biological promoter of plant growth. At the same time, vermiculite is an excellent soil water regulator, and its good air permeability affects root development positively. Therefore, more attention should be paid to the use of vermiculite in agricultural practice and its effects on plant yields and soil properties.
Palygorskite
Palygorskite is characterized by an elongated microfibrous morphology, high magnesium content, low surface charge and high SSA. Due to its favourable adsorption properties and non-toxicity to soils and organisms, the dominant market for palygorskite is as an agricultural conditioner (Murray, Reference Murray2000). Soils containing palygorskite are found mainly in arid and semi-arid regions. Despite the fact that palygorskite is a significant component of soil composition, little is understood about how it affects soil properties. It is challenging to manage palygorskite soils in irrigated agriculture. Therefore, the effects of palygorskite on soil physicochemical properties have been studied. Water is a limiting factor for agriculture in arid regions because ecosystems store and release water rapidly, mainly through the soil as a medium, and palygorskite can perform this function (Galán, Reference Galán2011). Moreover, Fraser et al. (Reference Fraser, Churchman, Chittleborough and Rengasamy2016) studied the effects of palygorskite on the water available to plants in soils in arid regions. By determining plant water availability rather than total water capacity, Chirino et al. (Reference Chirino, Vilagrosa and Vallejo2011) revealed that palygorskite helps to store water in arid soils. It is necessary to study further whether the various water-holding capacities of palygorskites are related to their specific compositions.
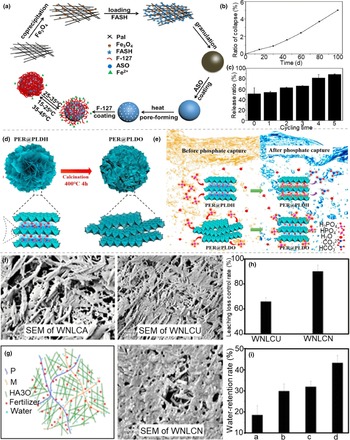
Palygorskite shows good adsorption performance and sustained-release effects due to its large SSA resulting from its fibre network structure. Palygorskite also contains many trace elements (e.g. Si, Al, Mg, Fe, K, Ca and Mn) beneficial to crop growth. It is a promising coating material for slow-release compound fertilizers (Xie et al., Reference Xie, Liu, Ni, Zhang and Wang2011). Several experiments have shown that palygorskite mixed with compound fertilizers or coatings has a positive impact in some crops (Fig. 7d,e; Yang et al., Reference Yang, Cheng, Lin, Liu and Hu2010; Guan et al., Reference Guan, Song, Gan and Li2014; Kong et al., Reference Kong, Tian, Wang, Li, Liu and Pang2019). A sustainable nitrogen fertilizer was developed using palygorskite as a matrix and ethylcellulose film, significantly reducing nutrient loss, increasing water-use efficiency and extending irrigation cycles in drought-prone settings (Ni et al., Reference Ni, Liu, Lü, Xie and Wang2011). Jiang et al. (Reference Jiang, Cai, He, Zhong, Wen, Zhang and Wu2015) produced a high-performance fertilizer containing palygorskite for repairing soil microenvironments. This fertilizer could decrease the salinity and alkalinity in soils significantly through pH adjustment and ion exchange. To meet the nutrient requirements of potatoes in their three main growth stages, palygorskite-coated fertilizers were prepared to promote fertilizer-use efficiency and to eliminate negative environmental impacts (Song et al., Reference Song, Guan, Wang, Zewudie and Li2014). Moreover, Chi et al. (Reference Chi, Zhang, Xiang, Cai and Wu2018) synthesized a core-shell structure temperature-controlled-release and collectable (i.e. conveniently retrievable from water and soil) iron fertilizer based on a palygorskite nanocomposite, which could improve iron fertilizer-use efficiency and absorption of Fe2+ (Fig. 7a–c). In addition, some studies have reported the synthesis of multifunctional controlled-release fertilizers using palygorskite and organic polymers. The products prepared using these simple and economical methods can improve the utilization efficiency of soil water and nutrients and control soil pH (Fig. 7f–I; Xie et al., Reference Xie, Liu, Ni, Zhang and Wang2011; Ni et al., Reference Ni, Lu and Liu2012; Wang et al., Reference Wang, Lü, Gao, Xu, Wei and Bai2014; Zhou et al., Reference Zhou, Cai, He, Zhong, Yu, Zhang and Wu2015). Despite recent advances regarding the effects of palygorskite on soil fertility, limited information is available on how the adsorption interactions of palygorskite translate into soil properties when palygorskite constitutes an important component of the soil clay mineral composition (Shirvani et al., Reference Shirvani, Khalili, Kalbasi, Shariatmadari and Nourbakhsh2020). Therefore, it is necessary to investigate the fates of various soil nutrients after adding palygorskite.
(a) Schematic illustration of the fabrication procedure and mechanism of temperature-controlled-release and collectable iron fertilizer (TCIF). (b) Ratio collapse of TCIF in aqueous solution with time. (c) Reuse performance of TCIF (reprinted with permission from Chi et al., Reference Chi, Zhang, Xiang, Cai and Wu2018, Elsevier B.V.). (d) Schematic illustration of periclase layered double hydroxides (PER@PLDH) and its calcined derivative (PER@PLDO). (e) Schematic mechanism of P adsorption onto PER@PLDH and PER@PLDO (reprinted with permission from Kong et al., Reference Kong, Tian, Wang, Li, Liu and Pang2019, Elsevier B.V.). (f) Scanning electron microscopy (SEM) images of a water and nutrient loss-control agent (WNLCA). (g) Schematic diagram of the WNLCF structure. (h) Leaching loss-control ratios of water and nutrient loss-control urea (WNLCU). (i) Migration-to-surface loss-control ratios of 2 g of WNLCU with various WF/WNLCA weight ratios of a = 9.0:0.6, b = 9.0:0.8, c = 9.0:1.0 and d = 9.0:1.2 (reprinted with permission from Zhou et al., Reference Zhou, Cai, He, Zhong, Yu, Zhang and Wu2015, American Chemical Society). HA30 = attapulgite sample irradiated by 30 kGy; WNLCN = water and nutrient loss-control NH4Cl.

Clay–bacterial interactions need to be evaluated under specific conditions, including the clay minerals themselves and their modified types, various organic materials and microbial species, to achieve the most efficient biodegradation of organic matter (Biswas et al., Reference Biswas, Sarkar, Rusmin and Naidu2015). Ugochukwu et al. (Reference Ugochukwu, Jones and Fialips2014a) reported that raw palygorskite had a larger surface area than organically modified palygorskite, and this larger surface might support the reproduction of hydrocarbon-degrading microbial communities, thereby facilitating the biodegradation of crude oil. The low pH value of acid-treated palygorskite and the toxicity of palygorskite organic surfactants may inhibit the reproduction of these microorganisms. Moreover, heat-treated palygorskite can promote microbial reproduction and function and affect the growth and attachment of bacteria significantly (Biswas et al., Reference Biswas, Sarkar and Naidu2016). Although the studies described above have focused on various processes affected by clay minerals, including bacterial adsorption, growth and survival, key gaps remain in our understanding of changes in cell function following mineral interactions. In particular, we need to understand how the physicochemical properties of palygorskite trigger changes in microbial growth and the subsequent formation of biofilms.
Sepiolite
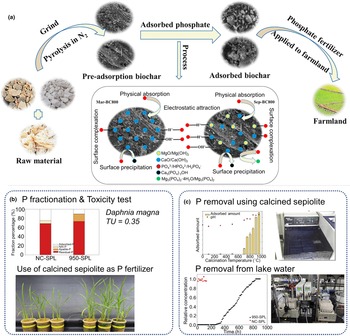
Sepiolite is a naturally one-dimensional, fibre-shaped, crystalline-morphology silicate clay mineral with a unique 2:1 layer chain structure consisting of two continuous tetrahedral sheets and a discontinuous octahedral sheet. It is a naturally fibrous clay mineral that is rich in magnesium. Therefore, as a source of calcium and magnesium, sepiolite is an attractive adsorbent for preparing calcium/magnesium materials and has excellent potential for the recovery of phosphorus as an agricultural fertilizer (Hong et al., Reference Hong, Ndingwan, Yoo, Lee and Park2020; Deng et al., Reference Deng, Zhang, Zheng, Ye, Niu and Lin2021). Deng et al. (Reference Deng, Zhang, Zheng, Ye, Niu and Lin2021) synthesized modified composite materials using calcium-rich sepiolite as a calcium and magnesium source and agricultural waste as a carbon source, which could be used as fertilizers in farmland soils and improve soil fertility and its physical and chemical properties (Fig. 8a). In addition, Hong et al. (Reference Hong, Ndingwan, Yoo, Lee and Park2020) found that heat treatment of sepiolite increased its phosphate adsorption capacity. The mineralogical, chemical and adsorption properties of sepiolite at various heat treatment temperatures have been studied quantitatively. By analysing sepiolite phosphorus contents, diatom survival tests and pot growth tests, calcined sepiolite has been shown to have a strong phosphorus removal effect, and the adsorbed sepiolite can be used as a phosphate fertilizer in soil (Fig. 8b,c). Neaman & Singer (Reference Neaman and Singer2011) reported that sepiolite releases Mg2+ ions in soil solutions, reducing the stability of soil cohesive component aggregates and improving phosphorus availability in arid soils. Fischer et al. (Reference Fischer, Pöthig, Gücker and Venohr2018) found that sepiolite can increase phosphorus solubility and reduce the risk of phosphorus losses due to surface runoff and heavy rainfall in irrigated agriculture.
(a) Schematic illustration of the mechanism involved in phosphate adsorption on Mar-BC800 and Sep-BC800 (reprinted with permission from Deng et al., Reference Deng, Zhang, Zheng, Ye, Niu and Lin2021, Elsevier Ltd). (b) Effects of P-adsorbed 950-sepiolite (SPL) application and toxicity test. (c) Effects of P-adsorption capacity and phosphate removal from lake water (reprinted with permission from Hong et al., Reference Hong, Ndingwan, Yoo, Lee and Park2020, Elsevier Ltd). NC-SPL = non-calcined sepiolite; TU = toxic units.

Another advantage of calcium-rich sepiolite is that it can be used for acidic soil remediation by exchanging calcium adsorbed on sepiolite with hydrogen and aluminium (Brady & Weil, Reference Brady and Weil2004). Moreover, sepiolite has good water retention (up to 250% of its weight as water) and is a common component in agricultural applications (Alvarez, Reference Alvarez, Singer and Galán1984; Álvarez et al., Reference Álvarez, Santarén, Esteban-Cubillo and Aparicion2011). Francis (Reference Francis2019) has studied the influence of sepiolite on soil water capacity under natural conditions, water supplies for plants and water retained by soil at permanent wilting points. Sepiolite presence and high plant-accessible water contents are particularly beneficial for sandy soil restoration due to the limited availability of water resources and the inability of overburdened soils to support plant growth (Francis, Reference Francis2019). Fibrous clay minerals such as palygorskite and sepiolite deserve special attention because of their roles in the soil and water environment, especially their impacts on ecosystems. However, more work needs to be done on the association between soil properties and the composition of fibrous clay minerals.
Sepiolite as a functional material has been used widely in catalysis, wastewater treatment, energy and other fields. With the rapid development of nanoscience/nanotechnology, the application of sepiolite is expanding to biomedicine and environmental protection. It is expected that the use of sepiolite will improve overall material properties and introduce new characteristics or reduce environmental risks and burdens caused by using other materials.
Talc
Talc is a widely distributed magnesium-rich silicate mineral that is often crushed into a powder and used in paper, pharmaceuticals, cosmetics and agriculture (Kalendová et al., Reference Kalendová, Veselỳ and Kalenda2010). For example, Tan et al. (Reference Tan, Sha, Yu, Yang, Qu and Xu2020) synthesized a spherical citric acid-soluble fertilizer using talc and NH4H2PO4 as raw materials. The prepared fertilizer is transformed into struvite in water, with almost no release of N, P and Mg, while the dissolution rate of nutrient elements in 2% citric acid solution is virtually 100%, which can control the loss of nutrient elements effectively, reduce the cost of agricultural production and achieve the goal of the sustainable development of agricultural systems. Borges et al. (Reference Borges, Brunatto, Leitão, De Carvalho and Wypych2015) conducted a series of studies on the mechanochemical transformation of clay minerals, converting talc into a slow-release fertilizer using mechanochemical methods. Due to the fact that talc is rich in silicon (its silicon content theoretically can reach 63.3%) and contains almost no toxic heavy metals, it can be inferred that talc has the potential to be used for the preparation of silicon fertilizers (Kalantari et al., Reference Kalantari, Ahmad, Reza, Masoumi and Shameli2014; Wang et al., Reference Wang, Zhang, Zheng, Lin, Chen and Wang2021). Pot experiment results showed that a soil Si-talc fertilizer application of 5 g kg–1 was the most effective for the growth of pak choi. However, with increasing application, the growth index of pak choi decreased sharply, which may be related to increasing soil pH and salinity. Therefore, Si fertilizers may be a potential choice for improving crop yields in Si-deficient soils under controlled dosage application (Wang et al., Reference Wang, Zhang, Zheng, Lin, Chen and Wang2021). Moreover, many bacterial biologics are synthesized from solid carriers (talc or compost). A talc-based compound fertilizer consisting of N fixers and P and K solubilizers has been accepted widely by farmers, although there are some disadvantages to such talc-based biologics. The experimental performance of these biologics is limited by bulkiness of the formulation, the high application rate required and non-sterile nature of the preparations (Prasad & Babu, Reference Prasad and Babu2017; Yadav et al., Reference Yadav, Manu and Meenakumari2017; Gopi et al., Reference Gopi, Meenakumari, Anith, Nysanth and Subha2020).
Talc is used widely as a dusting, coating and filler in paints, plastics, pharmaceuticals, rubber and lubricants due to its well-known advantages of its natural abundance, low cost, high SSA and good physical and chemical stability (Kalendová et al., Reference Kalendová, Veselỳ and Kalenda2010; Darajeh et al., Reference Darajeh, Reza and Masoumi2016; Sani et al., Reference Sani, Ahmad and Saleh2016). In addition, recent evidence suggests that it is an effective toxic organic pollutant and heavy metal absorber, being able to remove them from the environment (Sprynskyy et al., Reference Sprynskyy, Kowalkowski, Tutu and Cukrowska2011). Most industries can only use high-grade talc, and a large number of talc tailings produced in the beneficiation process or low-grade talcs have not been utilized fully (Farrokhpay et al., Reference Farrokhpay, Ndlovu and Bradshaw2018). Developing a new talc fertilizer conversion process would be beneficial to expanding the application of talc and the utilization of talc waste.
Illite
Illite, a common layered aluminosilicate with a nanopore structure, is distributed widely in soils and has significant environmental implications (Yesilbas et al., Reference Yesilbas, Holmboe and Boily2019; Li et al., Reference Li, Xing, Tang, Liu, Chang and Zhang2022). Its limited interlayer space leads to its large SSA, large CEC and good adsorption performance. Illite mineral nanopores supply natural ‘sites’ for investigation of the interaction between soil minerals and solutions at the nanoscale. Cationic adsorption occurs at the clay mineral–water interface and plays a crucial role in reaction processes (Wang & Giammar, Reference Wang and Giammar2013). Under normal soil solution conditions, illites carry a negative charge on its surfaces, making it potentially stable water-dispersed colloids (Jiang et al., Reference Jiang, Séquaris, Vereecken and Klumpp2012). Under acidic and neutral conditions, the positively charged edge of illite is favourable for forming a card-house structure due to the establishment of a protonated aluminium base and a negatively charged base plane (Delhorme et al., Reference Delhorme, Labbez and Thomas2010). At alkaline pH values, illite has a strong negative charge on its basal surface (Delhorme et al., Reference Delhorme, Labbez and Thomas2010).
The anisotropic surface properties of illite minerals make their dispersion/aggregation behaviour at various pH values more complicated, which is worthy of systematic study in soils. Recently, Jiang et al. (Reference Jiang, Séquaris, Vereecken and Klumpp2012) investigated the stability of illite colloid dispersion under various electrolyte chemical conditions to explore the environmental behaviour of these soil colloids. In Na systems, colloidal illite particle suspensions showed greater stability in the presence of oxalate ions, confirming the occurrence of surface complexation at low pH value. This is associated with the capacity of bifunctional carboxylic acid to interact with surface aluminium and silicon via inner-sphere complexes (Jiang et al., Reference Jiang, Séquaris, Vereecken and Klumpp2012). In Ca systems, the critical coagulation concentrations in illite suspensions change slightly in the presence of Cl–, SO42–, formic acid and oxalate, supporting the existence of attractive ion–ion correlation forces between similarly highly charged clay mineral colloids (Jiang et al., Reference Jiang, Séquaris, Vereecken and Klumpp2012). Both SOC and clay minerals contribute to soil CEC in soil aggregates, and their interactions have significant effects on soil structural stability (Nelson & Oades, Reference Nelson, Oades, Sumner and Naidu1998). Some researchers have indicated that water interactions leading to clay mineral dispersion are minimal when the SOC content is great in the soil because the charge on the clay mineral is decreased due to binding between clay minerals and organics (mostly covalent) or because soil microaggregates are encased in organic materials formed by covalent bonds (Marchuk & Rengasamy, Reference Marchuk and Rengasamy2012; Marchuk et al., Reference Marchuk, Rengasamy and McNeill2013). Marchuk et al. (Reference Marchuk, Rengasamy and McNeill2013) found that NaCl caused a greater degree of dissolution of OC than KCl in soils containing illite, which was consistent with the discovery that exchangeable Na caused a greater degree of clay mineral dispersion than K. Moreover, compared with Ca, Mg can decompose rather than disperse dissolved OC from the illite surface by decreasing the saturated hydraulic conductivity and increasing desorption (Zhu et al., Reference Zhu, Bennett and Marchuk2019).
Illite, which is considered to be a potassium-rich clay mineral, is generally assumed to have a relatively low adsorption and release capacity for exchangeable ions such as Na, Mg and Ca, but a great ability to accumulate K (Barré et al., Reference Barré, Velde and Abbadie2007). Illite is a potassium-rich mineral that can produce potassium nitrogen fertilizers, potassium calcium fertilizers, potassium chloride and other potassium-compound fertilizers (Barré et al., Reference Barré, Velde and Abbadie2007). Agricultural utilization of illite has expanded gradually, and this has the advantage of improving soil quality and promoting crop growth. Illite has been studied extensively to elucidate its influence on soil improvement and soil toxicity (Yin et al., Reference Yin, Wang, Li, Li, He and Wang2015). Based on the physical and chemical properties of natural illite, Lee et al. (Reference Lee, Lee, Kim, Shin, Joo, Lee and Sung2021) explored the effects of illite-based compound fertilizers on soil improvement and crop growth. The application effects of various illite fertilizer prototypes, soil improvers and plant growth promoters were studied. Illite and microbe-containing soil improvers affect soil physicochemical properties positively, such as electrical conductivity and exchangeable potassium abundance, and a reduction in soil pH has been observed. However, the mechanism underlying this process remains to be further studied. Therefore, developing agricultural fertilizers containing illite helps us to improve soil chemical quality and plant growth. Rational soil regulation and management are key to improving soil quality, maintaining plant root function and improving crop productivity. Illite has been reported to promote the growth of vegetable crops (Kwon et al., Reference Kwon, Kim, Kim, Lee, Han, Lee, Gilkes and Prakongkep2010). Therefore, Kwon et al. (Reference Kwon, Kim, Kim, Lee, Han, Lee, Gilkes and Prakongkep2010) explored the promoting effect of illite on crop growth by measuring plant size and analysing the main cations (K, Ca, Mg) of plants. However, the scientific information to support such research is limited.
In addition to contributing to potassium fertilizers, illite may also be used to make a new type of fertilizer, mainly composed of trace elements such as Fe, Zn and Mn (Valencia & Gonzalez, Reference Valencia and Gonzalez2011). The clay minerals in such a fertilizer can absorb micronutrients, preventing them from leaching or reacting so that plants can absorb them more efficiently. At the same time, the potassium ions between illite layers can be released through cation exchange to provide potassium for plant growth. Therefore, illite will play an important role in agricultural production.
Conclusions and future challenges
This paper reviews research from the last decade into the relationship between clay minerals and soil structure and function, emphasizing how clay minerals and their modified materials regulate soil nutrients, plant growth, microbial activity and soil carbon sequestration through their direct effects on soil physical structure and its chemical and biological properties. This literature review presents the latest information on the application of clay minerals in this area. Clay minerals control soil nutrient supply and availability due to their physicochemical properties. They also control the soil physical structure through the formation of microaggregates, the number and activity of soil microorganisms by regulating soil acidity and SOC storage and release through their surface properties and microbial activity levels. In addition, most of the research on the effects of clay minerals (especially montmorillonite and kaolinite) on soil nutrient retention and supply suggests that clay mineral materials have enormous commercial prospects in agricultural fertilizer applications. However, some types of clay minerals, such as sepiolite and talc, may have unique physical and chemical properties that are desirable for soil-improvement materials, which will promote the application of clay minerals in soil ecology greatly. Currently, most studies on the interaction between clay minerals and bacteria have focused on kaolinite and montmorillonite, with few focusing on the interaction between clay minerals and microorganisms. In particular, the research on the soil carbon sequestration of clay mineral materials mainly focuses on kaolinite, montmorillonite and vermiculite mineral materials, and the current research is still at the laboratory stage. Future research should also focus on soil carbon sequestration and quantitative mineralogical factors in ecosystems. This would not only help us to maintain soil health and crop production, but also assist in mitigating climate change.
Understanding the relationship between clay mineral structure and soil function is vital for understanding and managing soil systems to maintain soil ecology. It has been proven that the CEC and SSA of clay minerals are key factors influencing soil fertility. The soil nutrient retention, release and availability mechanisms involve mainly adsorption–desorption and dissolution–precipitation processes (Delgado & Gómez, Reference Delgado, Gómez, Villalobos and Fereres2016; Kome et al., Reference Kome, Enang, Tabi and Yerima2019), but the detailed mechanisms underlying these at the molecular or atomic scale are still unclear. Therefore, it is necessary to accurately analyse the structure of clay mineral materials using various characterization methods and advanced technologies to design and synthesize clay-derived materials. One of the future research directions of clay minerals is synthesizing new clay mineral environmental materials based on nanotechnology, which is anticipated to be investigated more widely in future. Moreover, theoretical calculations could be employed to elucidate the structures of clay-based minerals. In follow-up studies, combining nanoscale experiments and theoretical calculation will be crucial to understanding the reaction mechanisms and processes of clay-based materials in soil systems. In addition, most current studies are conducted only at the laboratory scale, and the conclusions drawn from such studies may not reflect accurately or apply to natural systems. Unlike the laboratory, which focuses more on the microstructure of clay minerals, the natural soil structure is more macroscopic. The mineralogical properties of clay minerals, such as SSA, CEC, charge density, dispersion and expansibility, have more complex effects on soil properties under natural conditions. Moreover, there are numerous types of clay minerals; nevertheless, most of the research on soil improvement with clay minerals has focused on a few clay minerals, such as montmorillonite and kaolinite, and the microscopic and submicroscopic structures and biological properties of clay minerals have received scant attention. Hence, we remain far from achieving the widespread utilization of clay minerals and their modified materials for practical applications in soil ecology.
Clay minerals are cheap, locally available and effective multifunctional minerals that undoubtedly will have many promising future benefits. It is anticipated that there will be more breakthroughs in synthesizing clay-based materials for regulating soil structure and function due to the rapid development of characterization techniques and the improvement of soil system knowledge. We believe that inexpensive clay mineral materials will play an important role in soil improvement and have great potential for industrial applications.
Financial support
This work was supported by the National Key R&D Program of China (2022YFC2904802, 2022YFC2904804), the China Postdoctoral Science Foundation (2021M692985), the CUG Scholar Scientific Research Funds at China University of Geosciences (Wuhan) (2019152), the Fundamental Research Funds for the Central Universities at China University of Geosciences (Wuhan) and the National Science Fund for Distinguished Young Scholars (51225403).