Introduction
The McMurdo Dry Valleys of East Antarctica (Fig. 1) is a cold desert with recorded mean annual temperature ranging from -14.8°C to -30.0°C (Doran et al. Reference Doran, McKay, Clow, Dana, Fountain, Nylen and Lyons2002a) and annual precipitation of generally less than 100 mm (Bromley Reference Bromley1985). During the brief summer, melting glaciers feed ephemeral streams which mostly terminate in closed basin lakes. Water loss from the system is through sublimation of ice, and evaporation of meltwater. The Holocene hydrologic history of the McMurdo Dry Valleys is one of great variability. Based on lake water δ18O, δD, and chloride profiles, Hendy et al. (Reference Hendy, Wilson, Popplewell and House1977) proposed that Lake Bonney in Taylor Valley existed 100 000–300 000 yr bp. Poreda et al. (Reference Poreda, Hunt, Lyons and Welch2004) described the history of Lake Bonney in greater detail, suggesting that the west lobe may have a history of at least 106 yr based on helium profiles. Lyons et al. (Reference Lyons, Tyler, Wharton, McKnight and Vaughn1998a) concluded that lakes Vanda, Bonney, and Fryxell all lost their ice covers and were reduced to small brine ponds between 1000–1200 yr bp. They further concluded that Lake Hoare drained or evaporated to dryness at c. 1200 yr bp. These conclusions for Lake Hoare and Lake Bonney were further supported by lake water δ37Cl (Lyons et al. Reference Lyons, Welch and Sharma1998b).
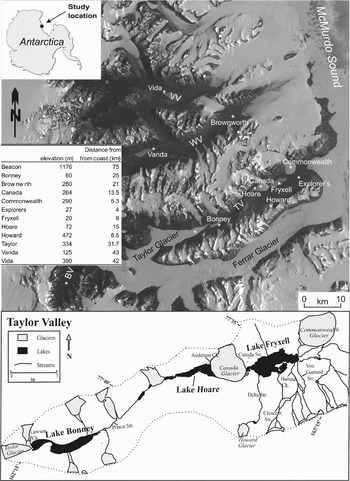
Landsat image of the McMurdo Dry Valleys region and map of Taylor Valley showing the location of features discussed in text. Dashed line in bottom figure is a general basin boundary for Taylor Valley. Meteorological stations are labelled with asterisks in the Landsat image. Valley names are abbreviated as: TV = Taylor Valley, WV = Wright Valley, VV = Victoria Valley, BV = Beacon Valley. Inset table shows elevation above sea level, and the straight-line distance from the coast for all stations

Evidence for large glacial lakes has been found in all the major Dry Valleys (Stuiver et al. Reference Stuiver, Denton, Hughes, Fastook, Denton and Hughes1981, Hall & Denton Reference Hall and Denton2000b, Hall et al. Reference Hall, Denton and Overturf2001, Reference Hall, Denton, Overturf and Hendy2002) during the last glacial maximum (LGM). At this time, the Ross Sea Ice Sheet was believed to have extended into the valley to the region of Lake Fryxell (Hall et al. Reference Hall, Denton and Hendy2000). The blocked down-valley drainage allowed for the formation of a large lake above the current sill level at New Harbour near the McMurdo Sound coast. During that same period, ice core records from nearby Taylor Dome suggest annual temperatures were 4–8°C cooler (Steig et al. Reference Steig, Morse, Waddington, Stuiver, Grootes, Mayewski, Twickler and Whitlow2000). The cause of this paradox (much more meltwater than today during a significantly colder period) remains difficult to resolve. There are two general theories: 1) that a more arid climate provided less snow cover on glaciers, a lower albedo, and more melt even under a colder climate than today (Hall & Denton Reference Hall and Denton1996), and 2) that local summer temperatures were actually warmer (Doran et al. Reference Doran, McKay, Clow, Dana, Fountain, Nylen and Lyons2002a).
During the 20th century, lake levels generally increased (Chinn Reference Chinn1993), with the exception of a period of decreasing levels from 1986–2000, which coincides with a period of decreasing summer temperatures (Doran et al. Reference Doran, Priscu, Lyons, Walsh, Fountain, McKnight, Moorhead, Virginia, Wall, Clow, Fritsen, McKay and Parsons2002b). This “cool” period was interrupted by the anomalously warm summer of 2001/02 which generated substantial meltwater, and restored the water lost during the prior 14 years. We refer to this season as the “flood year”. The sequence of events behind this anomalous warm/wet summer in comparison to the previous (2000/01) cold/dry summer (herein referred to as the “non-flood year”) are the focus of this paper. By identifying the climatic and hydrologic processes behind these extreme high flow and low flow summer seasons, we may be able to elucidate possible causes of past hydrologic extremes, including large glacial lakes during the LGM.
Site description
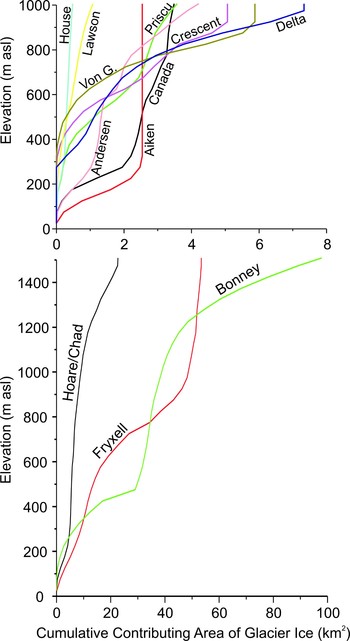
The dominant landscape features of the McMurdo Dry Valleys are alpine, piedmont, and outlet glaciers, permanently ice-covered lakes on the valley floors, and large expanses of barren patterned ground (Fig. 1). Snowfall only accumulates at high elevations and on the valley floor it sublimates or contributes to soil moisture and does not contribute to stream flow significantly. The concept of a drainage basin in the Dry Valleys is inappropriate because almost all stream flow is derived from glacial meltwater (Chinn Reference Chinn1987). Therefore, drainage basin area is only considered as the area of glacier ice within the basin. Due to the difficulty in assessing ice cliff area, it is excluded from glacier ice area in this paper, but we do recognize its importance (Chinn Reference Chinn1987). Figure 2 shows that some streams in Taylor Valley, such as Aiken and Canada, have significant areas of glacial ice available at low elevations. Other streams, such as Von Guerard and Crescent, have very little contributing glacier area at low elevation, but the area increases significantly with elevation. Streams vary in length from less than 100 m to the 32 km of the Onyx River draining into Lake Vanda in Wright Valley (the latter is not represented in Fig. 2). Water is lost from the streams by evaporation and by refilling of the hyporheic zone, the saturated area under and adjacent to the stream (Gooseff et al. Reference Gooseff, McKnight, Runke and Vaughn2003).
Cumulative contributing area of glacial ice for individual streams (top) and entire basins (bottom) in Taylor Valley.

The autonomous meteorological record in the McMurdo Dry Valleys extends back to 1986 (Doran et al. Reference Doran, McKay, Clow, Dana, Fountain, Nylen and Lyons2002a) starting with the Lake Hoare station, and the Lake Fryxell station being established a year after. Typically, the Dry Valleys experience calm up-valley (from McMurdo Sound) winds during the summer months, and frequent strong down-valley winds during the winter (Clow et al. Reference Clow, McKay, Simmons and Wharton1988, Doran et al. Reference Doran, McKay, Clow, Dana, Fountain, Nylen and Lyons2002a, Nylen et al. Reference Nylen, Fountain and Doran2004). Doran et al. (Reference Doran, McKay, Clow, Dana, Fountain, Nylen and Lyons2002a) demonstrated a strong linear inland increase in potential temperature (essentially temperature normalized to sea level using the dry adiabatic lapse rate - see Doran et al. Reference Doran, McKay, Clow, Dana, Fountain, Nylen and Lyons2002a for more detail) largely caused by the up-valley winds. One result of this potential temperature gradient is that snow accumulation decreases with distance inland (Fountain et al. Reference Fountain, Lewis and Doran1999). The down-valley winds draining the East Antarctic Ice Sheet, can reach speeds of nearly 40 m s-1 and can increase winter air temperatures by +30°C in a few hours (Doran et al. Reference Doran, McKay, Clow, Dana, Fountain, Nylen and Lyons2002a, Nylen et al. Reference Nylen, Fountain and Doran2004).
The lakes in the McMurdo Dry Valleys are very sensitive to changes in local climate. Bomblies et al. (Reference Bomblies, McKnight and Andrews2001) concluded that an average increase in stream flow of about 4% per year was required to account for the 12 m rise in the Lake Bonney level from 1903 to 1970. Lake Bonney levels are more responsive to warm periods than lakes Hoare and Fryxell as a result of its steeper bathymetry and a basin with more glacier ice surface at low elevation (Fig. 2). However, the Lake Fryxell level is more responsive to cooling and evaporative loss due to its large ratio of surface area to volume. During the period of lake level lowering from 1992–2001, Lake Fryxell levels lowered at a rate of 76 mm yr-1, while Bonney and Hoare lowered at 51 and 45 mm yr-1 respectively (unpublished data).
Methods
Data used here were collected under the auspices of the McMurdo Dry Valleys Long-Term Ecological Research project. Many of the methods and datasets are presented online at http://www.mcmlter.org. Meteorological data were collected using sensors driven by Campbell Scientific CR10 data loggers as described by Doran et al. (Reference Doran, McKay, Clow, Dana, Fountain, Nylen and Lyons2002a). Stream stage was measured at flumes and natural in-stream controls via pressure transducers. Rating curves, to transform stage to discharge were developed from discharge measurements made manually twice each season during a range of flows. Lake levels were usually measured twice annually by optical survey, and continuously by pressure transducers on buoys anchored beneath the permanent ice covers. The pressure transducer measurements were adjusted for the salinity of the overlying water based on water samples collected 2–3 times per summer. Unfortunately, instrumental problems interrupted continuous measurements during the non-flood season.
In order to understand how common our flood and non-flood years are we built a record of long-term summer lake level change. Early and late summer lake level measurements are more frequent prior to the initiation of the meteorological record (in 1986) creating a number of years (12) where summer lake level change is not known. Since 1986 though, we have an overlapping record at Lake Hoare of summer lake level rise and degree days above freezing (DDAF) that has a significant correlation (r 2 = 0.82, P = 0.035, n = 5). We also checked the relationship between average summer (DJF) temperature and summer lake level rise, and it did not yield a significant relationship (r 2 = 0.38, P = 0.269, n = 5). The correlation between summer lake level rise and degree days above freezing allowed us to extrapolate our lake level dataset and provide a complete summer lake level change record between 1973–2004. Of the Taylor Valley lakes, Lake Hoare is expected to have the strongest relationship between lake level change and DDAF because the streams flowing into Lake Hoare are short with minimal opportunity for loss by evaporation or hyporheic storage. We used a DDAF model to estimate a flood frequency over the 40+ year period.
Because precipitation measurements are difficult to make in this windy polar desert, glacier mass balance was analysed as an indication of differences in snow accumulation between the two seasons. In this approach, a net snow accumulation indicates that more snow fell than was sublimated or melted from the glaciers.
We estimated soil water content of the surface (5 and 10 cm) soil using soil reflectometers (Delta T Theta Probe, Dynamax, Inc). The probes were calibrated using a 5th order polynomial equation (y = -250431x5 + 261210x4 - 101077x3 + 17113x2 - 1036.8x, r 2 = 0.98) fit to the relationship between observed reflectometer readings (mV) and gravimetrically determined soil water content.
Results
Historical context of the two summers
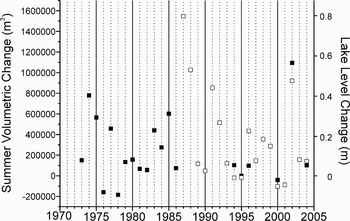
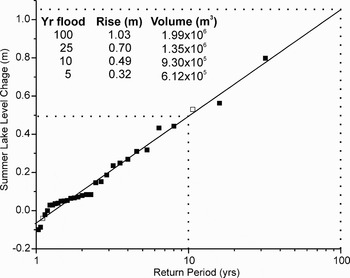
The record of summer lake level change at Lake Hoare has a significant correlation with DDAF (r 2 = 0.82, P = 0.035, n = 5). We also checked the relationship between average summer (DJF) temperature and summer lake level change, but it did not yield a significant relationship (r 2 = 0.38, P = 0.269, n = 5). The continuous record from 1973–2004 generated using this correlation (Fig. 3) shows that the flood year (2001/02) was the third largest summer lake level increase on record and the non-flood year (2000/01) was the third smallest lake level increase on record. Further, the flood frequency analysis over this 40+ year period (Fig. 4) shows that the lake level change in the flood year (2001/02) corresponds to the 10-year event. These results support the analysis of the conditions during these two seasons as extremes in the record.
Historical summer lake volume change in Lake Hoare. Solid symbols are actual surveyed data. Open symbols are calculated from DDAF using the regression between available DDAF and observed summer lake volume change. The Lake Hoare bathymetric polynomial is nearly linear in the top 5 m of lake depth allowing an approximate lake level change scale on the right side for reference.

Flood frequency analysis of the summer lake level rise at Lake Hoare. During years where actual data are not available, the modelled results from Fig. 3 are used. Return period represents the frequency in which a given lake level rise of that magnitude or greater is encountered. The two summers focused on in this paper are presented as open squares.

Local climate during the two summers
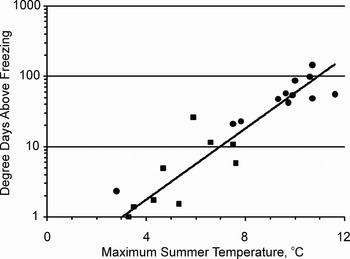
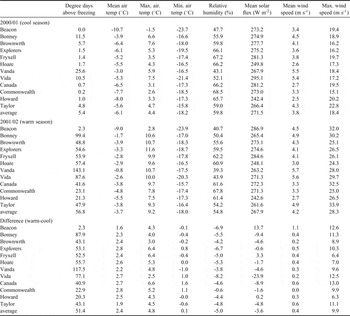
Differences in temperature, wind and solar flux were examined during the two summers at the 12 operating automatic meteorological stations in the Dry Valleys. Table I shows that mean DJF temperatures were on average about 2.4 degrees warmer during the flood year, with DDAF values an order of magnitude higher. Figure 5 shows that the relationship between average summer temperature and DDAF varied for both the flood and non-flood seasons. The relationship between DDAF and average summer temperature seems to vary depending on the intensity of the summer warming. In contrast to these clear differences in mean DJF temperatures and DDAF, there was no significant difference between the two seasons on average with regards to solar radiation (t = 0.65, P = 0.52).
Degree days above freezing vs maximum summer from all stations during the 2000/01 season (squares) and 2001/02 season (circles). A single regression line fits all the data with r 2 = 0.86.

Meteorological averages for, and differences between, the two seasons.

While summer temperatures increased during the flood year relatively consistently throughout the valleys (between 1.6 and 2.8°C), at several stations DDAF showed a markedly variable response (between 2.3–117.5 DDAF). This difference seems to be related to the departure of the typical summer temperature at a site from the zero degree isotherm. For example, the three stations with mean summer temperatures closest to 0°C during the flood season (Vanda, Vida, and Bonney) also had the greatest DDAF and the largest changes in DDAF between the non-flood and flood seasons. The two stations with larger changes in temperature (Explorer's Cove and Commonwealth Glacier) had smaller increases in DDAF than the Vanda, Vida and Bonney stations because their mean summer temperatures remained further below the 0°C isotherm.
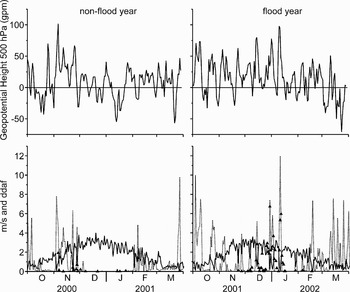
In addition to air temperature, the main difference between the flood and non-flood years was the occurrence of more frequent strong down-valley winds (Fig. 6) creating higher mean and maximum wind speeds during the flood year. These strong wind events are associated with the 500 hPa geopotential height differences between the polar plateau and the Ross Sea region. During the non-flood season, this local 500 hPa geopotential height index was slightly more negative (the ratio of the area above the top left curve in Fig. 6 to the area under the curve is 2.2) as compared to the more positive flood year index (the curve-area ratio is 3.3). Typically (but not always), the down-valley winds start increasing from 1 to 2.5 days after the geopotential height difference exceeds zero.
(top) Difference in 500 hPa geopotential height of East Antarctic plateau (75–80°S, 150–165°E) and Ross Sea (75–80°S, 165–180°E), (bottom) Lake Hoare easterly wind speed (solid lines), westerly wind speed (dashed lines) and degree days above freezing (solid triangles) for the flood (right) and non-flood (left) years.

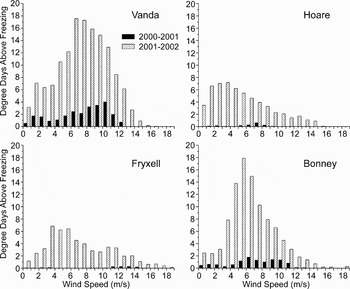
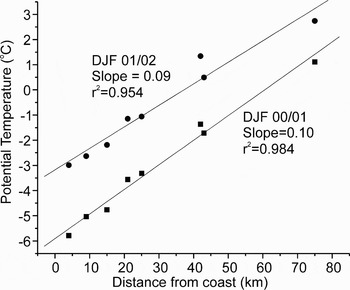
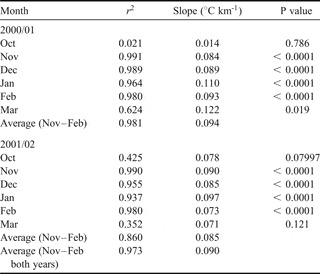
To evaluate the relationship between wind speed and DDAF, the two are plotted for four different stations (Fig. 7). The more coastal sites (Hoare and Fryxell) are more positively skewed with more influence from radiative heating than from the strong down-valley winds. The more inland sites (Bonney and Vanda) appear to experience much more of the warming. The strong linear inland warming of the potential temperature (Peixoto & Oort Reference Peixoto and Oort1992) noted by Doran et al. (Reference Doran, McKay, Clow, Dana, Fountain, Nylen and Lyons2002a) occurred during both summers (Fig. 8). During both summers this phenomenon began in November and was strong through February, and broke down in March (Table II).
Histograms of wind speed vs DDAF at four different stations during the flood and non-flood seasons.

Distance from coast vs potential temperature for the two summers (DJF).

Monthly regression data for distance inland versus potential temperature for all valley bottom stations in the McMurdo Dry Valleys.

Hydrologic response
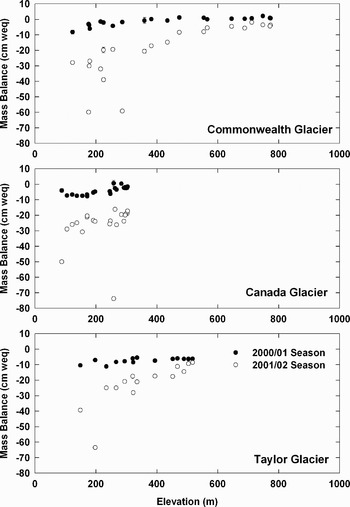
The results from the analysis of the glacier mass balance data show the effect of the differences in summer climate on meltwater generation. The non-flood summer exhibited a typical summer (NDJ is used here reflecting our inability to get to the field for these manual measurements in February) mass balance (Fig. 9). Net mass (snow) accumulated above 700 m and loss (ice) occurred below 700 m. During the flood year, significant mass loss occurred at all elevations on the glaciers. Reflecting the decrease in snow accumulation with distance inland (Fountain et al. Reference Fountain, Lewis and Doran1999), the mass balance at any given elevation decreased with distance up-valley (Fig. 9).
Mass balance of three glaciers in the McMurdo Dry Valleys, Antarctica during the 2000/01 and 2001/02 (November–January) summer seasons. Error bars on mass balance measurements are not included because they are small relative to the figure symbols.

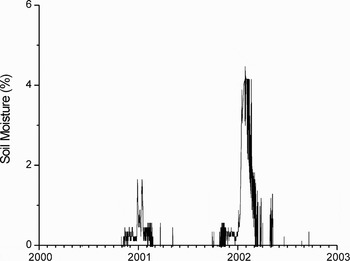
Water content in soils as measured by theta probe, more than doubled during the flood year vs the non-flood year (Fig. 10). During the flood year, numerous springs appeared in areas where there had been no previous observations of surface water (Lyons et al. Reference Lyons, Welch, Carey, Doran, Wall, Virginia, Fountain, Csatho and Tremper2005). The source of these springs is believed to be enhanced ground ice melt as the summer freezing isotherm pushed deeper into the ground than in more typical years, causing more deeply buried ice to melt. We assume this is the source of the elevated soil moisture during the flood year.
Soil water content in a long-term monitoring site on the south side of Lake Hoare, Taylor Valley estimated using Delta-T Soil Reflectometers.

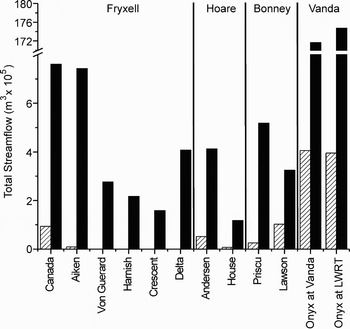
The total annual stream discharges for the two seasons are shown in Fig. 11. Annual discharges for the flood season were significantly higher than the non-flood year. The Onyx River's annual discharge was more than 40 times higher. Canada and Aiken Stream in Taylor Valley had twice the discharge in the flood year as the Onyx River in the non-flood year. Delta stream experienced a nearly 6000-fold increase in annual streamflow. Three streams in Taylor Valley did not flow at all in the non-flood year, but had discharges in excess of 250 000 m3 during the flood year. The streams that flowed in the non-flood year in the Fryxell and Hoare basins were the ones with substantial glacier ice at low elevations (e.g. Andresen, Aiken, Canada). In the Bonney Basin, both monitored streams flowed in the non-flood year despite not having significant glacier ice at lower elevations.
Total annual stream flow for selected streams in the McMurdo Dry Valleys during 2000/01 (hatched) and 2001/02 (solid) field seasons. Respective lake drainage basins are indicated at the top.

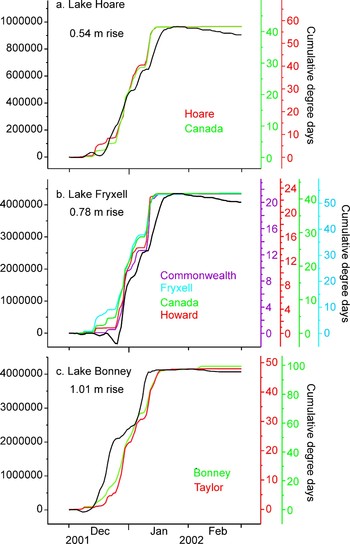
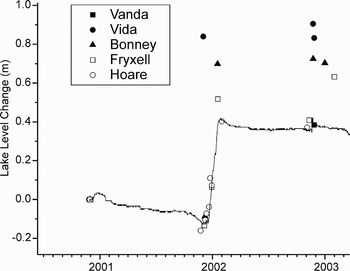
During the flood year, lakes in Taylor Valley rose between 0.58–1.13 m (Fig. 12). Continuous measurements are missing for the non-flood year, but manual measurements at Lake Hoare show a summer lake level decrease (Fig. 3). The relationships between the continuous lake level and meteorological data from stations in the respective basins of Lake Hoare, Fryxell and Bonney are shown in Fig. 12. In all three basins, the higher elevation glacier stations are better predictors of lake level change than the stations at lake level, especially for lakes Fryxell and Bonney. In all cases the quality of the fit degrades towards the end of the season. Our lake level record in other valleys has not been as complete in recent time, but Fig. 13 suggests that Lake Vida in Victoria Valley may have risen the most of any of the Dry Valley lakes during the flood year. Lake Vanda in Wright Valley rise appears to have been equivalent to that of Lake Hoare.
Mean daily lake volume change during flood year and cumulative degree days above freezing at meteorological stations within each basin as follows: a. Lake Hoare lake level compared against degree day data from Canada Glacier and Lake Hoare meteorological stations, b. Lake Fryxell lake level compared against Howard Glacier, Canada Glacier, Commonwealth Glacier and Lake Fryxell meteorological stations, c. Lake Bonney lake level compared against Taylor Glacier and Lake Bonney meteorological stations.

Relative lake level change as measured by optical surveys in the McMurdo Dry Valleys since November 2000 (symbols). All lakes have a November 2000 measurement that all subsequent data are compared against. The line is the continuous lake level record at Lake Hoare. End of summer optical survey measurements are not available for any of the lakes in the non-flood year and a measurement during the flood year is missing for Lake Vanda. For this reason the record was extended to the next summer (next measurement) to show the relative change at Lake Vanda.

Discussion
Our data demonstrate that the flood year was associated with a significant increase in mean summer temperature (2.4°C) and DDAF (51.4) over the previous non-flood year. Summer down-valley winds were unusually frequent during the flood year. Inland sites (Vanda, Vida, and Bonney) are more exposed to the increased down-valley winds, and record the largest increases in DDAF, presumably because their mean summer temperatures are closer to the melting point than at other stations. Lake Vida is particularly intriguing since it seems to be among the most exposed to down-valley flow in summer, but as Doran et al. (Reference Doran, McKay, Clow, Dana, Fountain, Nylen and Lyons2002a) show, it is sheltered from all but the strongest down-valley winds in the winter. This causes the Lake Vida region to be colder in the winter and warmer in the summer than other Dry Valleys sites, and promotes the establishment of the very thick ice cover seen on Lake Vida itself (Doran et al. Reference Doran, Fritsen, McKay, Priscu and Adams2003).
Valley bottom stations followed the same inland warming trend associated with coastal winds that was reported by Doran et al. (Reference Doran, McKay, Clow, Dana, Fountain, Nylen and Lyons2002a) but in addition we now show that this trend extends as far inland as Beacon Valley (75 km from the coast) and is present during summers of strong down-valley flow as well as those without. The Doran et al. model remains a strong basis for mapping summer temperature measurements throughout the valleys, but we show here that summer DDAF, which are a better indicator of melt, are largely dictated by down-valley winds, at least during the two extreme summers we compared.
In addition to the spatial variation in the climate regime during the two summer seasons, the magnitude of increase in stream flow and lake level change is related to morphological characteristics of the glaciers, streams and the lakes. One important physical factor is the distribution of glacier ice at different elevations (Fig. 2, Chinn Reference Chinn1987, Ebnet et al. Reference Ebnet, Fountain, Nylen, McKnight and Jaros2005). The streams that drain significant ice surface area at low elevations, such as Aiken and Canada, showed significant flow during the cool 2000/01 summer. In contrast, other streams that have very little contributing glacier ice at low elevation, such as Delta and Von Guerard Streams, had very small annual discharge in that summer. For these streams, the degree of potential contributing area increases significantly with elevation and these streams had much higher flow during the warm flood year. As a result of these differences in the distribution of glacier ice with elevation in the Taylor Valley, lakes Fryxell and Bonney will receive proportionally more stream flow than Lake Hoare during warm summers.
The stream flow response is also related to several geomorphological characteristics of the streams that influence loss of water in transit through evaporation and storage. The volume of hyporheic zone that needs to be satisfied before stream flow can be recorded at a gauge at the outlet to the lake, increases with stream length (Gooseff et al. Reference Gooseff, McKnight, Runke and Vaughn2003). The streams with source glaciers at higher elevation are also longer, and the loss due to storage is greater. Similarly, the substantial evaporative loss in transit also will increase with stream length (Cozzetto et al. Reference Cozzetto, McKnight, Nylen and Fountain2006). Both of these in-stream losses amplify the effect of the elevational distribution of glacier ice on the differences in stream flow among lake basins for the two years.
The magnitude of lake level change between the two seasons depends on a number of factors. Lake bathymetry and near shore topography are clearly important characteristics controlling the magnitude of change in lake level for a given stream inflow. In addition, the relative increase of DDAF between the two years and the absolute value of DDAF in the wet year is an important factor. Lake Bonney and Lake Vida have the largest increases in lake level (Fig. 13). Both lakes have high DDAF in the non-flood year and a large relative, as well as absolute, increase in the flood year. Lake Bonney also has a steep shoreline which may have also contributed to its response. The shoreline at Vida is less steep but the absolute increase in DDAF is higher. A secondary effect of low sloping bathymetry and shorelines is that these lakes have ample broad shallow areas which develop significant ice free areas around the edge (moats) in the summer, which enhances evaporative loss. Ample ice at low elevation also contributes to the large relative increases in lake level - as is clearly the case for Bonney in contrast to Fryxell and Hoare. Although not shown here, Vida and Vanda must also have large sources of ice at relatively low elevation within their watersheds.
Lake bathymetry may also influence the strength of the relationship between lake level change and DDAF. As shown in Fig. 12, these relationships degrade later in the summer. One likely explanation for this is that evaporation should increase later in the melt due to large areas of open water that develop (e.g. in moats and surface water pockets on the ice cover). This could be particularly important during late season down-valley storms which combine significant increases in both wind speed and temperature.
The spatial variations in climate regime and in geomorphological characteristics of the glaciers, streams and lakes present a number of challenges to creating a general glacier melt model that can relate long-term climate variation to the rise and fall of lake levels in the McMurdo Dry Valleys (e.g. Ebnet et al. Reference Ebnet, Fountain, Nylen, McKnight and Jaros2005). The first challenge in preparing such a model is to predict DDAF from summer temperature. The variation between the two summers considered here provides a test for any quantitative predictive model. Analysis of the data shows that mean summer temperature is a weaker prediction of DDAF (r 2 = 0.75) than maximum summer temperature (r 2 = 0.87). Within the spread of the data, the relationship between maximum summer temperature and DDAF was similar for the flood and non-flood seasons (Fig. 5). Secondly, our study showed that one of the most important aspects of spatial variation in the climate regimes is the variation in temperature as a function of elevation. The characterizations of the source glaciers in Fig. 2 are useful as a basis for a meltwater model. However, temperature is also a function of other variables. For instance, potential temperature increases systematically as a function of distance from the coast (Doran et al. Reference Doran, McKay, Clow, Dana, Fountain, Nylen and Lyons2002a).
Conclusions
In this paper we have compared a year with low stream flow to a year with high stream flow in the McMurdo Dry Valleys. Analysis of meteorological data for these two years shows that temperature, particularly summer DDAF, explains enhanced melting and stream flow. During the high stream flow year, strong winds raised maximum summer temperatures by 4.8°C and increased the DDAF by a factor of 10 compared to the previous low stream flow year.
We have shown the importance of the summer wind regime in the Dry Valleys in dictating how much melt occurs in the Antarctic coastal regions. Strong warm winds coming from the Taylor Glacier are phenomena which are not common during the summer months. However, during the summer of 2002/03, an abnormally large number of strong winds delivered pulses of warmth to the region, which melted ice, flooded streams and raised lake levels.
It is interesting to speculate on the significance of our results for the existence of large glacial lakes in the Dry Valleys during the last glacial maximum (LGM). As mentioned previously, there are two general competing hypotheses about the formation of these lakes. One holds that during the cold, but drier LGM there was more clear snowless weather allowing for more solar radiation-induced meltwater production as a result of less snow cover on glaciers (Hall & Denton Reference Hall and Denton1996). The other is that it actually was relatively warm through the presence of the Ross Sea Ice Sheet extending the distance to the coast (Doran et al. Reference Doran, McKay, Clow, Dana, Fountain, Nylen and Lyons2002a). Although our data on snow cover are inconclusive, our results do show that on average there was no significant difference between the two seasons with regards to solar radiation. The increased discharge into the lakes during the flood season was clearly tied to warmer temperatures. Warmer temperatures, particularly those that exceeded the melting point, were coincident with increased summer down-valley winds. Inland stations (e.g. Vida, Vanda and Bonney) were more affected by the down-valley warming more than coastal stations. We therefore propose that large glacial lakes were formed by increased summer down-valley flow during the LGM. Having a large amount of glacier ice at low elevation at the mouth of the valleys (e.g. Hall & Denton Reference Hall and Denton2000a) would have provided ample glacier surface area for even moderate temperature increases to generate large amounts of meltwater (Chinn Reference Chinn1982). Modern-day Wright Valley is an excellent example of how a large area of glacier ice at low elevation (the Wilson Piedmont/Wright Lower Glacier) can generate large amounts of meltwater (the Onyx River).
Acknowledgements
This research was supported by the National Science Foundation (OPP9211773, OPP9813061, OPP9810219, OPP0096250). We thank Trevor Chinn for supplying us with historical lake level measurements.