Introduction
Coral reefs, one of the planet's most biodiverse ecosystems, are ubiquitous in shallow tropical coastal environments across the globe and have persisted for hundreds of millions of years (Stanley, Reference Stanley2003). The Indo-Pacific harbours ~75% of these reefs (Roberts et al., Reference Roberts, McClean, Veron, Hawkins, Allen, McAllister, Mittermeier, Schueler, Spalding, Wells, Vynne and Werner2002) and is home to the global epicentre of coral reef biodiversity, the Coral Triangle Region (CTR). Encompassing coastal waters around the Philippines, Malaysia, Indonesia, Papua New Guinea and the Solomon Islands, this area contains more species of coral, fish and other reef taxa than anywhere else on the planet (Briggs, Reference Briggs2005; Veron et al., Reference Veron, Devantier, Turak, Green, Kininmonth, Stafford-Smith and Peterson2009). The 17,000 islands of Indonesia span most of this area and consequently, the archipelago is considered the largest and most important coral reef nation in the world (Spalding et al., Reference Spalding, Ravilious and Green2001). Indonesia is also highly dependent upon functioning reefs as a source of nutrition and financial income, and is consequently very vulnerable to the effects of reef degradation (Burke et al., Reference Burke, Reytar, Spalding and Perry2011). Unfortunately, Indonesia has not escaped the global trend in coral reef degradation and coral reefs across the archipelago face a variety of stressors that are operating at both local and global scales (Edinger et al., Reference Edinger, Jompa, Limmon, Widjatmoko and Risk1998; Baird et al., Reference Baird, Pratchett, Hoey, Herdiana and Campbell2013; Cleary et al., Reference Cleary, Polónia, Renema, Hoeksema, Wolstenholme, Tuti and de Voogd2014; Ampou et al., Reference Ampou, Johan, Menkes, Niño, Birol, Ouillon and Andréfouët2017). This is consistent with the situation across South-east Asia, where over half of all reefs are considered threatened or very highly threatened (Burke et al., Reference Burke, Reytar, Spalding and Perry2011). Reef stressors range from localized threats, such as destructive fishing and watershed-based pollution, to global scale stressors, including regional thermal anomalies and ocean acidification (Burke et al., Reference Burke, Reytar, Spalding and Perry2011). The result has been a decline in coral cover. For example across the entire Indo-Pacific, coral cover is estimated to have declined by ~50% since the early 1980s (Bruno & Selig, Reference Bruno and Selig2007). However, despite these reports of declines there are many geographic areas, particularly in the CTR, where comprehensive published baseline data remain largely unavailable. This lack of information makes it difficult to accurately assess rates and extent of coral reef decline or to assess any positive outcomes of management interventions.
As corals have historically been the dominant spatial occupants on tropical reefs, their mortality in response to environmental stressors can create space for other, more resilient benthic taxa. In the Caribbean, coral declines have often resulted in a shift to macroalgal-dominated reef communities (Hughes, Reference Hughes1994; Szmant, Reference Szmant2002; Mumby, Reference Mumby2009). However, in the Indo-Pacific, coral decline has generally not led to widespread macroalgal dominance. Bruno et al. (Reference Bruno, Sweatman, Precht, Selig and Schutte2009) reported that only 1% of 963 surveyed sites across the Indo-Pacific were considered macroalgal-dominated (although the threshold was set at >50% cover) and the regional average was 9–12% macroalgal cover. This has led researchers to consider what other (non-algal) benthic taxa might increase their abundance on degraded reefs. While non-algal taxa such as soft corals, ascidians and sponges can dominate degraded reefs (see Norström et al., Reference Norström, Nyström, Lokrantz and Folke2009 for review), these occurrences are generally rare.
Over the past 20 years, the Wakatobi Marine National Park in SE Sulawesi has been one of the most well studied regions in Indonesia due to the presence of the research organization, Operation Wallacea, on Hoga Island. Previous studies have reported the benthic cover at selected sites in the Wakatobi, particularly around Hoga Island (see McMellor & Smith, Reference McMellor, Smith, Clifton, Unsworth and Smith2010; Curtis-Quick, Reference Curtis-Quick2013). In this study we build on these earlier surveys (conducted at six sites that we sampled) by including data from previously un-surveyed locations (four sites) in the Wakatobi region. We identify taxa to a finer taxonomic resolution than previous studies, to provide a comprehensive benthic composition for reefs in the Wakatobi region in 2014. We also provide online access to our raw data to facilitate future assessments. Since declines in coral cover have already been reported from sites around Hoga Island, we also compared our data to information from 2002 (12 years earlier; McMellor & Smith, Reference McMellor, Smith, Clifton, Unsworth and Smith2010) to identify any longer-term shifts in the dominance of different benthic organisms.
Materials and methods
Study sites
This study was conducted in the Wakatobi Marine National Park in South-east Sulawesi, Indonesia. The 1.4 million hectare national park was gazetted in 1996, encompasses the four major islands of Wangi-Wangi, Kaledupa, Tomia and Binongko, and is home to ~100,000 people (Unsworth et al., Reference Unsworth, Clifton and Smith2010). Centrally located within the CTR and with around 50,000 hectares of coral reefs, the Wakatobi harbours over 390 species of hard coral and 590 species of fish (Halford, Reference Halford, Pet-Soede and Erdmann2003; Turak, Reference Turak, Pet-Soede and Erdmann2003). However, with a large resident human population, many of whom are dependent upon reefs for both income and nutrition, the ecosystem is under considerable threat from local sources (Unsworth et al., Reference Unsworth, Clifton and Smith2010).
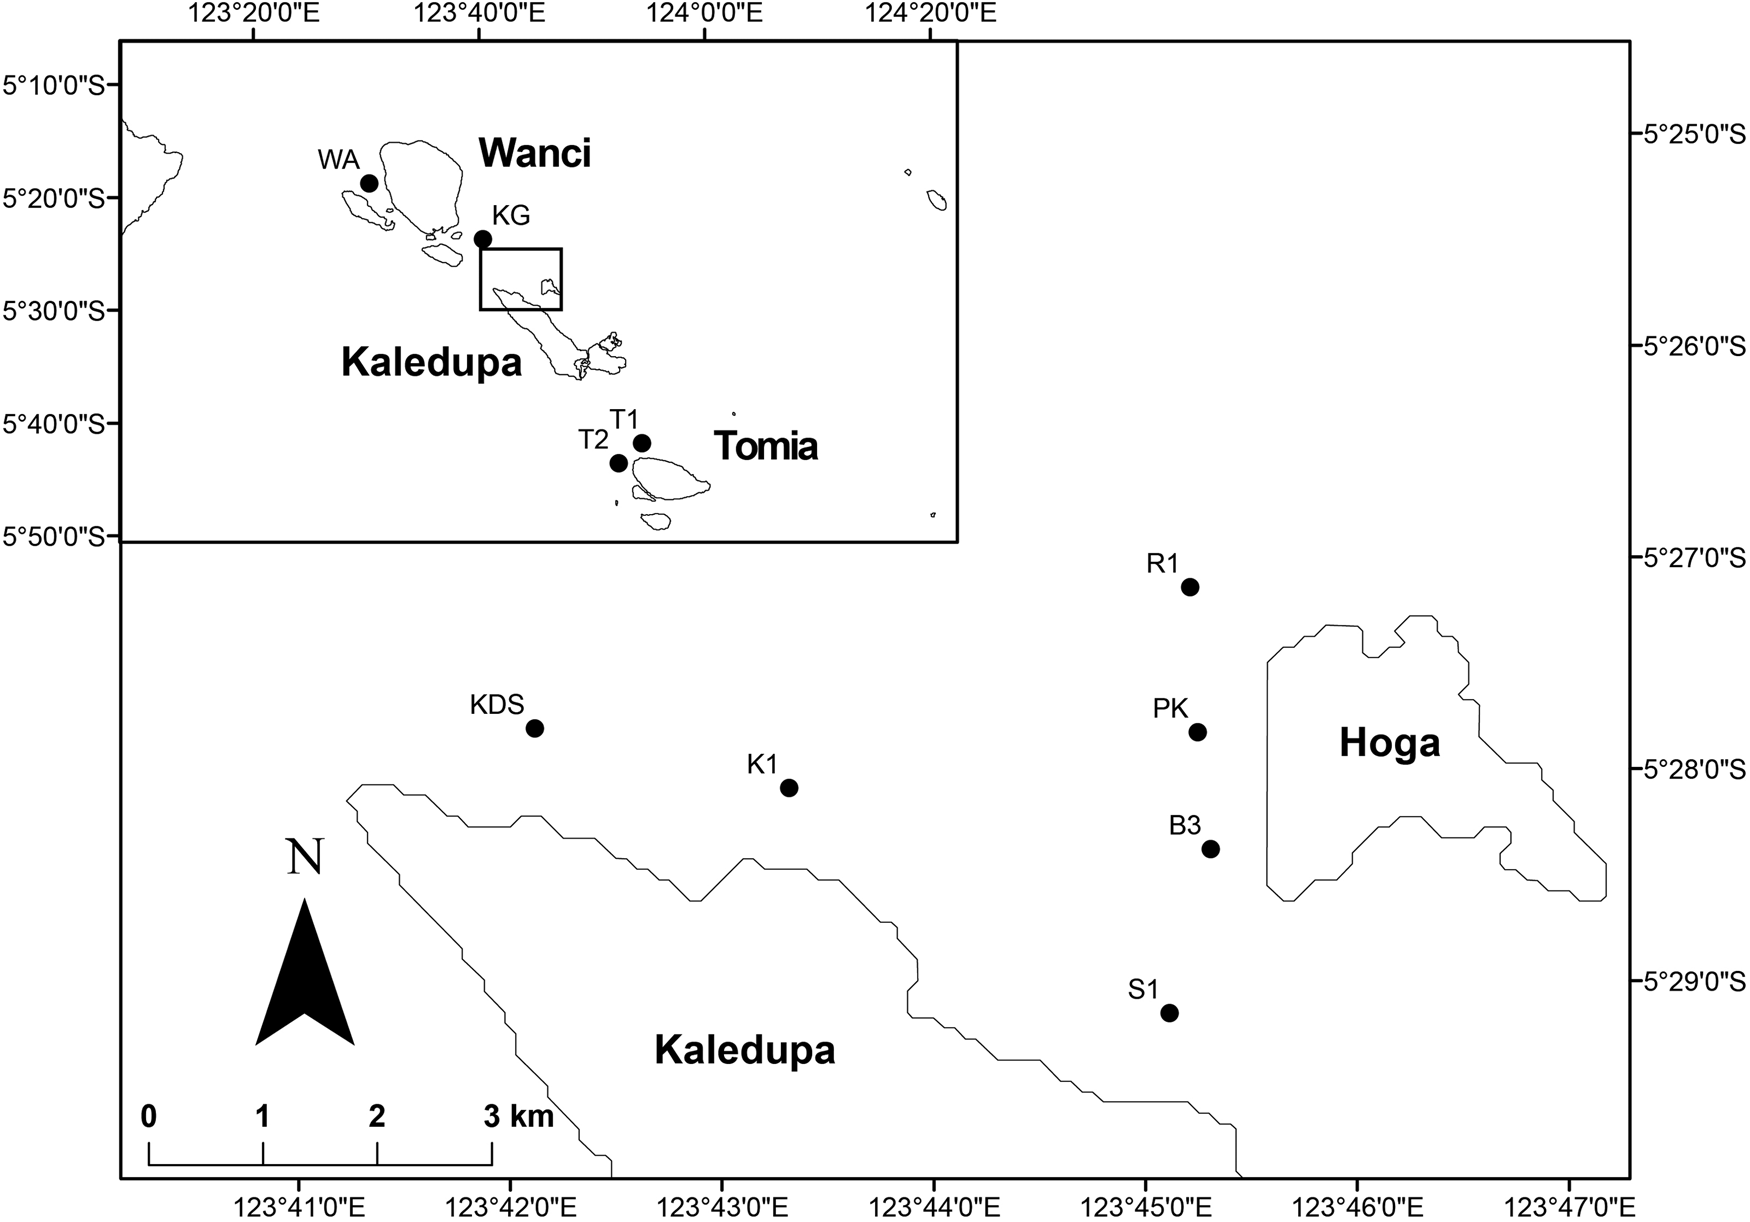
Surveys across the Wakatobi took place in July 2014 at 10 sites chosen to represent a variety of reef types and varying degrees of exposure to human activity (Figure 1; Appendix 1): Wangi, a turbid and sedimented reef within the harbour at Wangi-Wangi Island; Karang Gurita, a coral atoll located between Wangi and Kaledupa Islands; Buoy 3 and Ridge 1, steep-walled sites on the Hoga fringing reef; Pak Kasims, a sloping site on the Hoga fringing reef; Kaledupa 1 and Kaledupa Double Spur, two gentle sloping sites on the Kaledupa fringing reef; Sampela 1, on the Kalepupa fringing reef and adjacent to a Bajo village, considered to be highly degraded, sedimented and turbid (Bell & Smith, Reference Bell and Smith2004; McMellor & Smith, Reference McMellor, Smith, Clifton, Unsworth and Smith2010; Powell et al., Reference Powell, Smith, Hepburn, Jones, Berman, Jompa and Bell2014); Tomia 1 and Tomia 2, gentle sloping sites on the Tomia fringing reef. While short-term environmental data are available for some of these sites (see Powell et al., Reference Powell, Smith, Hepburn, Jones, Berman, Jompa and Bell2014; Biggerstaff et al., Reference Biggerstaff, Smith, Jompa and Bell2015; Marlow et al., Reference Marlow, Schönberg, Davy, Haris, Jompa and Bell2019) including Sampela, B3 and Pak Kasims, we do not have environmental data from all sites.
Survey sites within the wider Wakatobi (top left) and around the islands of Hoga and Kaledupa (bottom left). Sites Buoy 3, Kaledupa 1 and Kaledupa Double Spur, Karang Gurita, Pak Kasim's, Ridge 1, Sampela 1, Tomia 1 & 2, and Wanci Harbour are abbreviated as B1, B3, K1, KDS, KG, PK, R1, S1, T1, T2 and WA, respectively.

Survey design and sampling
Sampling was conducted at 5, 10 and 15 m depths at each of the 10 survey sites (Figure 1), with the exception of S1 and WA, where shallow reef depths prevented sampling at 15 m. Transects were 50 m long, start locations were chosen haphazardly and transects repeated three times at each depth and site (N = 9 per site), with a minimum of 50 m distance between transects. On each transect, 50 × 50 cm photoquadrats were taken at 1 m intervals along the transects (N = 50 and N = 150 in total for each transect and depth).
Substrate composition in the photoquadrats was analysed using Coral Point Count (CPC). Each image was overlaid with 10 randomly allocated points and the benthic types directly beneath each point were identified as one of the following categories: hard coral, soft coral, sponge, coralline algae (CCA), macroalgae, turf algae, ascidian, dead coral, reef substrate, rubble, sand, settled sediment or ‘other'. Substrate was characterized as ‘other’ when points were overlaid on less common benthic types such as bryozoans, anemones and mobile benthic invertebrates (e.g. holothurians) or when the benthic type could not be satisfactorily determined from the image. Data from across all 50 images on each transect (500 points) were averaged to create mean values of percentage cover per benthic type for each depth.
Statistical analysis
All statistical analyses were performed in PRIMER-E (version 6, Plymouth Marine Laboratory, Plymouth, UK) with the Permutational Multivariate Analysis of Variance (PERMANOVA) add on.
Differences in the abundance (% cover) of benthic groups among sites and depths (and interactions) were analysed using univariate PERMANOVAs with post hoc pairwise tests where significant differences were found. This was based on a resemblance matrix constructed using Euclidian distance similarity coefficients from square-root transformed abundance data.
To determine how the relative composition of benthic communities differed among sites and depths (and any interactions), a multivariate PERMANOVA was performed. This was based on a resemblance matrix constructed using Bray–Curtis similarity coefficients of abundance data that had been square-root transformed. Any significant results were further investigated using post hoc pairwise tests (which can be found in the Appendices). Results from the PERMANOVAs were graphically represented using principal coordinate analyses (PCOs) with overlaid Pearson's correlation (>0.4) vectors. In the event of the PERMANOVA finding a significant interaction, a Canonical analysis on the Principal Coordinates (CAP) was used to graphically represent data. Any significant differences that were discovered by the PERMANOVAs were further investigated using a SIMPER analysis to identify those benthic types that were contributing the most towards any differences in the assemblage composition.
Results
Hard corals
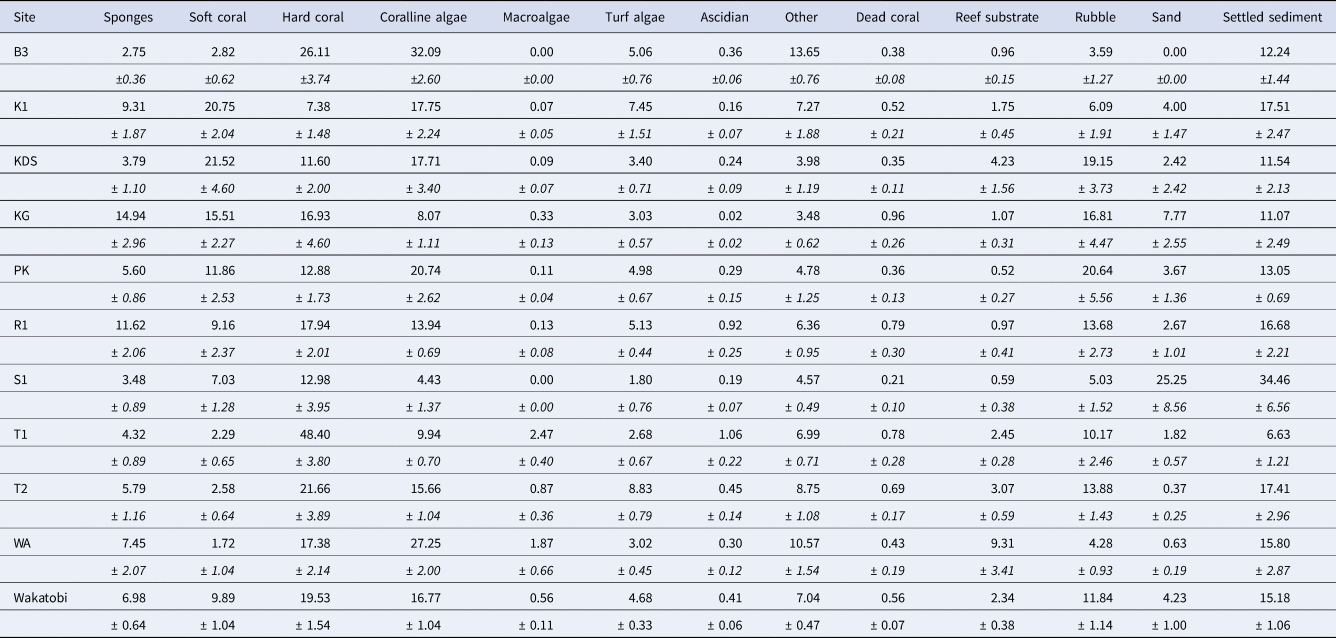
Across all 10 sites, mean hard coral was the second most dominant benthic type, with an average of 19.53% (±1.54 SE) coverage (Table 1). The highest coral abundances were found at T1 (across all three depths, 48.40% ± 3.80 SE) and the lowest at K1 (across all depths, 7.38 ± 1.48 SE) with significant differences among sites (PERMANOVA, Pseudo-F (9,84) = 14.235, P < 0.001). Post hoc tests showed that the majority of these differences were attributed to the high hard coral cover at T1 and low cover at K1; both sites had significantly different (P < 0.05) cover of hard corals from all other sites (Appendix 2). Hard coral abundance was highest at 5 m depth (21.32% ± 2.93) and lowest at 15 m (17.97% ± 2.61), however differences were not significant. A significant interaction between depth and site (PERMANOVA, Pseudo-F (16,84) = 2.1407, P = 0.019) showed that hard coral cover was significantly lower at 10 m at S1 than at 5 m on the same reef and significantly lower than at 10 m at B3, KG, PK, R1, T1 and WA (see Appendix 2 for results of pairwise test).
Average abundance (% cover) of main benthic categories per site and Wakatobi average

Standard error values in italics.
Other biotic groups
Across the Wakatobi, algae had the greatest average benthic coverage (22.0% ± 1.12 SE). This was primarily due to CCA (16.77% ± 1.04 SE), the abundance of which differed significantly among the sites (PERMANOVA, Pseudo-F (9,84) = 20.845, P = 0.001; Appendix 3) and was particularly abundant at B3 and WA (Table 1). While CCA cover did not differ significantly among depths (Table 2), there was a significant interaction between depth and site (PERMANOVA, Pseudo-F (16,84) = 2.627, P = 0.02). There was a low abundance of CCA at 10 m depth at S1; pairwise tests found that the cover of CCA (2.3% ± 0.9 SE) at this location was significantly less than at 5 m on the same reef and at 10 m at all other sites. The average cover of macroalgae (0.56% ± 0.11 SE) and turf algae (4.68% ± 0.33 SE) was considerably lower than that of CCA, especially macroalgae for which the majority of sites (with the exception of T1, T2 and WA) had less than 0.5% cover (Table 1).
Average abundance (% cover) of main benthic categories per depth profile

Standard error values in italics.
Soft coral cover occupied 9.89% (±1.04 SE) of reef substrate in the Wakatobi. Significant differences existed among sites (PERMANOVA, Pseudo-F (9,84) = 18.119, P = 0.001; Appendix 4), with cover ranging from <3% at B3, T1, T2 and WA to >20% at K1 and KDS. Soft coral cover was marginally higher at 5 m than at either 10 or 15 m depth (Table 2), but this difference was not significant. There was no significant interaction between site and depth. Sponges occupied an average cover of 6.98% (±0.64 SE), with significant differences in sponge abundance existing among sites (PERMANOVA, Pseudo-F (9,84) = 14.045, P = 0.001), depths (PERMANOVA, Pseudo-F (2,84) = 19.953, P = 0.001) and a significant interaction between site and depth (PERMANOVA, Pseudo-F (16,84) = 5.5145, P = 0.001). Pairwise analysis found that the majority of inter-site differences were due to high sponge abundance at K1, KG and R1 and low sponge abundance at B3, with intermediate abundances at the remaining sites (Table 1, Appendix 5). Differences between depths were due to significantly lower sponge abundance (4.17% ± 0.47 SE) at 5 m than at both 10 m (8.31% ± 1.15 SE) and 15 m (8.77% ± 1.41 SE; Table 2), with no significant difference in sponge abundance between 10 and 15 m. Pairwise analysis showed that the significant interaction between site and depth, was due to significantly lower sponge abundance at 10 m at S1 than 10 m at both R1 and KG.
Abiotic groups
The majority (34.15% ± 1.96 SE) of substrate on Wakatobi reefs had no living organisms. Total abiotic cover was significantly different between sites (PERMANOVA, Pseudo-F (9,84) = 6.4158, P = 0.001), but not among depths. There was a significant interaction between site and depth (PERMANOVA, Pseudo-F (16,84) = 2.4028, P = 0.012). Total abiotic cover was highest at S1 and lowest at both B3 and T1 (Table 1); post hoc pairwise tests found abiotic cover to be significantly higher at S1 than at all other sites (bar KDS) and both B3 and T1 had significantly lower abiotic cover than all other sites (Appendix 6). Most of the abiotic cover was made up of settled sediment (15.18% ± 1.06 SE of total substrate), which differed significantly between sites (PERMANOVA, Pseudo-F (9,84) = 8.1699, P = 0.001). Pairwise analysis (Appendix 7) found that differences were primarily attributed to the very high levels of settled sediment at S1 (covering nearly 35% of substrate) and low settled sediment at T1 and KG (~7 and 11% cover respectively; Table 1). The cover of settled sediment did not differ significantly between depths (Table 2) and there was no significant interaction between depth and sites. The other major abiotic component of reef substrate was coral rubble (11.84% ± 1.14 SE), the cover of which differed widely across the sites (PERMANOVA, Pseudo-F (9,84) = 5.7124, P = 0.002; Table 1; Appendix 8), making up around 20% of cover at sites such as PK and KDS, but below 6% at B3, S1 and WA. While the abundance of coral rubble did not differ significantly among depths (Table 2), there was a significant interaction between depth and sites (PERMANOVA, Pseudo-F (16,84) = 2.3134, P = 0.018). Pairwise tests found that this was primarily due to particularly low levels of coral rubble (2.6% ± 0.8 SE) at S1 at 10 m depth, which was significantly less abundant than at 5 m on the same reef and at 10 m at KG, KDS, T1 and T2.
Benthic community composition
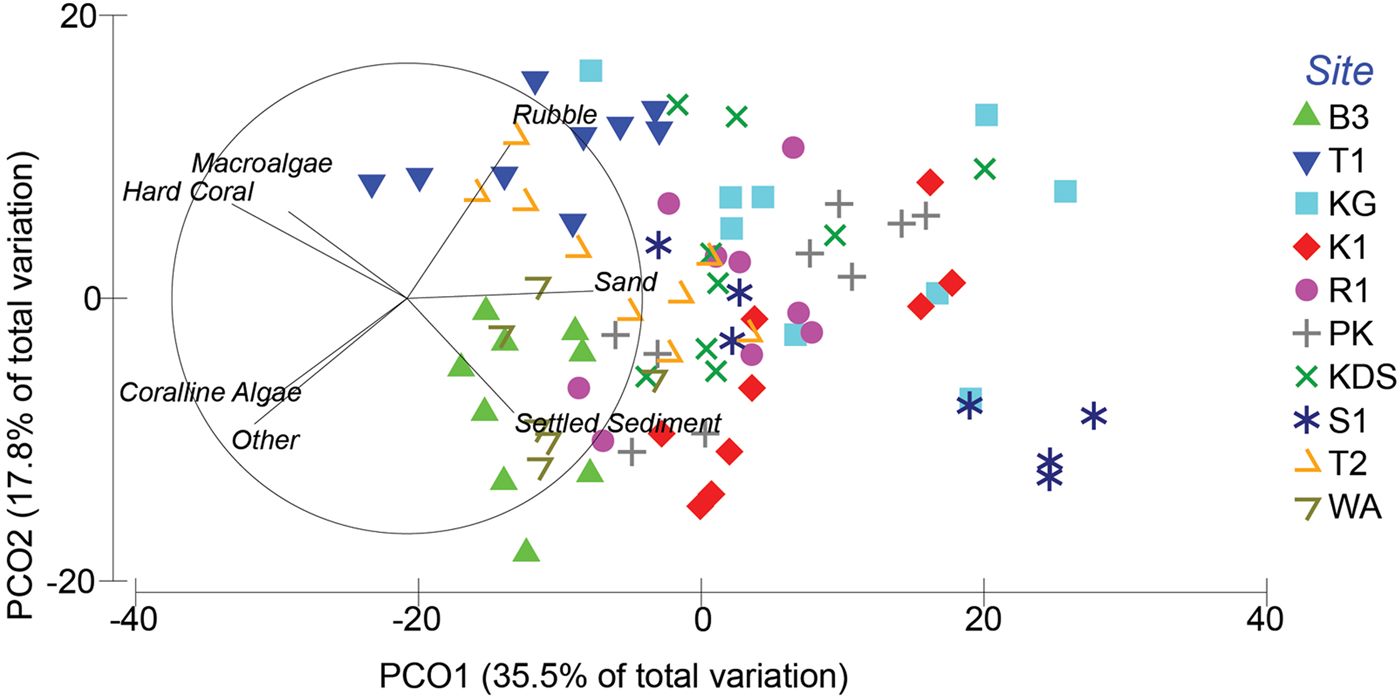
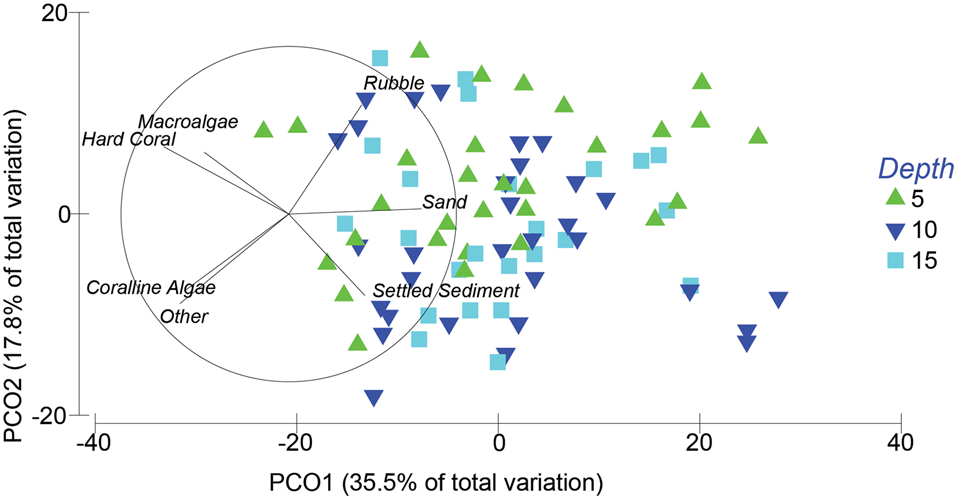
Benthic community structure (Tables 1 and 2) differed significantly among sites (PERMANOVA, Pseudo-F = 12.239, P = 0.001; Figure 2) and depths (PERMANOVA, Pseudo-F = 4.0178, P = 0.001; Figure 3). There was also a significant interaction between site and depth (PERMANOVA, Pseudo-F = 2.897, P = 0.001) on benthic community structure. Pairwise tests found that benthic assemblages differed significantly between each site (P < 0.05). The only exceptions were between the communities at PK and both R1 and KDS, which did not differ significantly. The PCO (Figure 2), which explained 53% of the variation in the Wakatobi benthic assemblages, characterized reefs at T1 and T2 by high hard coral abundance and (relatively) high macroalgal abundance. High levels of sand and settled sediment were common at S1 and rubble characterized KG, KDS, K1 and PK. Finally, high cover of coralline algae and ‘other’ was a characteristic of B3 benthos. The three communities that were characterized as being the most different by the SIMPER analysis (Appendix 9) were T1 & S1 (61.2% different), T1 & K1 (58.1% different) and KG & S1 (57.17% different). Differences between T1 & S1 were predominantly due to differences in hard coral cover (31.9%) and settled sediment (23.4%). Hard coral accounted for a similar difference (35.3%) between T1 and K1, but soft coral abundance was also important (15.9%). Differences in the sand cover (21.5%), settled sediment (24.2%) and hard coral (15%) explained the majority of differences between KG & S1.
Principal Coordinate Ordination to compare similarities in benthic/substrate composition between sites. Overlaid vectors represent individual benthic taxa/substrates that have a Pearson's correlation of greater than 0.4 with either of the PCO axes. See Figure 1 for site abbreviations.

Principal Coordinate Ordination to compare similarities in benthic/substrate composition between depths. Overlaid vectors represent individual benthic taxa/substrates that have a Pearson's correlation of greater than 0.4 with either of the PCO axes. See Figure 1 for site abbreviations.

Pairwise tests found that Wakatobi benthic communities differed significantly between 5 and both 10 and 15 m, but there was no difference between 10 and 15 m assemblages. This separation of the 5 m communities is clearly visible in the PCO (Figure 3). The SIMPER analysis (Appendix 10) found a 33.5% and 34.9% difference between 5 and both 10 and 15 m assemblages, respectively, although depth-based differences were not as great as between some sites. Differences in the cover of hard coral (16.1%), rubble (13.8%), sand (12.7%) and settled sediment (12.1%) accounted for the majority of dissimilarity between 5 and 10 m. Similar dissimilarities in the cover of rubble (18.6%), hard coral (15.7%), settled sediment (12.3%) and soft coral (10.9%) explained the majority of differences between the 5 and 15 m communities. Pairwise tests also showed that the significant interaction between depth and site is primarily due to the benthic community at 10 m at S1 being significantly different from all other sites at the same depth; assessment of the CAP ordination (Figure 3) suggests this is primarily due to a high cover of sand but low levels of ‘other’, CCA, hard coral and macroalgae.
Discussion
The Wakatobi Marine National Park has a wide variation in coral reef benthic community composition. While some reefs are dominated by high hard coral cover (>45% cover), others have very low coral cover (<5% cover). Despite coral cover in many places being below the average found in Indonesia (Bruno & Selig, Reference Bruno and Selig2007), macroalgal cover remains very low and instead a high abundance of coralline algae and non-coral invertebrates exists. This study provides a comprehensive baseline and spatial analysis covering all major benthic groups for this highly biodiverse region in the CTR. Such baseline information will serve as an important resource to identify any future changes to the benthic community composition in this region.
McMellor & Smith (Reference McMellor, Smith, Clifton, Unsworth and Smith2010) reported mean values of hard coral and macroalgal cover between 2002 and 2007 at a number of the Hoga sites we sampled; including the Ridge, Kaledupa, Kaledupa Double Spur, Sampela, B3 (termed Hoga no-take zone in the earlier study) and Pak Kasims. This was further updated with additional data by Curtis-Quick (Reference Curtis-Quick2013) to 2011 (but including the original data from 2002 and 2007 from McMellor & Smith). These studies reported average hard coral cover across the Hoga sites on the reef crest and slope between 40 (Sampela) and 70% (B3) in 2002. However, these earlier studies reported a sharp decline at all sites by 2011, with average coral cover across all six sites down to 20%, although the rate of decline varied between sites. For example, from 2002 to 2011 at Sampela, coral cover had declined from 40% at around 5 m to <5%, and from around 70% at 5 m at B3 to around 40% cover. Over the same time period, algal cover also decreased substantially at all six sites, from 20–30% (although Sampela had algal coverage between 40–50%) to <10% by 2011. Sponge cover at all Hoga sites reported by Curtis-Quick (Reference Curtis-Quick2013) was around 5% in 2002, but this had increased to around 8–10% at most sites by 2011, although there was considerable variation between the different depth zones sampled.
In the present study we found hard coral covered around 19.5% of the substrate across the 10 sites we sampled in the Wakatobi, suggesting coral cover has not declined considerably since 2011. However, we found algal (including macroalgae and turf) coverage was around 5% across all sites, suggesting a continued decline since 2011. At some sites in the Wakatobi the reduction in algal coverage was dramatic; Sampela algal abundance has declined from 50–70% (depending on depth) cover in 2011 to around 2% in 2014. We found sponge coverage across all Wakatobi sites was around 6% suggesting little change in the abundance of this group in the Wakatobi since 2002.
Given the apparent decline in coral cover that has occurred in the Wakatobi, the macroalgal cover was considerably lower than what might be expected to occur on degraded reefs. With an average of just 0.6% cover, macroalgae was considerably less abundant than coverage calculated for the Indo-Pacific (average 11.7%; Bruno et al., Reference Bruno, Sweatman, Precht, Selig and Schutte2009), pristine central Pacific reefs (13.1%; Vroom et al., Reference Vroom, Page, Kenyon and Brainard2006; Sandin et al., Reference Sandin, Smith, DeMartini, Dinsdale, Donner, Friedlander, Konotchick, Malay, Maragos, Obura and Pantos2008), and historical baselines from the Caribbean (2%; Côté et al., Reference Côté, Gill, Gardner and Watkinson2005; Schutte et al., Reference Schutte, Selig and Bruno2010; Bruno et al., Reference Bruno, Precht, Vroom and Aronson2014). Interestingly, macroalgal cover was highest (2.5%) on the reef (T1) with the highest coral cover. Despite an apparent recent decline in coral cover, macroalgae do not appear to have benefited from the reduction in their spatial competitors. These observations suggest that macroalgal abundance is not always the single best indicator of coral reef health, as has been previously suggested (Steneck & Sala, Reference Steneck, Sala, Ray, Redford, Steneck and Berger2005). The proliferation of macroalgae on many degraded reefs has not just been attributed to increased substrate availability, but also reduced herbivory (overfishing/disease) and eutrophication (Hughes, Reference Hughes1994; Pandolfi et al., Reference Pandolfi, Jackson, Baron, Bradbury, Guzman, Hughes, Kappel, Micheli, Ogden, Possingham and Sala2005). In the Wakatobi, in the absence of large rivers and agriculture, chlorophyll a concentration is low (Marlow et al., Reference Marlow, Schönberg, Davy, Haris, Jompa and Bell2019) and eutrophication is not considered to be a problem. Conversely, local fishing pressure appears to exceed the maximum sustainable yield and the widespread use of unselective fish fences (Exton, Reference Exton, Clifton, Unsworth and Smith2010) is likely to be negatively affecting the local herbivorous fish population. Nevertheless, evidence from elsewhere in Sulawesi suggests that high regional fish species diversity allows for greater resilience and the maintenance of functional herbivory, even under high fishing pressure (Plass-Johnson et al., Reference Plass-Johnson, Ferse, Jompa, Wild and Teichberg2015). It is not clear why macroalgal abundance has declined so rapidly, but this could relate to changes in grazer communities or light quality and warrants further investigation.
While macroalgal cover was unexpectedly low, the abundance of coralline algae (CCA) was high, occupying nearly 17% of the reef area in the Wakatobi. CCA abundance was lowest at S1, the reef that is adjacent to the Bajau village of Sampela with a high level of sedimentation and turbidity (Biggerstaff et al., Reference Biggerstaff, Smith, Jompa and Bell2015, Reference Biggerstaff, Smith, Jompa and Bell2017a; Marlow et al., Reference Marlow, Davy, Haris and Bell2018). This is consistent with studies on the Australian Great Barrier Reef (Fabricius & De'ath, Reference Fabricius and De'Ath2001), where the cover of CCA is correlated with distance across the shelf and inversely with sedimentation. As CCA (and associated microbial biofilms) is known to play an important role in the induction of larval settlement for many sessile invertebrates (Heyward & Negri, Reference Heyward and Negri1999; Webster et al., Reference Webster, Smith, Heyward, Watts, Webb, Blackall and Negri2004), successful recovery of hard corals is less likely at degraded sites, such as Sampela, where CCA cover is low. Conversely, at sites such as B3 where CCA cover was particularly high (32%), previous studies have found that coral recruitment is indeed significantly greater than at S1 (Salinas-de-León et al., Reference Salinas-de-León, Dryden, Smith and Bell2013). Turf algae in the Wakatobi occupied nearly 5% of reef area – considerably more than macroalgae. Typically considered to be less than 1 cm in height (Connell et al., Reference Connell, Foster and Airoldi2014), turf algae is a less conspicuous element of reef benthos but is also thought to increase in abundance on degraded reefs (Littler et al., Reference Littler, Littler and Brooks2006). The relative success of turf algae may be due to their capacity to rapidly occupy dead calcareous substrate (Diaz-Pulido & McCook, Reference Diaz-Pulido and McCook2002) and higher resilience to herbivory than macroalgae (Hay, Reference Hay1981). Although not as well studied as macroalgae in relation to reef degradation, turf algae are spatial competitors with corals (Swierts & Vermeij, Reference Swierts and Vermeij2016) and their presence can reduce the success of coral recruitment (Arnold et al., Reference Arnold, Steneck and Mumby2010). Unfortunately, the previous studies in the Wakatobi did not distinguish turf algae from other algal types to allow comparisons with our data.
The most numerous benthic types after hard corals and algae were soft corals (9.9%), which were particularly abundant at K1 and KDS, where they were the dominant benthic type. In 2002 branching corals occupied 15–25% of the respective reef substrates at K1 and KDS but events such as widespread blast fishing in 2004 reduced a large percentage of these corals to rubble (Curtis-Quick, Reference Curtis-Quick2013). The occupation of blasted coral rubble by soft coral, particularly Xenia spp., has also been observed in the Komodo and Bunaken National Parks in Indonesia (Fox et al., Reference Fox, Pet, Dahuri and Caldwell2003). Soft corals are early colonizers of coral reef substrates, are effective spatial competitors and are known to have dominated degraded coral reefs elsewhere including the Seychelles (Stobart et al., Reference Stobart, Teleki, Buckley, Downing and Callow2005), Australia (Endean et al., Reference Endean, Cameron and DeVantier1988) and Fiji (Robinson, Reference Robinson1971). Evidence from Indonesia suggests that despite the ability of soft corals to consolidate coral rubble, their presence also inhibits hard coral recruitment, growth and survival (Fox et al., Reference Fox, Pet, Dahuri and Caldwell2003, Reference Fox, Mous, Pet, Muljadi and Caldwell2005), thereby preventing recovery on blasted reefs.
Sponges were a conspicuous part of reef benthos, with an average abundance of 7% cover, that ranged from 2.8% at B3 to 15% at KG. While sponges have been proposed as potential winners as corals decline (see Bell et al., Reference Bell, Davy, Jones, Taylor and Webster2013), the abundance of only one sponge species is currently known to be increasing in the Wakatobi (Biggerstaff et al., Reference Biggerstaff, Jompa and Bell2017b). Lamellodysidea herbacea is a small phototrophic encrusting sponge that is highly adaptable to changes in light availability and sediment deposition (Biggerstaff et al., Reference Biggerstaff, Smith, Jompa and Bell2015, Reference Biggerstaff, Smith, Jompa and Bell2017a). The abundance of L. herbacea has increased at the Sampela reef S1 (from 17 to 25% of the available substrate from 2013–2015), where other sponges are known to struggle to survive (Powell et al., Reference Powell, Smith, Hepburn, Jones, Berman, Jompa and Bell2014; Biggerstaff et al., Reference Biggerstaff, Jompa and Bell2017b; Marlow et al., Reference Marlow, Schönberg, Davy, Haris, Jompa and Bell2019). While small encrusting sponge species are dominant at S1, the high abundances at KG were predominantly due to large numbers of the giant barrel sponges Xestospongia spp. and other massive morphologies (J. Marlow personal communication).
Depth-based differences in the abundance of individual taxa and the overall benthic community was not as distinct as inter-site differences. Bathymetric differences in shallow coral reef communities are normally attributed to the zonation of nutritional resources, light availability, spatial competition and physical exposure. For example, increasing light attenuation reduces the abundance of obligate-phototrophic fleshy macroalgae at depth, while more mixotrophic taxa such as many coral species, can occupy a broader depth range (Williams et al., Reference Williams, Smith, Conklin, Gove, Sala and Sandin2013, Reference Williams, Sandin, Zgliczynski, Fox, Gove, Rogers, Furby, Hartmann, Caldwell and Price2018). Indeed, in the Wakatobi total hard coral cover showed little variation with depth. The greater abundance of sponges at 10 and 15 m depth than on shallower surveys could be due to reduced physical exposure, as turbulence is believed to limit the abundance and diversity of sponges to below 10 m in the GBR (Wilkinson & Evans, Reference Wilkinson and Evans1989). Interestingly, the benthic community at 10 m at S1 was consistently shown to differ from other reefs at this depth; with a reduced abundance of hard corals, CCA and sponges. The environment on this reef is known to be highly sedimented, turbid and with significantly less available light for photosynthesis (PAR) than at reciprocal depths on other local reefs (Biggerstaff et al., Reference Biggerstaff, Smith, Jompa and Bell2015, Reference Biggerstaff, Smith, Jompa and Bell2017a; Marlow et al., Reference Marlow, Davy, Haris and Bell2018). It is this environment which is thought to be responsible for reduced coral growth rates (Crabbe & Smith, Reference Crabbe and Smith2005), lower sponge diversity (Powell et al., Reference Powell, Smith, Hepburn, Jones, Berman, Jompa and Bell2014) and likely the cause of the reduced CCA found in our study.
Benthic composition of reefs in the Wakatobi was highly variable, which likely reflects variation in abiotic conditions and past history of exploitation. While some reefs still have high levels of coral cover others have very low coral cover. However, decreases in these spatially dominant taxa have not resulted in a shift to macroalgal-dominance or dominance by any other singular taxonomic group. Instead benthic composition appears to have shifted in a less uniform manner and assemblage composition differs significantly among sites that are separated by small geographic distances.
Supplementary material
The supplementary material for this article can be found at https://doi.org/10.1017/S0025315419001012.
Acknowledgements
This study was facilitated by Operation Wallacea who provided travel funding and access to research facilities in the Wakatobi. Funding was also provided by Victoria University of Wellington doctoral scholarships to Joseph Marlow and Holly Bennett. Joseph Marlow conducted this research as an exchange student of Hasanuddin University and under a research permit issued to Hasanuddin University from the Indonesian Ministry of Research and Technology (RISTEK).