


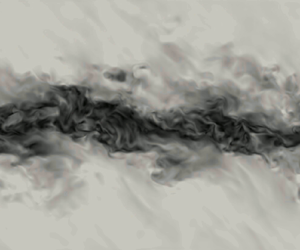



1. Introduction
Dense gases (DGs) are single-phase vapours characterised by long chains of atoms and by medium to large molecular weights. They have been widely used in the organic Rankine cycles (ORCs) industry over the past 40 years. Their large heat capacity and their low boiling point temperature make them suitable working fluids for low-temperature heat sources (solar, geothermal, biomass, heat recovery). The coupling with a turbine enables power generation. Recently, because of issues caused by carbon-based fossil fuels, there has been a strong research effort in developing this technology by improving ORC turbine efficiency.
Rotating elements are a main source of losses for turbines. Their use in transonic and supersonic regimes are associated with shocks which generate entropy. However, for DGs, entropy jumps through shocks are significantly reduced in specific thermodynamic regions (Cinnella & Congedo Reference Cinnella and Congedo2007). This feature could enable to increase ORC turbines efficiency, but the lack of knowledge about DGs in these particular thermodynamic regions close to the vicinity of the critical point restrains ORC designers. This study seeks to widen knowledge about turbulence characteristics of these gases by comparing their behaviour with perfect gases on a classical configuration: the mixing layer.
A specific type of DG is used in these simulations: the Bethe–Zel'dovich–Thompson (BZT) gases, whose name was given at first by Cramer (Reference Cramer1991) to acknowledge the pioneering works of Bethe (Reference Bethe1942), Zel'dovich (Reference Zel'dovich1946) and Thompson (Reference Thompson1971). Unlike other DGs, they comprise an inversion thermodynamic region where the fundamental derivative of gas dynamics  $\varGamma$ becomes negative, as shown in figure 1. Thompson (Reference Thompson1971) defines
 $\varGamma$ as
 \begin{equation} \varGamma=\left.\frac{v^3}{2c^2}\frac{\partial^2p}{\partial v^2}\right|_s=\left.\frac{c^4}{2v^3}\frac{\partial^2 v}{\partial p^2}\right|_s=1+\left.\frac{\rho}{c}\frac{\partial c}{\partial \rho}\right|_s, \end{equation}
where  $v$ is the specific volume,
 $\rho$ the density,
 $c=\sqrt {\partial p/\partial \rho |_s}$ the speed of sound,
 $p$ the pressure and
 $s$ the entropy. For thermally and calorically perfect gases, the fundamental derivative is equal to
 $(\gamma +1)/2$, with
 $\gamma$ the heat capacity ratio. In this case, its value is always greater than one, unlike DG flows, where
 $\varGamma$ can become lower than one and even be negative for BZT DGs. In that case, rarefaction shock waves can occur, which is forbidden by the second law of thermodynamics in usual gases, where only compression shock waves are allowed.
The initial thermodynamic state is represented in the non-dimensional  $p$–
 $v$ diagram for BZT DG FC-70 at
 $M_c=2.2$. The DG zone (
 $\varGamma <1$) and the inversion zone (
 $\varGamma <0$) are plotted for the Martin–Hou equation of state. Here,
 $p_c$ and
 $v_c$ are respectively the critical pressure and the critical specific volume. The initial value of the fundamental derivative of gas dynamics is equal to
 $\varGamma _{\textit {initial}} = -0.284$. The normalised distribution of the thermodynamic states is plotted at the beginning of the self-similar period (
 $\tau = 4000$) along the curve where the distribution of thermodynamic states is the largest.

Bethe (Reference Bethe1942) expressed the entropy jump expression across shock waves as a function of the fundamental derivative
 \begin{equation} \Delta s=s_2-s_1={-}\left(\frac{\partial^2 p}{\partial v^2}\right)_s \frac{\Delta v^3}{12T} + O(\Delta v^4)={-}\frac{c^2 \varGamma}{v^3} \frac{\Delta v^3}{6T} + O(\Delta v^4), \end{equation}
with  $T$ the temperature. In the case of compression shock waves, the specific volume variation is negative (
 $\Delta v<0$), so that the fundamental derivative must be positive (
 $\varGamma >0$) to ensure that the entropy jump remains positive (
 $\Delta s>0$), thus satisfying the second law of thermodynamics. Only compression shock waves are physically admissible for classical ideal gases since
 $\varGamma > 1$. For BZT gases, the fundamental derivative being negative (
 $\varGamma <0$), physically admissible shock waves in the inversion region are expansion shock waves such that the specific volume variation is positive (
 $\Delta v>0$) to ensure the entropy jump remains positive. Moreover, since entropy jumps are proportional to the fundamental derivative
 $\varGamma$, which is of small amplitude in DG flows, the intensity of shocks is significantly reduced (Cramer & Kluwick Reference Cramer and Kluwick1984). In addition to a peculiar thermodynamic behaviour, the sound speed is much lower in DGs when compared with perfect gases, which makes compressibility regimes much more easily accessible.
Up to now, although thermodynamic features of DGs are very different from ones of perfect gases, in the absence of a better option, perfect gas turbulence closure models coupled with real-gas thermal and calorific equation of state (EoS) have been used for Reynolds-averaged Navier–Stokes and large eddy simulation (LES) to simulate DG flows (Cinnella & Congedo Reference Cinnella and Congedo2005; Wheeler & Ong Reference Wheeler and Ong2014; Durá Galiana, Wheeler & Ong Reference Durá Galiana, Wheeler and Ong2016). This choice implicitly assumes that turbulent structures are not affected by DG effects. This hypothesis is not yet verified and constitutes an open research field. There are currently no experimental data to verify this hypothesis because maintaining the flow in the vicinity of the critical point where physical quantities are experiencing strong variations is a very complex task.
Direct numerical simulation (DNS) is the tool of choice used in this study to assess this hypothesis. DNS enables to solve every turbulent scale down to the smallest one corresponding to the Kolmogorov length scale without resorting to any turbulence closure model. So far, few DNS of DG flows have been achieved. DNS of decaying homogeneous isotropic turbulence (HIT) performed by Giauque, Corre & Menghetti (Reference Giauque, Corre and Menghetti2017) shows that the dynamic Smagorinsky sub-grid-scale model is not able to correctly capture the temporal decay of the turbulent kinetic energy. They extended their analysis by performing a forced HIT highlighting significant differences in the sub-grid scale baropycnal work and the resolved pressure dilatation, which is reduced by a factor of 2 in a DG when compared with a perfect gas (PG) (Giauque, Corre & Vadrot Reference Giauque, Corre and Vadrot2020).
Sciacovelli, Cinnella & Grasso (Reference Sciacovelli, Cinnella and Grasso2017b) performed DNS of decaying HIT and notice reduced levels of thermodynamic fluctuations in DG flows due to the decoupling of thermal and dynamic phenomena caused by the large heat capacity. The Eckert number, which quantifies the ratio between the kinetic energy and the internal energy, is indeed much smaller in DG flows. They also display a more symmetric probability density function of the velocity divergence in BZT DG flows, explained by the presence of expansion shocklets and by the attenuation of compression shocklets. They show that turbulence structures are modified by expansion regions: the occurrence of non-focal convergent structures in DG flows diminishes the vorticity and counterbalances enstrophy destruction. Sciacovelli, Cinnella & Gloerfelt (Reference Sciacovelli, Cinnella and Gloerfelt2017a) analyse DG flow behaviour in a turbulent channel flow. The initial thermodynamic state was this time chosen in a non-BZT DG region. They observe significant differences with respect to PG flows in thermodynamic variables. Temperature variations are small in DGs, which leads to an almost isothermal evolution. The viscosity decreases from the wall towards the centreline unlike in PG flows. They also notice significant differences in the shape and rates of the fluctuating density and temperature distributions. It is also found that the structure of turbulence is not deeply affected in DG flows. An extension of this study to the BZT DG region and to a larger Mach number would help to conclude on BZT DG effect on turbulence development. Gloerfelt et al. (Reference Gloerfelt, Robinet, Sciacovelli, Cinnella and Grasso2020) performed the DNS of a DG compressible boundary layer at Mach numbers ranging from  $0.5$ to
 $6$. They especially confirm the decoupling between dynamical and thermal effects, which leads to a suppression of friction heating. The most remarkable consequence is that the boundary layer thickness remains equal to its value in the incompressible regime as the Mach number increases.
Recently, Vadrot, Aurélien & Alexis (Reference Vadrot, Giauque and Corre2020) performed DNS of temporal compressible mixing layers for BZT DG flow and PG flow at a convective Mach number  $M_c=1.1$, which is defined as
 \begin{equation} M_{c} = (u_{1}-u_{2})/(c_{1}+c_{2}), \end{equation}
where  $u_i$ and
 $c_i$ denote the flow speed and the sound speed of stream
 $i$ (upper or lower) of the mixing layer.
They show that the mixing layer is significantly affected by DG effects during the initial unstable growth phase, revealing a much faster unstable growth in the DG flow. However, only slight differences are observed during the self-similar period, which is the regime of interest when studying mixing layers. Self-similarity is thoroughly described in § 3.1. Results from this initial study at  $M_c=1.1$ also show that the turbulent Mach number (1.4) is in the low limit to get shocklets
 \begin{equation} M_t = \frac{\sqrt{\overline{u_i'u_i'}}}{c}. \end{equation}
The authors expect that shocklets, which exhibit very different properties in DG flows when compared with PG flows, would have an impact on the mixing layer growth. In order to account for these additional effects, an extent of the study to larger convective Mach numbers is hereby considered.
Since it is known that there are major differences between BZT DG flow and PG flow in shocklet generation, a study in a higher compressible regime would help to answer the following question: Is the mixing layer growth rate modified in BZT DG flows?
Over the past 30 years, many DNS of mixing layers have been achieved. The first ones were performed by Sandham & Reynolds (Reference Sandham and Reynolds1990), Luo & Sandham (Reference Luo and Sandham1994) and Vreman, Sandham & Luo (Reference Vreman, Sandham and Luo1996). These DNS use the PG hypothesis. A common feature of compressible mixing layers, shown by experiments at first and DNS afterwards, is the reduction of the mixing layer growth rate with the increase of the convective Mach number. However, detailed mechanisms responsible for this trend are still under investigations.
At first, additional terms in the turbulent kinetic energy equation due to compressibility effects: compressible dissipation  $\epsilon _d$ and pressure dilatation
 $\varPi _{ii}$ were suspected to be responsible for the growth rate reduction. Zeman (Reference Zeman1990) and Sarkar et al. (Reference Sarkar, Erlebacher, Hussaini and Kreiss1991) especially proposed models for the dilatation dissipation. However, it was shown by Sarkar (Reference Sarkar1995) that the growth rate diminution is primarily due to the reduction of turbulent production and not to dilatation terms. Vreman et al. (Reference Vreman, Sandham and Luo1996) confirmed that dilatation terms play a minor role in mixing layer growth and extended a previous analysis, showing that pressure-strain term
 $\varPi _{ij}$ diminution is responsible for the turbulent production decrease. They also noticed, thanks to DNS that this diminution is mainly due to the decrease of pressure fluctuations normalised by the dynamic pressure (
 $p_{\textit {rms}}/(\frac {1}{2}\rho _0 (\Delta u)^2)$). Pantano & Sarkar (Reference Pantano and Sarkar2002) later demonstrated analytically the aforementioned observation. Hamba (Reference Hamba1999) performed the DNS of a homogeneous shear flow varying
 $M_t$ from
 $0.1$ to
 $0.3$. The author identifies a dissipative term, responsible for the normalised pressure fluctuations diminution, in the transport equation for
 ${p'}^2$ called pressure-variance dissipation and which depends on the thermal conductivity. Several turbulence models were next proposed, based on the normalised pressure fluctuations reduction (Fujiwara, Matsuo & Arakawa Reference Fujiwara, Matsuo and Arakawa2000; Park & Park Reference Park and Park2005; Huang & Fu Reference Huang and Fu2008).
However, few experiments and DNS have been achieved at high  $M_c$. Rossmann, Mungal & Hanson (Reference Rossmann, Mungal and Hanson2001) have experimentally studied higher compressibility regimes up to
 $M_c=2.25$ and Matsuno & Lele (Reference Matsuno and Lele2020) recently performed DNS of temporal mixing layers up to
 $M_c=2.0$, but none of them is performed for real gas, let alone for DG flows.
In the present article, several three-dimensional DNS of compressible DG mixing layers are performed for the first time at  $M_c=2.2$. A comparison is made between PG and DG flows. Evolution of the mixing layer growth rate as a function of the convective Mach number is compared between PG and DG flows. This study extends previous analysis conducted at
 $M_c=1.1$ (Vadrot, Aurélien & Alexis Reference Vadrot, Giauque and Corre2020).
An unusual behaviour is noticed, as the decrease of the mixing layer growth rate with the convective Mach number does not follow the same evolution between DG and PG flows. The discrepancy is not significant at lower Mach number  $M_c=1.1$ (Vadrot, Aurélien & Alexis Reference Vadrot, Giauque and Corre2020) but when the convective Mach number increases, DG mixing layer growth is influenced by modified thermodynamic behaviour. Differences are first analysed in the context of the peculiar shocklets properties in BZT DG flows. Finally, thermodynamic behaviour of DG flows is also investigated.
The first section is devoted to the problem description exposing the main physical and numerical parameters. Results are validated for the PG flow in the second section with a comparison to available results in the literature. Comparison is made between DG and PG in § 4. Finally, a physical analysis of discrepancies between DG and PG flows is conducted thanks to additional DNS performed at different thermodynamic operating points (§ 5). The aim of this analysis is to highlight and explain differences between BZT DG and PG flows at large convective Mach number.
2. Problem formulation
2.1. Initialisation
The problem consists in extending the analysis conducted at  $M_c=1.1$ in Vadrot, Aurélien & Alexis (Reference Vadrot, Giauque and Corre2020) by performing a DNS of a three-dimensional mixing layer at a convective Mach number
 $M_c=2.2$ for air considered as a PG and for a BZT DG: the perfluorotripentylamine (FC-70,
 $C_{15}F_{33}N$). Physical parameters associated with FC-70 and used in these DNS are given in table 1.
Physical parameters of FC-70 (Cramer Reference Cramer1989). The critical pressure  $p_c$, the critical temperature
 $T_c$, the boiling temperature
 $T_b$ and the compressibility factor
 $Z_c=p_c v_c/(RT_c)$ are the input data for the Martin–Hou equation. The critical specific volume
 $v_c$ is deduced from the aforementioned parameters. The exponent
 $n$ and the
 $c_v(T_c)/R$ ratio are used to compute the heat capacity
 $c_v(T)$ (
 $R=\mathcal {R}/M$ being the specific gas constant computed from the universal gas constant
 $\mathcal {R}$ and
 $M$, the gas molar mass).

The initial thermodynamic state is chosen inside the inversion region in order to favour the occurrence of expansion shocklets, physically allowed in BZT DGs. Figure 1 shows the initial state in the  $p$–
 $v$ diagram and its distribution during the beginning of the self-similar regime at
 $\tau =4000$ for DG flow. The initial value of the fundamental derivative is
 $\varGamma _{\textit {initial}} = -0.284$ which makes possible the appearance of expansion shocklets. The distribution spreads inside and slightly outside the inversion region. One can also note that the distribution does not perfectly follow the initial adiabatic curve. Mechanical dissipation and shocklets entropy losses are responsible for this discrepancy because their effect cannot be neglected at
 $M_c=2.2$.
For air, the same values of reduced specific volume and reduced pressure are selected for the initial thermodynamic state. Critical values used for air are the critical pressure  $p_c=3.7663 \times 10^6$ Pa and the specific volume
 $v_c=3.13 \times 10^{-3}$ m
 $^3$ kg
 $^{-1}$ (Stephan & Laesecke Reference Stephan and Laesecke1985).
Key non-dimensional parameters are the convective Mach number (1.3) and the Reynolds number based on the initial momentum thickness  $\delta _{\theta ,0}$
 \begin{equation} Re_{\delta_{\theta,0}}=\Delta u \delta_{\theta,0}/\nu, \end{equation}
where  $\nu$ denotes the kinematic viscosity and the momentum thickness at time
 $t$ is defined as
 \begin{equation} \delta_\theta(t) = \frac{1}{\rho_{0} (\Delta u)^{2}} \int_{-\infty}^{+\infty} \bar{\rho} \left( \frac{(\Delta u)^{2}}{4}-{\tilde{u}}_{x}^{2} \right) {\textrm{d} y}, \end{equation}
with  $\rho _{0} = (\rho _{1} + \rho _{2})/2$ the averaged density and
 $\tilde {u}_x$ the Favre-averaged streamwise velocity defined in (2.9).
The initial momentum thickness Reynolds number is set equal to  $160$ for all the DNS following Pantano & Sarkar (Reference Pantano and Sarkar2002). Table 2 summarises the computational parameters of simulations performed for different
 $M_c$ (domain size, number of grid elements, dimensional values of velocity, initial momentum thickness and initial turbulent structures sizes). Additional DG simulations given in Appendix A have been performed for other domain sizes and resolutions to validate the current DNS. The impact on the selection of the self-similar period is also analysed in Appendix A.
Simulation parameters.  $L_x$,
 $L_y$ and
 $L_z$ denote computational domain lengths measured in terms of initial momentum thickness;
 $N_x$,
 $N_y$ and
 $N_z$ denote the number of grid points;
 $L_0$ denotes the size of initial turbulent structures (
 $k_0=2{\rm \pi} /L_0$) measured in terms of initial momentum thickness. All grids are uniform.

The temporal mixing layer consists of two streams flowing in opposite directions. The velocity in the upper part of the domain  $U_1$ is set equal to
 $-\Delta u/2$, whereas
 $U_2$ is set to
 $\Delta u/2$. A representation of the computational domain is provided in figure 2. A snapshot of the velocity magnitude is also plotted for the DG DNS at
 $M_c=2.2$. A further analysis of the flow field visualisation is given in Appendix B. Periodic boundary conditions are imposed in the
 $x$ and
 $z$ directions and non-reflective conditions are set in the
 $y$ directions using the Navier–Stokes characteristic boundary conditions model proposed by Poinsot & Lele (Reference Poinsot and Lele1992).
Configuration of the temporal mixing layer. The velocity magnitude is plotted for the DG DNS at  $M_c=2.2$ at
 $\tau = 4000$.

The streamwise velocity field is initialised using an hyperbolic tangent profile
 \begin{equation} \bar{u}_{x}(y) = \frac{\Delta u}{2} \tanh{\left(-\frac{y}{2\delta_{\theta, 0}}\right)}. \end{equation}
The complete streamwise velocity field is obtained by adding fluctuations to the average velocity. For the  $y$ and
 $z$ components, the average velocity is set equal to zero. A Passot–Pouquet spectrum is imposed for initial velocity fluctuations
 \begin{equation} E(k) = (k/k_0)^4 \exp({-}2(k/k_0)^2), \end{equation}
where  $k$ denotes the wavenumber. The peak wavenumber
 $k_0$ controls the size of the initial turbulent structures. Its influence on the mixing layer growth is investigated in Appendix A. Its value only influences the initial unstable growth regime. It has been noted that a larger value of
 $k_0$ accelerates the transition to the unstable growth. Its value for each DNS is given in table 2. The velocity field is then filtered to initialise turbulence only inside the initial momentum thickness.
2.2. Governing equations
In order to describe the temporally evolving mixing layer, the unsteady, three-dimensional, compressible Navier–Stokes equations are solved:
 $$\begin{gather} \frac{\partial \rho}{\partial t} + \frac{\partial (\rho u_{i})}{\partial x_{i}}=0, \end{gather}$$
 $$\begin{gather}\frac{\partial (\rho u_{i})}{\partial t}+ \frac{\partial (\rho u_{i} u_{j})}{\partial x_{j}} ={-}\frac{\partial p}{\partial x_{i}} + \frac{\partial \tau_{ij}}{\partial x_{j}}, \end{gather}$$
 $$\begin{gather}\frac{\partial (\rho E)}{\partial t}+\frac{\partial [(\rho E+p)u_{j}]}{\partial x_{j}} = \frac{\partial ( \tau_{ij} u_{i}-q_{j})}{\partial x_{j}}, \end{gather}$$
where  $\tau _{ij} = \mu ({\partial u_{i}}/{\partial x_{j}}+ {\partial u_{j}}/{\partial x_{i}} -\frac {2}{3}({\partial u_{k}}/{\partial x_{k}})\delta _{ij})$ denotes the viscous stress tensor (
 $\mu$ the dynamic viscosity),
 $E = e + \frac {1}{2} u_{i}u_i$, the specific total energy (
 $e$, the specific internal energy),
 $q_{j} = - \lambda ({\partial T}/{\partial x_j})$, the heat flux given by Fourier's law (
 $\lambda$, the thermal conductivity).
Part of this study is conducted thanks to the analysis of the turbulent kinetic energy (TKE) equation terms. It requires to decompose density, pressure and velocity into mean and fluctuating components as follows:
 \begin{equation} \left\{ \begin{array}{@{}l} \rho = \bar{\rho} + \rho',\\ p = \bar{p} + p', \\ u_{i} = \tilde{u}_{i} + u_{i}'', \end{array}\right. \end{equation}
where  $\bar {\phi }$ denotes the Reynolds average for a flow variable
 $\phi$ while the Favre average
 $\tilde {\phi }$ is defined as
 \begin{equation} \tilde{\phi} = \frac{\overline{\rho \phi}}{\bar{\rho}}. \end{equation}
Reynolds fluctuations are noted  $\phi '$ while Favre fluctuations are noted
 $\phi ''$. Reynolds averaging is equivalent to plane averaging along the
 $x$ and
 $z$ directions because of the use of periodic boundary conditions. The TKE equation is obtained from the Navier–Stokes equation by applying the averaging process
 \begin{align} \frac{\partial \bar{\rho} \tilde{k}}{\partial t}+\frac{\partial \bar{\rho} \tilde{k} \tilde{u}_{j}}{\partial x_{j}}& = \underbrace{-\overline{\rho u_{i}'' u_{j}''}\frac{\partial \tilde{u}_{i}}{\partial x_{j}}}_{\textit{Production}} -\underbrace{\overline{\tau_{ij}' \frac{\partial u_{i}''}{\partial x_{j}}}}_{\textit{Dissipation}} \nonumber\\ &\quad -\underbrace{\frac{1}{2}\frac{\partial \overline{\rho u_{i}'' u_{i}'' u_{j}''}}{\partial x_{j}}}_{\textit{Turbulent}\ \textit{transport}} - \underbrace{\frac{\partial \overline{p' u_{i}''}}{\partial x_i}}_{\textit{Pressure}\ \textit{transport}}+\underbrace{\frac{\partial \overline{u_{i}''\tau_{ij}'}}{\partial x_j}}_{\textit{Viscous}\ \textit{transport}} \nonumber\\ &\quad +\underbrace{\overline{p' \frac{\partial u_{i}''}{\partial x_i}}}_{\textit{Pressure}\ \textit{dilatation}} -\underbrace{\overline{u_{i}''} \left(\frac{\partial \bar{p}}{\partial x_i}-\frac{\partial \bar{\tau}_{ij}}{\partial x_j}\right)}_{\textit{Mass-flux}\ \textit{term}}, \end{align}
where  $\tilde {k} = \frac {1}{2} \widetilde {u_{i}''u_{i}''}$ denotes the specific TKE. The main terms of (2.10) are production, dissipation and transport terms. Pressure dilatation and mass-flux terms (the later comprises the baropycnal work) are equal to zero in the incompressible case. The dissipation term can be decomposed into a solenoidal, a low Reynolds number and a dilatational component. The latter is associated with losses occurring in eddy shocklets. Lee, Lele & Moin (Reference Lee, Lele and Moin1991) expressed the dilatational dissipation also called the compressible dissipation as
 \begin{equation} \epsilon_d ={-}\frac{4}{3} \overline{\nu\left(\frac{\partial u_k''}{\partial x_k}\right)^2} - 2 \overline{u_k'' \frac{\partial \nu'}{\partial x_k} \frac{\partial u_k''}{\partial x_k}}. \end{equation}
This expression comprises the effect of viscosity variations, unlike Sarkar & Lakshmanan (Reference Sarkar and Lakshmanan1991) and Zeman (Reference Zeman1990), who expressed it as  $\epsilon _d=-\frac {4}{3} \bar {\nu }\overline {({\partial u_k''}/{\partial x_k})^2}$, neglecting viscosity variations. For decaying compressible turbulence, Lee et al. (Reference Lee, Lele and Moin1991) found that the Sarkar & Lakshmanan (Reference Sarkar and Lakshmanan1991) and Zeman (Reference Zeman1990) expression overestimates by approximately
 $15\,\%$ the compressible dissipation.
In addition to (2.5), (2.6) and (2.7), the thermal PG and the following calorific EoSs are used for air:
 \begin{equation} \left\{\begin{array}{@{}l} p=\rho R T ,\\ e=e_{\textit{ref}}+\displaystyle\int^T_{T_{\textit{ref}}} c_v(T') \,\textrm{d}T', \end{array}\right. \end{equation}
where  $R$ is the specific gas constant,
 $c_v$ the specific heat capacity,
 $p$ the pressure,
 $T$ the temperature,
 $\rho$ the density.
For FC-70, the Martin–Hou EoS (referred to as MH) will be retained to provide an accurate representation of BZT DG thermodynamic behaviour (Guardone, Vigevano & Argrow Reference Guardone, Vigevano and Argrow2004)
 \begin{equation} \left\{\begin{array}{@{}l} p = \displaystyle\dfrac{RT}{v-b}+\sum_{i=2}^{5} \dfrac{A_i+B_iT+C_i\ \textrm{e}^{{-}kT/T_c}}{(v-b)^i}, \\ e = e_{\textit{ref}} + \displaystyle\int_{T_{\textit{ref}}}^{T} c_v(T') \,\textrm{d}T' + \sum_{i=2}^{5} \dfrac{A_i+C_i (1+kT/T_c) \ \textrm{e}^{{-}kT/T_c}}{(i-1)(v-b)^{i-1}}, \end{array}\right. \end{equation}
where  $(\cdot )_{\textit {ref}}$ denotes a reference state,
 $b=v_c(1-(-31\,883Z_c+20.533)/15)$,
 $k=5.475$ and the coefficients
 $A_i$,
 $B_i$ and
 $C_i$ are numerical constants determined by Martin & Hou (Reference Martin and Hou1955) and Martin, Kapoor & De Nevers (Reference Martin, Kapoor and De Nevers1959) from physical parameters summarised in table 1.
To complete the thermodynamic description of the BZT DG, Chung's model is used to compute dynamic viscosity and thermal conductivity (Chung et al. Reference Chung, Ajlan, Lee and Starling1988). FC-70 is assumed to behave as a non-polar gas, its dipole moment is therefore neglected (Shuely Reference Shuely1996). For PG transport coefficients, Sutherland's model is used associated with a constant Prandtl number set equal to  $0.71$. Values of the initial Prandtl number are given in Appendix C for DG flows. The selected constants for Sutherland's law are the ones given by White (Reference White1998).
2.3. Numerical set-up
DNS are performed using the explicit and unstructured numerical solver AVBP. It solves the three-dimensional unsteady compressible Navier–Stokes equations coupled with the PG EoS (2.12) for air and the MH EoS for FC-70 (2.13) using a two-step time-explicit Taylor Galerkin scheme for the hyperbolic terms based on a cell vertex formulation (Colin & Rudgyard Reference Colin and Rudgyard2000). The scheme provides high spectral resolution and low numerical dissipation ensuring a third-order accuracy in space and in time. AVBP is designed for massively parallel computation and can be used to perform LES as well as DNS simulations (Desoutter et al. Reference Desoutter, Habchi, Cuenot and Poinsot2009; Cadieux et al. Reference Cadieux, Domaradzki, Sayadi, Bose and Duchaine2012). The scheme is completed with a shock capturing method. In regions where strong gradients exist, an additional dissipation term is added following the approach of Cook & Cabot (Reference Cook and Cabot2004). Its impact on the resolution of the smallest scales has been analysed in a previous article (Giauque et al. Reference Giauque, Corre and Vadrot2020).
3. DNS of PG mixing layer: verification and validation
This section is devoted to the selection of self-similar periods and the assessment of the quality of PG DNS performed for air at three different convective Mach numbers ( $M_c=0.1/1.1/2.2$).
3.1. Temporal evolution and self-similarity
Figure 3 shows the temporal evolution of the momentum thickness normalised by its initial value. This key quantity characterises the development of mixing layers. Time is non-dimensional ( $\tau =t\Delta u/\delta _{\theta ,0}$). The evolution is plotted for three different convective Mach numbers (
 $M_c=0.1/1.1/2.2$). Results at
 $M_c=1.1$ are extracted from Vadrot, Aurélien & Alexis (Reference Vadrot, Giauque and Corre2020). The same Reynolds number (
 $Re_{\delta _{\theta ,0}}=160$) based on the initial momentum thickness is used for the three different DNS. Simulation parameters are given in table 2. At
 $M_c=2.2$, the size of initial turbulent structures has been enlarged in order to speed up the development of the mixing layer.
Temporal evolution of the mixing layer momentum thickness for  $M_c=0.1/1.1/2.2$ using air with PG EoS. Slopes are non-dimensional and standard deviations computed over the self-similar period are indicated on the plot.

One can identify three main phases: an initial delay caused by a transition of modes from the modes in which TKE is initially injected to the most unstable ones; an unstable over-linear growth; and the self-similar period, during which the mixing layer evolves linearly with time. The procedure used to select the self-similar period is detailed in subsequent paragraphs.
At  $M_c=2.2$, one can notice that the mixing layer takes a much longer time to develop. This is consistent with observations of Pantano & Sarkar (Reference Pantano and Sarkar2002) who noticed that the time necessarily to reach self-similar regime increases with compressibility. Self-similarity is reached around
 $\tau \approx 11\,500$ after a long unstable growth phase. As a comparison, at
 $M_c=0.1$ and
 $M_c=1.1$, self-similarity is reached respectively at
 $\tau =700$ and
 $\tau =1700$. Moreover, the self-similar period is also stretched as the convective Mach number increases.
A long time delay is observed at the beginning of the simulation. That delay is associated with the transition of modes. TKE is initially injected at a given integral length set equal to  $L_x/8$. Afterwards, energy is distributed over the whole spectrum and some unstable modes are amplified, leading to the unstable growth phase. In order to reduce this time delay, initial turbulent structures have been chosen to be larger in proportion to the initial momentum thickness at
 $M_c = 2.2$ when compared to other convective Mach numbers (table 2). This modification of initial turbulent structures size does not impact the growth rate over the self-similar regime. This has been carefully verified for DG flows in Appendix A.
In addition, domain lengths are doubled in the  $x$ and
 $z$ directions and multiplied by four in the
 $y$ direction when compared with DNS at
 $M_c=1.1$, relative to initial momentum thicknesses. This enables the mixing layer to develop until larger values of
 $\delta _{\theta }(t)/\delta _{\theta ,0}$ and to obtain a long enough self-similar period without reaching the domain boundaries. Other simulations performed with smaller domains did not allow the flow to reach self-similarity.
Slopes and standard deviations mentioned in figure 3 are computed over the self-similar period. One can observe that the growth rate is divided by a factor of approximately two between DNS at  $M_c=2.2$ and at
 $M_c=1.1$. Indeed, compressibility effects tend to reduce mixing layer development as the convective Mach number increases.
DNS performed at  $M_c=0.1$ constitutes our reference incompressible case used to plot
 $\dot {\delta }_\theta /\dot {\delta }_{\theta ,inc}=f(M_c)$. The computed growth rate is approximately
 $0.0131$ which is relatively close to the empirical value of
 $0.016$ given by Pantano & Sarkar (Reference Pantano and Sarkar2002). One can notice a very short unstable growth phase when compared with larger convective Mach number cases.
Self-similarity is a major characteristic of mixing layers: during the self-similar period, flow development can be described using single length and velocity scales. The momentum thickness linearly evolves with time. This particular state in the development of mixing layers is widely used to extract key features of mixing layers. The well-known chart giving the evolution of the mixing layer growth rate as a function of the convective Mach number (Papamoschou & Roshko Reference Papamoschou and Roshko1988) is plotted during the self-similar regime. This period is also used to investigate the balance of the TKE equation, because temporal solutions can be averaged during self-similarity since the flow is in a statistically stable state.
The selection of the self-similar period is thus a key point in the study of turbulent mixing layers, but this choice is difficult, especially at high compressible regimes which require lengthy simulations. One can note that, in our case, the time required to achieve self-similarity is multiplied by a factor of approximately five when the convective Mach number increases from  $M_c=1.1$ to
 $M_c=2.2$.
Lots of authors evoke difficulties in reaching self-similarity (Pantano & Sarkar Reference Pantano and Sarkar2002; Pirozzoli et al. Reference Pirozzoli, Bernardini, Marié and Grasso2015) particularly because of computational domain lengths. Moreover, criteria to define self-similarity are not standardised. Superposition of the mean velocity profiles, linear evolution of the momentum thickness, collapse of the Reynolds stress profiles are three different ways to define the self-similar period.
The same methodology used in Vadrot, Aurélien & Alexis (Reference Vadrot, Giauque and Corre2020) is applied here to select the self-similar period: it relies on the stabilisation of the streamwise production term integrated over the whole domain. The underlying reason for using this criterion comes from Vreman et al. (Reference Vreman, Sandham and Luo1996), who demonstrated the following relation between the mixing layer growth rate and the production power ( $\bar {\rho } P_{xx} = - \overline {\rho u_x''u_y''}({\partial \tilde {u}_x}/{\partial y})$):
 \begin{equation} \delta_{\theta}'=\frac{\textrm{d}\delta_\theta}{\textrm{d}t}=\frac{2}{\rho_0 (\Delta u)^2} \int \bar{\rho} P_{xx} \,{\textrm{d} y}. \end{equation}
Figure 4 shows the temporal evolution of the non-dimensional streamwise production integrated over the whole domain for the three DNS at  $M_c$ ranging from
 $0.1$ to
 $2.2$ performed for air using the PG EoS. A constant integrated production is directly related to a self-similar regime according to (3.1). Selected self-similar periods are indicated on each plot. As the convective Mach number increases, the maximum peak of integrated turbulent production decreases, which is consistent with the decrease of the momentum thickness growth rate. Time required to achieve self-similarity lengthens but self-similar periods last longer.
Temporal evolution of the non-dimensional streamwise turbulent production term integrated over the whole domain  $P_{int}^*= (1/(\rho _0(\Delta u)^3 )) \int _{L_y} \bar {\rho } P_{xx} \,{\textrm {d} y}$ (with
 $\bar {\rho } P_{xx}(y) = - \overline {\rho u_x''u_y''}({\partial \tilde {u}_x}/{\partial y})$) at
 $M_c=0.1$ (a),
 $M_c=1.1$ (b) and
 $M_c=2.2$ (c). Results are shown for the air using PG EoS. Selections of self-similar period are indicated on each plot.

Difficulties can be encountered in obtaining a fully stable plateau with an almost constant integrated turbulent production. Domain lengths have a major influence on self-similarity. The evolution of the turbulent production follows a piecewise decrease, reaching several plateaus. It is observed that these piecewise plateaus are directly related to integral lengths scales. When some turbulent structures grow and become too large for the computational domain, the integrated turbulent production decreases and reaches another plateau lower than the previous one. The mixing layer therefore adapts its growth to domain lengths when the computational box is not large enough. Since the integrated turbulent production is related to the mixing layer growth rate, a lower plateau leads to a smaller mixing layer growth rate. Great care therefore needs to be taken when selecting the size of the computational domain, and a good stabilization of the integrated turbulent production must be reached in order to precisely select the self-similar period. Influence of the domain size on self-similarity is thoroughly investigated in Appendix A for DG flows and correlations with integral length scales are analysed.
3.2. Validation over the self-similar period
Since self-similar periods are now well defined for each DNS, it is possible to plot the evolution of the mixing layer growth rate with respect to the convective Mach number. Figure 5 shows a comparison between current PG results and available numerical (Freund, Lele & Moin Reference Freund, Lele and Moin2000; Kourta & Sauvage Reference Kourta and Sauvage2002; Pantano & Sarkar Reference Pantano and Sarkar2002; Fu & Li Reference Fu and Li2006; Zhou, He & Shen Reference Zhou, He and Shen2012; Martínez Ferrer, Lehnasch & Mura Reference Martínez Ferrer, Lehnasch and Mura2017; Matsuno & Lele Reference Matsuno and Lele2020) and experimental results (Rossmann et al. Reference Rossmann, Mungal and Hanson2001) from the literature. Current DNS follow the tendency observed and described in the literature: the well-known compressibility-related reduction of the momentum thickness growth rate as  $M_c$ increases. From the incompressible case to
 $M_c=2.2$, the mixing layer growth rate is divided by a factor of approximately five. Standard deviations have also been computed and are reported on the plot. It represents approximately 5 % of the computed growth rates. It is rather difficult to reduce this uncertainty because of difficulties encountered in reaching perfect self-similarity. This is also illustrated by the scattering of literature results, which might be a consequence of this phenomenon. Moreover, the lack of numerical results at highly compressible regimes makes the validation process more complex.
Evolution of the mixing layer growth rate with respect to the convective Mach number for air using PG EoS. Comparison is made with available DNS results in literature and experimental results by Rossmann et al. (Reference Rossmann, Mungal and Hanson2001). Standard deviations are indicated on the plot.

Yet, numerical parameters given in table 3 confirm the validation of the current DNS. The integral lengths  $l_x$ and
 $l_z$ are computed using the streamwise velocity field:
 $$\begin{gather} l_x =\frac{1}{2\overline{{u_x'}^2}} \int_{{-}L_x/2}^{L_x/2} \overline{{u_x'}(\boldsymbol{x}){u_x'}(\boldsymbol{x}+r\boldsymbol{e}_{\boldsymbol{x}})}\,\textrm{d}r, \end{gather}$$
 $$\begin{gather}l_z =\frac{1}{2\overline{{u_x'}^2}} \int_{{-}L_z/2}^{L_z/2} \overline{{u_x'}(\boldsymbol{x}){u_x'}(\boldsymbol{x}+r\boldsymbol{e}_{\boldsymbol{z}})}\,\textrm{d}r. \end{gather}$$
Non-dimensional parameters computed at the beginning and at the end of the self-similar period for  $M_c=2.2$ simulations;
 $Re_{\lambda _x}$ denotes the Reynolds number based on the longitudinal Taylor microscale
 $\lambda _x=\sqrt {2\overline {{u'}^{2}_{x}}/\overline {(\partial {u_x'}/\partial x)^2}}$ computed at the centreline;
 $L_\eta$ denotes the Kolmogorov length scale computed at the centreline.

Integral length scales show that the domain is chosen sufficiently large. The largest value  $0.20$ is obtained at the end of the self-similar period for DG flow at
 $M_c=1.1$. Otherwise, values do not exceed
 $0.16$ in the streamwise direction and
 $0.13$ in the
 $z$ direction. As a comparison, the Pantano & Sarkar (Reference Pantano and Sarkar2002) integral length scale reaches
 $0.178$ in the streamwise direction for a configuration with
 $M_c=0.7$ and a density ratio of
 $4$. Appendix A also confirms that domain lengths have been properly chosen for DG mixing layer at
 $M_c=2.2$.
The ratio  $r=L_\eta /\Delta x$ characterises the resolution of simulations. The larger the ratio, the better the resolution. Minimum value is approximately
 $0.52$ computed for DNS at
 $M_c=2.2$. For other simulations, values are larger than
 $0.6$ and the maximum value is
 $1.64$ for PG at
 $M_c=2.2$ because of small dissipation in high compressible regimes. As a comparison, the Pantano & Sarkar (Reference Pantano and Sarkar2002) ratio is approximately
 $0.38$ for the most resolved simulation and recently Matsuno & Lele (Reference Matsuno and Lele2020) performed a DNS at
 $M_c=2.0$ with a
 $L_\eta /{\textrm {d} x}$ ratio equal to
 $0.41$. One can thus consider that turbulent scales are adequately resolved for all simulations presented in this paper since in addition the TKE is very low close to the Kolmogorov scale (Moin & Mahesh Reference Moin and Mahesh1998).
4. DG effect on mixing layer growth
4.1. Temporal evolution
As previously done for the PG mixing layer, it is required to precisely define the self-similar range for the DG flow. This is done through both figures 6 and 7. Figure 6 enables the comparison of normalised DG momentum thickness over time at three different convective Mach numbers:  $M_c=0.1-1.1-2.2$. The three DNS are performed at the same initial Reynolds number
 $Re_{\delta _{\theta ,0}}=160$. Additional simulation parameters are given in table 2. At
 $M_c=0.1$, similarly to the PG mixing layer, the domain length is doubled in the
 $y$ direction to get a long enough self-similar period. At
 $M_c=2.2$, the domain length is divided by two in the
 $y$ direction when compared with PG flow. The domain is therefore large enough to reach a self-similar period which lasts
 $4000\tau$. Initial turbulent structures are to be chosen six times larger at
 $M_c=2.2$ when compared with other
 $M_c$ to be consistent with the PG simulation. It is nevertheless shown in Appendix A that the size of initial turbulent structures does not influence the growth rate during self-similarity. This choice was motivated by the will to shorten the simulation. Enlarging the size of initial turbulent structures accelerates the unstable growth phase. As a consequence, in figure 6,
 $M_c=1.1$ and
 $M_c=2.2$ curves overlap after
 $\tau \approx 2500$.
Temporal evolution of the mixing layer momentum thickness for DGs at  $M_c=0.1,-1.1,-2.2$.

Temporal evolution of the non-dimensional streamwise turbulent production term integrated over the whole domain  $P_{int}^*= (1/(\rho _0(\Delta u)^3)) \int _{L_y} \bar {\rho } P_{xx} \,\textrm {d}V$ (with
 $\bar {\rho } P_{xx}(y) = - \overline {\rho u_x''u_y''}({\partial \tilde {u}_x}/{\partial y})$) at
 $M_c=0.1$ (a),
 $M_c=1.1$ (b) and
 $M_c=2.2$ (c). Results are shown for the FC-70. Self-similar periods are indicated on each plot.

Slopes and standard deviations computed over the self-similar range are given in figure 6. At  $M_c=0.1$, because of the suppression of compressibility effects, the growth rate is very close to that of PG flow: the difference is approximately
 $1.5\,\%$ and is below the standard deviation range. As for PG, the DNS at
 $M_c=0.1$ is considered as the reference incompressible case and is used to plot the dependence of the normalised momentum thickness growth rate with respect to
 $M_c$. At
 $M_c=1.1$, comparison between DG and PG flows is detailed in Vadrot, Aurélien & Alexis (Reference Vadrot, Giauque and Corre2020) during unstable growth and self-similar phases.
Figure 6 shows that the momentum thickness growth rates are very close between  $M_c=2.2$ and
 $M_c=1.1$ unlike the PG case. The well-known decrease of the growth rate with the convective Mach number is modified by DG effects. Despite being a highly compressible fluid, compressibility effects decrease in FC-70. Explanations for this effect are given in § 5.
Slopes provided in figure 6 are determined using the same methodology used for the PG in § 3.1. For each convective Mach number, the non-dimensional integrated turbulent production term  $P_{int}^*$ is plotted over time. The three main phases described for the PG flow can also be identified for DGs. One can notice that, at
 $M_c=2.2$, the initial phase corresponding to an energy transfer to the most unstable modes is much shorter for DG flow, likely because unstable modes are different between the two types of gas. After this phase, turbulent production reaches a maximum which decreases as
 $M_c$ increases. Finally, self-similar periods are defined selecting the range during which turbulent production is almost constant. As observed for PG flow, the self-similar period is extended as
 $M_c$ increases. One can also notice that integrated production terms in DG flows are consistent with momentum thickness growth rates: the values of
 $P_{int}^*$ are very close between
 $M_c=2.2$ and
 $M_c=1.1$ and the value of
 $P_{int}^*$ at
 $M_c=0.1$ is twice larger than the one at
 $M_c=1.1$. This observation confirms the relevance of the Vreman et al. (Reference Vreman, Sandham and Luo1996) relationship given in (3.1). Beginning and ending times for each DNS self-similar periods are provided in table 3.
4.2. Comparison with PG over the self-similar period
Self-similar periods have been selected for both types of gas. It is thus possible to plot the evolution of self-similar growth rates as a function of the convective Mach number. Slopes are usually normalised using an incompressible reference case at very low convective Mach number for which compressibility effects can be neglected. DNS at  $M_c=0.1$ is considered here as the reference incompressible case. For example, Pantano & Sarkar (Reference Pantano and Sarkar2002) use a simulation at
 $M_c=0.3$ as a reference case. There is no consensus on this choice, which can partly explain the spread of PG results observed in figure 8 – where the same literature results used in figure 5 are reported. DG mixing layer results are plotted with error bars coloured in black. They represent the standard deviation of the normalised growth rate over the self-similar range. Unlike the PG mixing layer, which shows a fairly abrupt decrease of its growth rate as
 $M_c$ increases, the DG mixing layer seems to be much less influenced by compressibility effects as
 $M_c$ becomes larger than
 $1.1$. Differences between DG and PG mixing layers are large enough when compared with standard deviations to reveal that turbulence development is actually modified by DG effects in mixing layer flows.
Evolution of the mixing layer growth rate over the convective Mach number for air and for FC-70. Comparison is made with available DNS results in the literature and the experimental results in Rossmann et al. (Reference Rossmann, Mungal and Hanson2001).

In order to analyse the impact of compressibility effects, Pantano & Sarkar (Reference Pantano and Sarkar2002) study the TKE equation and particularly the importance of the turbulent production term. They find that this term is decreasing in consistent proportion with the growth rate as the convective Mach number increases. The computation of TKE equation terms requires us to statistically average the terms. This can only be done during the self-similar period during which both mixing layers are in a statistically stable state. Figure 9 shows the comparison between DG and PG mixing layers of the normalised main terms of the TKE equation over the non-dimensional cross-stream direction  $y/\delta _\theta (t)$. Production, dissipation and transport terms are averaged during corresponding self-similar ranges. The production term (denoted P) is always positive and is responsible for the growth of the mixing layer. Viscous dissipation (denoted D) is always negative and counterbalances the production term. The transport term (denoted T) enables the propagation of TKE from the centre to the edges of the mixing layer. It is thus negative at the centre and positive close to the edges. Consistently with the comparison of slopes between DG and PG flows, all main terms and particularly the production term are two to three times larger for DGs.
Distribution of the volumetric normalised powers over the non-dimensional cross-stream direction  $y/\delta _\theta (t)$ at
 $M_c=2.2$. P: production, D: dissipation and T: transport are normalised by
 $\rho _0 (\Delta u)^3/\delta _\theta (t)$. Distributions have been averaged between the upper and the lower streams to obtain perfectly symmetrical distributions.

Another noticeable feature which was highlighted in the previous analysis at  $M_c=1.1$ (Vadrot, Aurélien & Alexis Reference Vadrot, Giauque and Corre2020) is confirmed here: curves are wider for the PG mixing layer, when compared with the DG mixing layer. For the DG mixing layer, TKE is more localised at the centre. This is directly linked to the thermodynamic profiles, which are wider for PG mixing layer (see figure 19 in § 5.3).
Other terms of the TKE equation, namely the compressible dissipation, the mass-flux coupling term, the convective derivative of the TKE and even the pressure dilatation are negligible for both types of gas. The pressure dilatation term which is directly linked to shocklet effects is carefully analysed in § 5.1 to quantify shocklet effects on the mixing layer growth.
As mentioned in the introduction, Pantano & Sarkar (Reference Pantano and Sarkar2002) demonstrate that the compressibility-related reduction of the momentum thickness growth rate is induced by the reduction of pressure-strain terms  $\varPi _{ij}$, which causes a reduction of turbulent production. In the TKE equation, which is obtained from the sum
 $R_{ii}$, the pressure-strain terms do not appear. Their sum
 $\varPi _{ii}$, which constitutes the pressure-dilatation term, appears in the TKE equation but is negligible. In order to study pressure-strain terms, one needs to plot turbulent stress tensor equations terms. Figure 10 shows the main terms of the
 $x$- and
 $y$-components of the turbulent stress tensor equations. In the streamwise direction, the pressure-strain term counterbalances the streamwise production, whereas, in the cross-stream directions, the pressure-strain term is positive and is balanced by viscous dissipation. In the cross-stream direction, the turbulent production term can be neglected unlike in the streamwise direction for which it is maximal.
Distribution of the main non-dimensional volumetric power terms of the  $x$- (top) and
 $y$- (bottom) turbulent stress tensor (
 $R_{xx}$ and
 $R_{yy}$) equations over the non-dimensional cross-stream direction
 $y/\delta _\theta (t)$;
 $P_{xx}$ and
 $P_{yy}$: streamwise and cross-stream production,
 $\varPi _{xx}$ and
 $\varPi _{yy}$: streamwise and cross-stream pressure-strain and
 $D_{xx}$ and
 $D_{yy}$: streamwise and cross-stream dissipation terms are normalised by
 $\rho _0 (\Delta u)^3/\delta _\theta (t)$. Results are computed at
 $M_c=2.2$. Distributions have been averaged between the upper and the lower streams to obtain perfectly symmetrical distributions.

One can notice that pressure-strain terms are significantly reduced for PG flows when compared with DG flows at  $M_c=2.2$: streamwise pressure-strain term is twice larger for DGs when compared with PG. This is consistent with the comparison of momentum thickness growth rates. For both types of gas, growth rates are identically linked to their pressure-strain terms. Compressibility effects impact the same terms for both DGs and PG.
It remains to verify the last step in the Pantano & Sarkar (Reference Pantano and Sarkar2002) explanation, which is that the reduction of pressure-strain terms is caused by a reduction of normalised pressure fluctuations. Figure 11 shows the cross-stream distribution of the root mean squared value of pressure normalised by the dynamical pressure  $\frac {1}{2}\rho _0 (\Delta u)^2$. Comparison is made between DG and PG flows at
 $M_c=1.1$ and
 $M_c=2.2$.
Distributions of the root mean square value of pressure averaged over the self-similar period, plotted along the  $y$ direction and compared between FC-70 and air at
 $M_c=1.1$ and
 $M_c=2.2$. Distributions have been averaged between the upper and the lower streams to obtain perfectly symmetrical distributions.

At  $M_c=1.1$, DG and PG distributions are very close as are their corresponding momentum thickness growth rates. As the convective Mach number increases, DG non-dimensional pressure fluctuations experience a
 $20\,\%$ decrease, also consistent with the observed decrease in the growth rate. This decrease is yet much smaller than that of the PG mixing layer, in which normalised pressure fluctuations are approximately divided by a factor of two. To sum up, although the same mechanism is responsible for the growth rate decrease in both types of gas (i.e. the reduction of non-dimensional pressure fluctuations), its effect is significantly different between the two types of gas. For DG flows, the well-known compressibility-related reduction of the momentum thickness growth rate is almost suppressed by DG effects at convective Mach numbers above
 $M_c=1.1$.
Figure 12 shows the comparison between PG and DG streamwise specific TKE spectra computed over the centreline. Spectra are normalised by  $(\Delta u)^2 \delta _\theta (t)$ in the same way as Pirozzoli et al. (Reference Pirozzoli, Bernardini, Marié and Grasso2015) and averaged over the self-similar period. The longitudinal Taylor microscale
 $\lambda _x$ is also indicated for each gas in figure 12. Its value is much larger for DG flow consistently with Reynolds numbers computed from Taylor microscales given in table 3. The inertial phase is thus significantly reduced for the PG flow. Dissipation occurs at much larger scales, making the comparison between the two inertial phase slopes difficult. Spectra confirm previous results observed at
 $M_c=1.1$ (Vadrot, Aurélien & Alexis Reference Vadrot, Giauque and Corre2020): DG effects tend to increase small-scale energy. The dissipation term, which is the main term at these scales, is significantly reduced. These results suggest a need for a specific sub-grid-scale model of DG flows the small-scale dynamics of which is significantly modified with respect to PG flows.
Streamwise specific TKE spectra computed at the centreline.

5. Analysis of discrepancies between DG and PG
5.1. First hypothesis: effect of shocklets
The previous analysis conducted at  $M_c=1.1$ shows that the growth rate is not influenced by the DG effect during the self-similar period (Vadrot, Aurélien & Alexis Reference Vadrot, Giauque and Corre2020). However, significant differences are observed during the unstable growth phase. At
 $M_c=1.1$, the evolution of the turbulent Mach number shows that shocklets might be detected during the unstable growth phase but not during the self-similar range, during which
 $M_t$ decreases well below the range of values for which shocklets are expected. It is known that the generation of shocklets is different between BZT DG flow and PG flow (Giauque et al. Reference Giauque, Corre and Vadrot2020), yet can shocklets alone explain discrepancies between DG and PG flows?
In the current analysis, we increase the convective Mach number in order to reach larger turbulent Mach numbers during the self-similar period and to analyse the influence of shocklets. Figure 13 shows the temporal evolution of the turbulent Mach number  $M_t$ (see (1.4)). Turbulent Mach numbers increase during the initial phase up to
 $1.1$ and
 $0.9$ respectively for DG and PG flows. Then
 $M_t$ decreases and reaches a rather stable plateau corresponding to the self-similar period. During this phase, average values of turbulent Mach numbers are respectively equal to
 $0.67$ and
 $0.49$ for DG and PG flows. Shocklets can thus be observed during both DG and PG self-similar periods.
Temporal evolution of the turbulent Mach number  $M_t$.

In order to study their effect on the growth rate, one can analyse the compressible component of the dissipation given in (2.11). Zeman (Reference Zeman1990) and Sarkar et al. (Reference Sarkar, Erlebacher, Hussaini and Kreiss1991) show that the dilatational part of the dissipation increases with the turbulent Mach number because of the occurrence of eddy shocklets in the compressible regime. Wang et al. (Reference Wang, Wan, Chen, Xie, Zheng, Wang and Chen2020) perform compressible isotropic turbulence simulations and observe that shocklets act as kinetic energy sinks which absorb large-scale kinetic energy. Shocklets are thus an additional source of dissipation. The dilatational dissipation is computed over the self-similar period. Figure 14 shows the ratio between the compressible and the total dissipation rate over the cross-stream direction. Around  $y/\delta _\theta (t)\approx 3.5$, one can note an increase of the ratio. It corresponds to the borders of the mixing layer, outside of which the dissipation
 $\epsilon$ drops to zero (see figure 9). Except for these regions, at
 $M_c=1.1$, the compressible dissipation represents less than
 $0.5$ % of the total dissipation for both DG and PG flows. At
 $M_c=2.2$, the ratio increases consistently with the increase of turbulent Mach numbers. The ratio is thus larger for DG flow compared with PG flow. However, the rate of dilatational dissipation with respect to the total dissipation remains below
 $4$ % for DG and below
 $1$ % for PG. Compressible dissipation can therefore be neglected with respect to the total dissipation. Shocklets have a limited influence on the TKE equation. Since the TKE equation governs the mixing layer dynamics, one cannot explain discrepancies observed between DG and PG flows with shocklets effect.
Distributions of the ratio between the compressible dissipation ( $\epsilon _d$) and the total dissipation (
 $\epsilon$) (see details in (2.10) and (2.11)). Results are averaged over the self-similar period. Comparison is made between FC-70 and air at
 $M_c=1.1$ and
 $M_c=2.2$. Distributions have been averaged between the upper and the lower streams to obtain perfectly symmetrical distributions.

5.2. Additional simulations varying the initial thermodynamic operating point
In order to explain discrepancies observed between DG and PG flows, we perform additional DNS varying the initial thermodynamic operating point. Figure 15 shows the four selected operating points. DGA corresponds to the reference simulation analysed in § 4. DGA's initial operating point is located inside the inversion zone also called BZT region. The operating point of the second simulation DGB is chosen outside the inversion region and inside the DG zone. This enables us to investigate the impact of BZT effects on the mixing layer growth. Finally, for DGC and DGD, initial operating points are chosen on the same adiabatic curves as, respectively, DGB and DGA but outside the DG zone. The diversity of targeted thermodynamic regions aims at providing a proper insight into the effects of DG on the shear layer growth.
Four different initial thermodynamic states used to perform additional DNS are represented in the non-dimensional  $p$–
 $v$ diagram for BZT DG FC-70 at
 $M_c=2.2$. The DG zone (
 $\varGamma <1$) and the inversion zone (
 $\varGamma <0$) are plotted for the MH EoS;
 $p_c$ and
 $v_c$ are, respectively, the critical pressure and the critical specific volume.

At first, one needs to validate the DNS named DGB, DGC and DGD. Table 4 gives simulations parameters including  $r$,
 $l_x$ and
 $l_z$ for the four different simulations. Achieved values are very close to DGA and since DGA has been validated previously (see § 4 and Appendix A), one can consider that DGB, DGC and DGD are adequately resolved. The sizes of computational domains have been enlarged for DGC and DGD in the
 $y$ direction in order to provide the mixing layer with more space in order to reach self-similarity.
Simulation parameters for additional FC-70 simulations at  $M_c=2.2$ varying the initial operating point;
 $r$,
 $l_x/L_x$ and
 $l_z/L_z$ are given at beginning and ending times of self-similar periods.

Self-similar periods are defined for each DNS using the same methodology previously presented in § 3.1. Plateaus showing constant integrated turbulent production correspond to self-similar periods. They are identified with vertical lines in figure 16. In addition, beginning and ending times are given in the caption for each case. Although all the DNS are performed at the same convective Mach number  $M_c=2.2$, results are quite different. The initial evolution is similar, but after
 $\tau \approx 1100$, discrepancies appear, especially for DGD. Maximum values and self-similar regimes are influenced by the initial thermodynamic operating point.
Temporal evolution of the non-dimensional streamwise turbulent production terms integrated over the whole domain  $P_{int}^*= (1/(\rho _0(\Delta u)^3)) \int _{L_y} \bar {\rho } P_{xx} \,\textrm {d}V$ (with
 $\bar {\rho } P_{xx}(y) = - \overline {\rho u_x''u_y''}({\partial \tilde {u}_x}/{\partial y})$) at
 $M_c=2.2$. Results are shown for the FC-70 for four different DNS: DGA, DGB, DGC and DGD. Self-similar periods are indicated on each plot: DGA (
 $\tau \in [4000/6000]$); DGB (
 $\tau \in [4000/6400]$); DGC (
 $\tau \in [3800/6000]$) and DGD (
 $\tau \in [3800/6000]$).

The comparison of mixing layer momentum thickness evolutions is given in figure 17. Slopes with standard deviations computed during self-similar regimes are indicated on the plot. From these results, one can deduce that BZT region does not have a major influence on the mixing layer growth. DGC's growth rate is indeed very close to DGA's, although initial thermodynamic operating points are located respectively outside and inside DG and BZT regions. The relation between the mixing layer growth and the initial thermodynamic operating point is not obvious: operating points located on the same adiabatic curve (respectively DGA, DGD and DGB, DGC) are far away in terms of growth rate. Looking at the growth rate, simulations can be classified by pairs: DGA goes with DGC and DGB goes with DGD. One can observe that slopes are all below the  $M_c=1.1$ growth rate. It means that the well-known compressibility-related reduction of the momentum thickness growth rate is still verified. Yet there is an additional effect due to the initial thermodynamic operating point.
Temporal evolution of the mixing layer momentum thickness for DG at  $M_c=2.2$. Results are shown for the FC-70 for four different DNS: DGA, DGB, DGC and DGD.

At the end of § 4, the physical explanation provided by Pantano & Sarkar (Reference Pantano and Sarkar2002) was assessed on DGA: the reduction of the momentum thickness is due to a reduction of normalised pressure fluctuations. It remains to check whether this reduction of normalised pressure fluctuations is also observed for DGB, DGC and DGD. Figure 18 shows the normalised growth rate as a function of the normalised pressure fluctuations computed at the centre of the mixing layer. For PG flow, the reduction is significant. Between  $M_c=1.1$ and
 $M_c=2.2$, growth rate and normalised pressure fluctuations are divided by a factor of two. For DG, the decrease of the normalised growth rate is also correlated with a decrease of pressure fluctuations. Among cases at
 $M_c=2.2$, the ranking purely based on the level of pressure fluctuations is not entirely satisfactory, but this could be explained by standard deviations caused by variations of the plateaus of integrated turbulent production. Moreover, other effects must also be taken into account for DG: this is the topic of the next section.
Evolution of the non-dimensional mixing layer growth rate over the centre root mean squared value of pressure normalised by  $\frac {1}{2}\rho _0 (\Delta u)^2$. Results are given for DG and PG at
 $M_c=1.1$ and
 $M_c=2.2$.

5.3. Analysis of discrepancies between DG and PG flows
There is a significant effect of DG on the well-known compressibility-related reduction of the momentum thickness growth rate. DG effects modify the decrease at convective Mach numbers larger than  $M_c=1.1$. Between
 $M_c=1.1$ and
 $M_c=2.2$, the growth rate slope does not vary much for DG. Several factors can be identified, which contribute to explain the observed discrepancies between DG and PG mixing layers. The first main difference between DG and PG flows is the ratio between the enthalpy and the kinetic energy. It is associated with the Eckert number, which is defined for the mixing layer as
 \begin{equation} Ec=\frac{(\Delta u)^2}{c_{p_0} T_0}, \end{equation}
where  $c_{p_0}$ denotes the initial specific heat capacity at constant pressure and
 $T_0$, the initial temperature. Initial Eckert numbers are computed for each DNS and results are gathered in table 5. For DG flows, values are approximately two orders of magnitude lower than PG flows. Two features of DG mixing layers are responsible for these significant differences: the large heat capacity of FC-70 and the small differential speed
 $\Delta u$. The differential speed is defined in order to obtain the same initial convective Mach number between DG and PG mixing layers. Since the sound speed is much lower in DG, a much lower differential speed is obtained for a given value of the convective Mach number, which mechanically reduces the Eckert number. With small Eckert numbers, kinetic energy becomes negligible when compared with the enthalpy or to the internal energy. (At the initial conditions
 $\gamma$ is approximately
 $1.3$ and internal energy and enthalpy are of the same order of magnitude.) It is the case for all DG flows in this study even though the convective Mach number is large. As shown by the present results, kinetic energy also decouples from thermodynamics compressibility effects and the growth rate of the momentum thickness is allowed to reach larger values. It can be observed that the close values of the momentum thickness growth rates for DGA/DGC on one hand and DGB/DGD, on the other hand, are well correlated with the values of the initial Eckert number reported in table 5. The lower Eckert numbers for DGA/DGC correspond to higher growth rates for these shear layer configurations, induced by an even stronger decoupling between internal and kinetic energy for DGA/DGC with respect to DGB/DGD. However, the Eckert number cannot be the only factor explaining DG effect on the growth rate since DGC displays a slightly lower growth rate with respect to DGA, with a slightly lower value of the initial Eckert number.
Eckert numbers and normalised momentum thickness growth rates are given for each simulation.

For DG flows, the amount of internal energy is much larger when compared with kinetic energy. Internal and kinetic energies are decoupled in that case. In the equation of energy conservation (2.7), all the terms can be neglected with respect to the temporal and convective internal energy terms. Since the Eckert number quantifies the friction heating, it is significantly reduced in DG flows as previously shown by Gloerfelt et al. (Reference Gloerfelt, Robinet, Sciacovelli, Cinnella and Grasso2020). Figure 19 shows the distribution of the Reynolds-averaged temperature, density and the root mean square value of density fluctuations over the cross-stream direction of the shear layer. Results are averaged over the self-similar period. It can be observed in figure 19 that temperature variations are almost suppressed for DG. Sciacovelli et al. (Reference Sciacovelli, Cinnella and Gloerfelt2017a) confirm this remark in supersonic turbulent channel flows and state that DG flow are less subject to friction losses associated with Mach number effects. For the mixing layer, above  $M_c=1.1$, compressibility effects associated with the increase of convective Mach number have less influence on DG flows in part because of the reduction of friction heating.
The non-dimensional Reynolds-averaged temperature (a) and density (b); and root mean squared value of the density (c) are averaged over the self-similar regime and plotted along the  $y$ direction. Comparison is made between FC-70 and air at
 $M_c=1.1$ and
 $M_c=2.2$.

The evolution of the average density confirms this reduction. The PG air density suffers a 40 % decrease at the centre between  $M_c=1.1$ and
 $M_c=2.2$. In the PG, friction heating is important and leads to an increase of the temperature, which induces a decrease of the density. The mechanism is significantly reduced in DG flows. For DG, the temperature is almost constant and averaged density displays very limited variations. At
 $M_c=2.2$, the averaged density decrease at the centre of the mixing layer represents approximately 8 % of the initial density compared with 45 % for air. Equation (3.1) shows that this effect influences the mixing layer growth rate, which depends on the density. As the mixing layer develops in PG, strong friction occurs at the centre, which decreases the density. The momentum thickness growth rate is thus significantly reduced for PG when compared with DG.
Figure 19(c) displays the root mean square value of density fluctuations. Between PG and DG flows, the distribution across the mixing layer changes shape. For PG, it consists of two symmetric peaks with respect to the centre of the mixing layer. Peaks are located at the borders of the mixing layer, where the cross-stream gradient of averaged density is maximal. In this region, the mixing layer flow experiences strong dynamic and thermal variations with an important coupling between internal and kinetic energy. For DG, the distribution is composed of a single peak located at the centre of the mixing layer. The distribution is much less affected by the variation of the averaged density. For DG, thermal quantities are less influenced by the flow dynamics because of the decoupling of internal energy and kinetic energy. The root mean square value of density fluctuations diffuses from the centre of the mixing layer.
The amplitudes of the distributions are also quite different between DG and PG flows. For DG, the maximum root mean square value of density fluctuations is multiplied by a factor of three from  $M_c=1.1$ to
 $M_c=2.2$. In the PG case, it is multiplied by a factor of approximately two. Compressible flows are more subject to root mean square density fluctuations, which increase as the Mach number grows. An explanation can be found in the definition of the isentropic compressibility coefficient, which is large for DG flows
 \begin{equation} \chi_s = \left.\frac{1}{\rho} \frac{\partial \rho}{\partial p} \right|_s. \end{equation}
For flows with large values of  $\chi _s$, small variations of pressure lead to large variations of density. The sound speed is directly linked to the isothermal compressibility since
 \begin{equation} c=\frac{1}{\sqrt{\rho \chi_s}}. \end{equation}
For DG flows, the large isentropic compressibility factor strongly diminishes the sound speed. As a result, the initial sound speed in the computed DG flows is approximately six times smaller when compared with its initial value for the PG shear layers. Figure 20 shows the normalised momentum growth rate at  $M_c =2.2$ as a function of the normalised sound speed. A rather clear correlation appears between the momentum thickness growth rate and the initial sound speed: the growth rate decreases with increasing sound speed.
Evolution of the non-dimensional mixing layer growth rate as a function of the sound speed normalised with  $\sqrt {p_c/\rho _c}$. Results are given for DG and PG at
 $M_c=2.2$.

The main conclusion that can be drawn from these observations is that the smaller Eckert number in DG flows causes a decoupling between internal and kinetic energy and induces less friction heating. Both phenomena influence the mean and fluctuating thermal physical quantities, which consequently limits the compressibility-related reduction of the momentum thickness growth rate.
6. Concluding remarks
The present work extends the previous analysis of a temporal compressible shear layer conducted at  $M_c=1.1$ (Vadrot, Aurélien & Alexis Reference Vadrot, Giauque and Corre2020) to a larger convective Mach number
 $M_c=2.2$ for air described as a PG and FC-70 (BZT gas) described using MH EoS. A reference incompressible DNS is also performed at
 $M_c=0.1$ to provide the incompressible growth rate
 $\dot {\delta }_{\theta ,inc}$ used to normalise the growth rate
 $\dot {\delta }_{\theta }$. The computed evolution of the mixing layer growth rate with respect to the convective Mach number is compared to available results from the literature for PG. The PG results are found to be consistent with the literature and establish the accuracy of the present simulations.
The choice of the domain size is paramount in this study. The domain is enlarged at  $M_c=2.2$ for both DG and PG DNS when compared with DNS at
 $M_c=1.1$ in order to ensure mixing layers reach self-similarity. An analysis presented in Appendix A is performed to thoroughly investigate the sensitivity of the DG mixing layer to domain extent and to the size of initial turbulent structures. Results establish the relevance of the choices of domain extent and initial structures size made in the present study.
The selection of the self-similar period is a key point in the study of mixing layers: this choice is complex and the diversity of criteria used for the selection process contributes to the scatter of the  $\dot {\delta _\theta }/\dot {\delta }_{\theta ,inc}=f(M_c)$ plots reported in the literature. In the present work, self-similar periods are selected using the integrated streamwise production over time, which is proportional to the momentum thickness growth rate under certain conditions (Vreman et al. Reference Vreman, Sandham and Luo1996).
The comparison between PG and DG shows major differences for the momentum thickness growth rates at  $M_c=2.2$. The DG flow limits the well-known compressibility-related reduction of the momentum thickness growth rate. At
 $M_c=2.2$, the growth rate is twice as large for DG when compared with PG. Pantano & Sarkar (Reference Pantano and Sarkar2002) demonstrate that, for PG flows, the growth rate reduction is due to the reduction of pressure fluctuations leading to the reduction of pressure-strain terms. We show that growth rate is also correlated with pressure fluctuations in DG flows. Yet, the small-scale dynamics is very different. A much larger dissipation is also observed for PG mixing layer. These results call for a specific sub-grid scale model for DG flows when simulated using LES.
Additional DG DNS have been performed at three other initial thermodynamic operating points. Results show that BZT effects have only a small impact on the mixing layer growth. Shocklets indeed produce only a limited effect on mixing layer growth. The compressible dissipation is negligible when compared with the total dissipation. For DG mixing layers, several physical factors tend to reduce compressibility effects: the decoupling of kinetic and internal energy reduces the effect of increasing  $M_c$; reduced friction losses in DG flows modify the distribution of the averaged density, which therefore favours the momentum thickness growth rate. Finally, it is found that increasing the initial isothermal compressibility also increases the momentum thickness growth rate in DG flows. Initial sound speed could therefore be an appropriate indicator when forecasting the mixing layer growth rate in real-gas flows. Note that the PG results are restricted to air, with heat capacity ratio equal to
 $\gamma =1.4$. Further exploration could investigate the effect of
 $\gamma$ close to unity over the PG results and provide a comparison with the DG results in order to separate possible
 $\gamma$-effects from DG effects.
Funding
This work is supported by the JCJC ANR EDGES project, grant #ANR-17-CE06-0014-01 of the French Agence Nationale de la Recherche. Simulation have been carried out using HPC resources at CINES under the project grant #A0062A07564.
Declaration of interests
The authors report no conflict of interest.
Appendix A. DG mixing layer: influence of domain size, resolution and initial turbulent structures size
Additional simulations have been performed for DG mixing layer with  $Re_{\delta _{\theta ,0}}=160$ and
 $M_c=2.2$ in order to confirm proper resolution and domain size. The computational parameters corresponding to these simulations are summarised in table 6 along with the parameters used in the previous study at
 $M_c=1.1$.
Simulation parameters for temporal shear layer DNS ( $Re_{\delta _{\theta ,0}}=160$) with varying domain extent, resolution and size of initial structures;
 $L_x$,
 $L_y$ and
 $L_z$ denote computational domain lengths measured in terms of initial momentum thickness;
 $N_x$,
 $N_y$ and
 $N_z$ denote the corresponding numbers of grid points;
 $L_0$ denotes the size of initial turbulent structures (
 $k_0=2{\rm \pi} /L_0$) measured in terms of initial momentum thickness. All grids are uniform.

Figure 21 shows temporal evolutions of momentum thickness for the simulations listed in table 6. DG1 is performed with the same domain lengths and size of initial turbulent structures (relative to the initial momentum thickness) as in the previous  $M_c=1.1$ study DG0. At
 $\tau =4000$, self-similarity is not yet achieved but flow field visualisations indicate that the
 $y$ boundaries of the domain are reached. DG2 is then conducted with a domain size doubled in the
 $y$ direction and with smaller initial turbulent structures corresponding to
 $L_x/4=86\delta _{\theta ,0}$, in order to speed up the mixing layer development. Simulations show that the modification of initial structures size only modifies the time necessary to reach the unstable growth phase but not the growth rate itself.
Temporal evolution of the mixing layer momentum thickness.

Yet, a large decrease of the growth rate is observed for DG2 around  $\tau =4000$; self-similarity cannot be reached. Figure 22 displays the time evolution of the integral length scale in the
 $z$ direction
 $l_z$ for DG2 and DG3 simulations. Around
 $\tau =4000$, the integral length scale
 $l_z/L_z$ suddenly decreases for DG2 after having reached a value of 0.2. The domain is thus not large enough to account for spanwise turbulent structures, which causes a growth rate decrease and prevents the transition to self-similarity.
Temporal evolution of the integral length scale  $l_z$.

Because of the aforementioned observations, domain sizes have been doubled in the  $x$ and
 $z$ directions when compared with DG1. This corresponds to the DG3 simulation, which is the reference DNS used in § 4 to compare results between DG and PG. For DG3, the momentum thickness evolution reaches a perfectly linear stage and self-similarity is well achieved as confirmed by figures 7(b) and 21.
Appendix B. Analysis of spatial correlations
This section is devoted to the analysis of two-point spatial correlations of the velocity components. Both the PG and DG flows are analysed and compared. In the streamwise direction, this correlation factor writes
 \begin{equation} R_{ii}(r_x) =\frac{\overline{{u_i}'(\boldsymbol{x}){u_i}'(\boldsymbol{x}+r_x\boldsymbol{e}_{\boldsymbol{x}})}}{\overline{{u_i}'(\boldsymbol{x}) {u_i}'(\boldsymbol{x})}}, \end{equation}
where  $i$ denotes the direction of the velocity.
Figure 23 shows the evolution of the two-point correlation over the streamwise direction for the three velocity components. In the PG case, the correlation increases significantly for the  $x$- and
 $y$-velocity components as
 $M_c$ increases. As noticed in Freund et al. (Reference Freund, Lele and Moin2000) and Matsuno & Lele (Reference Matsuno and Lele2020), in highly compressible regimes, eddies are stretched in the streamwise direction. In the DG case, the correlation stays approximately the same between
 $M_c=1.1$ and
 $M_c=2.2$ for the three components, except for the
 $x$-component, which is slightly larger for
 $M_c=2.2$ when compared with
 $M_c=1.1$. Consistently with figure 8, which shows that the mixing layer growth rate is slightly affected by the convective Mach number from
 $M_c=1.1$ to
 $M_c=2.2$, the structure of eddies stays approximately the same in the streamwise direction unlike for PG flows. One can also notice that, for all cases, the correlation drops to a low value at
 $r_x/L_x=0.5$ which confirms that the streamwise domain length is sufficiently large.
The streamwise two-point correlations of the (a)  $x$-, (b)
 $y$- and (c)
 $z$- velocity components at the beginning of the self-similar period. Comparison is made between FC-70 and air at
 $M_c=1.1$ and
 $M_c=2.2$.

Figure 24 shows some snapshots of the velocity magnitude. As noticed in figure 23, the size of turbulent structures increases from  $M_c=1.1$ to
 $M_c=2.2$ in PG flow unlike in DG flow, where the size of turbulent structures remains stable between
 $M_c=1.1$ to
 $M_c=2.2$. At
 $M_c=1.1$, there is no difference between DG and PG flow field visualisation. Consistently with the evolution of the normalised momentum thickness growth rate as a function of the convective Mach number (figure 8), differences appear at
 $M_c=2.2$ in the highly compressible regime.
Snapshot of the velocity magnitude normalised with  $\Delta u$ at the beginning of the self-similar period. Comparison is made between air at (a)
 $M_c=1.1$ and (c)
 $M_c=2.2$ and FC-70 at (b)
 $M_c=1.1$ and (d)
 $M_c=2.2$.

Appendix C. Effect of the Prandtl number on the temperature fluctuation profiles
The Prandtl number is defined as the ratio between the kinematic viscosity and the thermal diffusivity ( $\alpha$)
 \begin{equation} Pr = \frac{\nu}{\alpha}. \end{equation}
A large Prandtl number indicates that the viscous diffusivity is faster than the thermal diffusivity. It would thus affect the temperature distribution. Table 7 gives the values of Prandtl numbers and mixing layer growth rates for each DNS. The growth rate of the DGC DNS is approximately the same as the one of the DGA DNS whereas the Prandtl number of the DGC DNS is twice larger than the one of the DGA DNS. Results show that there is no correlation between the Prandtl number and the mixing layer growth rate. However, the influence of the Prandtl number can be seen in figure 25. Although the rate of normalised temperature fluctuations is very low in the DG DNS (below  $6\times 10^{-3}$) compared with the PG DNS (about
 $1.7$), one can notice differences when varying the initial thermodynamic operating point. The larger the Prandtl number, the larger the temperature fluctuations.
The root mean squared value of the temperature are averaged over the self-similar regime and plotted along the  $y$ direction. Comparison is made between DG simulations at
 $M_c=2.2$.

Prandtl numbers and normalised momentum thickness growth rates are given for each DNS.



