INTRODUCTION
Over the last decades, there has been considerable interest in the role of the subtropical oceans in climate change and, in particular, oceanic subbasins and marginal seas. These bodies are often more responsive to paleoceanographic and paleoclimatic changes than global oceans because of their smaller size and partial isolation. As an example, the relatively small volume of the Mediterranean Sea causes changes in its climatic forcing to be recorded virtually instantaneously in paleoceanographic proxy data, such as stable isotope and other geochemical ratios, and in microfossil abundances. Specifically, the signals registered by changes in abundance and distribution of fossil microorganisms, such as planktonic foraminifera, provide a reliable and well-documented record at both global and local scales (Cacho et al., Reference Cacho, Grimalt, Canals, Sbaffi, Shackleton, Schönfeld and Zahn2001; Siani et al., Reference Siani, Paterne and Colin2010, Reference Siani, Magny and Paterne2013; Lirer et al., Reference Lirer, Sprovieri, Vallefuoco, Ferraro, Pelosi, Giordano and Capotondi2014; Antonarakou et al., Reference Antonarakou, Kontakiotis, Mortyn, Drinia, Sprovieri, Besiou and Tripsanas2015, Reference Antonarakou, Kontakiotis, Karageorgis, Besiou, Zarkogiannis, Drinia, Mortyn and Tripsanas2019; Bonfardeci et al., Reference Bonfardeci, Caruso, Bartolini, Bassinot and Blanc-Valleron2018). The basin's limited communication with the open ocean implies that any climatic signals will be recorded in an amplified fashion in Mediterranean properties, such as temperature, salinity, and specific elemental concentrations (Casford et al., Reference Casford, Rohling, Abu-Zied, Cooke, Fontanier, Leng and Lykousis2002; Marino et al., Reference Marino, Rohling, Sangiorgi, Hayes, Casford, Lotter, Kucera and Brinkhuis2009; Kontakiotis, Reference Kontakiotis.2016; Louvari et al., Reference Louvari, Drinia, Kontakiotis, Di Bella, Antonarakou and Anastasakis2019).
The Aegean Sea is ideal for the analysis of climate change to the proposed forcing mechanism because of its intermediate position between the higher-latitude and lower-latitude climate systems (subtropical high pressure and subpolar depression; Zervakis et al., Reference Zervakis, Georgopoulos, Karageorgis and Theocharis2004; Giorgi and Lionello, Reference Giorgi and Lionello2008; Rohling et al., Reference Rohling, Abu-Zied, Casford, Hayes, Hoogakker and Woodward2009). Its geographic and oceanographic setting contributes to the enhanced imprint and preservation of climatic perturbations associated with mid- and low-latitude climate conditions. The unusually high sedimentation rates characterizing this study area allow detailed records of changes to be preserved and facilitate the assessment of basin-integrated paleoceanographic responses.
Environmental changes of the water column have an impact on the abundance and distribution of fossil micro- and macroorganisms, such as planktonic foraminifera, pteropods, and palynomorphs. This makes them extremely valuable for both stratigraphic correlation and paleoenvironmental reconstructions (Casford et al., Reference Casford, Abu-Zied, Rohling, Cooke, Fontanier, Leng, Millard and Thomson2007; Comeau et al., Reference Comeau, Jeffree, Teyssié and Gattuso2010; Antonarakou et al., Reference Antonarakou, Kontakiotis, Mortyn, Drinia, Sprovieri, Besiou and Tripsanas2015, Reference Antonarakou, Kontakiotis, Zarkogiannis, Mortyn, Drinia, Koskeridou and Anastasakis2018; Drinia et al., Reference Drinia, Antonarakou, Tsourou, Kontakiotis, Psychogiou and Anastasakis2016; Jaouadi et al., Reference Jaouadi, Lebreton, Bout-Roumazeilles, Siani, Lakhdar, Boussoffara, Dezileau, Kallel, Mannai-Tayech and Combourieu-Nebout2016; Kontakiotis et al., Reference Kontakiotis, Karakitsios, Mortyn, Antonarakou, Drinia, Anastasakis, Agiadi, Kafousia and De Rafelis2016; Wilson et al., Reference Wilson, Monteiro, Schmidt, Ward and Ridgwell2018). These fossils have been used for the detection of long- and short-duration paleoclimatic and paleoceanographic changes in the study area (Casford et al., Reference Casford, Rohling, Abu-Zied, Fontanier, Jorissen, Leng, Schmiedl and Thomson2003; Geraga et al., Reference Geraga, Tsaila-Monopolis, Ioakim, Papatheodorou and Ferentinos2005, Reference Geraga, Ioakim, Lykousis, Tsaila Monopolis and Mylona2010; Triantaphyllou et al., Reference Triantaphyllou, Antonarakou, Kouli, Dimiza, Kontakiotis, Papanikolaou and Ziveri2009; İșler et al., Reference İșler, Aksu and Hiscott2016; Kontakiotis, Reference Kontakiotis.2016; Howes et al., Reference Howes, Eagle, Gattuso and Bijm2017; Antonarakou et al., Reference Antonarakou, Kontakiotis, Zarkogiannis, Mortyn, Drinia, Koskeridou and Anastasakis2018), especially during the last glacial cycle (including the last glacial maximum, Bølling-Allerød, Younger Dryas, and Holocene climatic optimum [HCO]). However, little attention has been paid toward the investigation of the Aegean Sea pteropod assemblages.
In the present study, high-resolution analysis on two sediment cores (AEX-15 and AEX-23) from the North Aegean Trough was conducted to advance the understanding of the spatial and temporal variability of climatic and oceanographic changes recorded in the study area and to elucidate forcing mechanisms. Paleoceanographic reconstruction and climatic oscillations in the North Aegean Sea were based on the abundances of planktonic foraminifera, pteropods, and palynomorphs, as well as variations of oxygen and carbon isotopic signal. The short-term events detected in this study were further compared with previously published circum-Mediterranean climate records (e.g., Emeis et al., Reference Emeis, Struck, Schulz, Rosenberg, Bernasconi, Erlenkeuser, Sakamoto and Martinez-Ruiz2000, Reference Emeis, Struck, Blanz, Kohly and Woß2003; Cacho et al., Reference Cacho, Grimalt, Canals, Sbaffi, Shackleton, Schönfeld and Zahn2001; Frigola et al., Reference Frigola, Moreno, Cacho, Sierro, Flores, Grimalt, Hodell and Curtis2007).
REGIONAL OCEANOGRAPHIC SETTING
The Aegean Sea is separated into two major subbasins with different climatic conditions: the “north” and the “south” Aegean Sea. The north is more humid than the semiarid south (Lykousis et al., Reference Lykousis, Chronis and Tselepides2002). The north Aegean Sea is characterized by an alternation of deep trenches and troughs, shallow shelves, and sills. The dominant bathymetric feature in the northern sector of the Aegean Sea is the 800- to 1590-m-deep northeast–southwest (NE–SW) elongated depression, known as the North Aegean Trough (Fig. 1a). It includes several interconnected subbasin depressions (Saros, 1061 m deep; Limnos, 1590 m; Athos, 1149 m; and Sporades, 1470 m), widening toward the west, that are separated from each other by 100- to 350-m-deep intervening shoals and associated islands (Papanikolaou et al., Reference Papanikolaou, Alexandri, Nomikou and Ballas2002; Roussakis et al., Reference Roussakis, Karageorgis, Conispoliatis and Lykousis2004).
(color online) (a) Location of the gravity cores AEX-15 and AEX-23 in the North Aegean Trough. (b) Lithologic log of cores AEX-15 and AEX-23.

The physical oceanography of the north Aegean Sea is controlled by the regional climate, the freshwater discharge from major rivers (Axios, Strymon, Nestos, and Evros) draining southeastern Europe, and Black Sea surface-water outflow through the Dardanelles Straits. Previous studies revealed a general cyclonic water circulation in the Aegean Sea, on which a number of mesoscale cyclonic and anticyclonic eddies are superimposed (Casford et al., Reference Casford, Rohling, Abu-Zied, Cooke, Fontanier, Leng and Lykousis2002). The water column structure comprises three major water masses: the superficial nutrient-rich and less saline Black Sea Water (9–22°C and 22–23 psu), the Levantine Intermediate Water (16–25°C and 39.2–39.5 psu) with higher salinity, and the North Aegean Deep Water (13–14°C and 39.1–39.2 psu; Velaoras and Lascaratos, Reference Velaoras and Lascaratos2005). The surface and intermediate waters follow the general counterclockwise circulation of the Aegean Sea and progressively mix as they flow southward along the east coast of Greece (Karageorgis et al., Reference Karageorgis, Kaberi, Tengberg, Zervakis, Anagnostou and Hall2003).
MATERIAL AND METHODS
Location and description of cores
Two gravity cores (AEX-15 and AEX-23) from the North Aegean Trough (Fig. 1) were recovered with R/V Aegaeo in October 2013 and cover most of the Holocene epoch (the last ~10 ka and 8 ka, respectively). Both cores were collected from a relatively isolated elongated subbasin of the north Aegean Sea, oriented NE–SW, with dimensions of approximately 42 × 7 km and a maximum depth of 1290 m. Core AEX-15 (39°39.900′N, 24°15.369′E; 1242 m water depth, length 178 cm) was recovered from the southern sector of the basin; core AEX-23 (39°49.464′N, 24°22.354′E; 1226 m water depth, length 322 cm) was recovered near the depocenter of the basin.
The interval between 0 and 6.5 cm of AEX-15 consists of mud of yellowish-brown color (Munsell soil color 2.5Y 5/3), followed by an interval (6.5 to 14.5 cm) of yellow (2.5Y 6/4) mud with some shell debris. From 21 cm to 122 cm, olive (5Y 6/2) mud with dense darker laminae is observed. The interval between 122 cm to 165 cm is characterized by an olive gray color (5Y 6/2) mud. The last 13 cm consists of grayish olive (7.5Y 6/2) mud (Fig. 1b).
The interval between 0 cm and 246 cm of core AEX-23 consists of olive yellow (7.5Y 6/3) mud that becomes grayish olive (5Y 6/2) up to 286 cm. The rest of the core (286–322 cm) is composed of dark olive gray (2.5GY 4/1) mud. In the top 4 cm of this interval (286–290 cm) lens of mud rich in organic matter with dark olive gray color (2.5GY 4/1) is observed (Fig. 1b).
All samples taken (118 from AEX-15 and 43 from AEX-23) were used for paleontological (planktonic foraminifera, pollen, dinoflagellate cysts, and pteropods) and geochemical (oxygen, δ18O, and carbon, δ13C, isotopes) analyses. Samples were taken from all the intervals of the cores but with different sampling resolution. For the olive gray and dark olive gray intervals, the sampling resolution was 1 cm for AEX-15 and 2.5 cm for AEX-23; beyond these intervals, the sampling was 2 cm for AEX-15 and 5 cm for AEX-23.
Chronostratigraphy
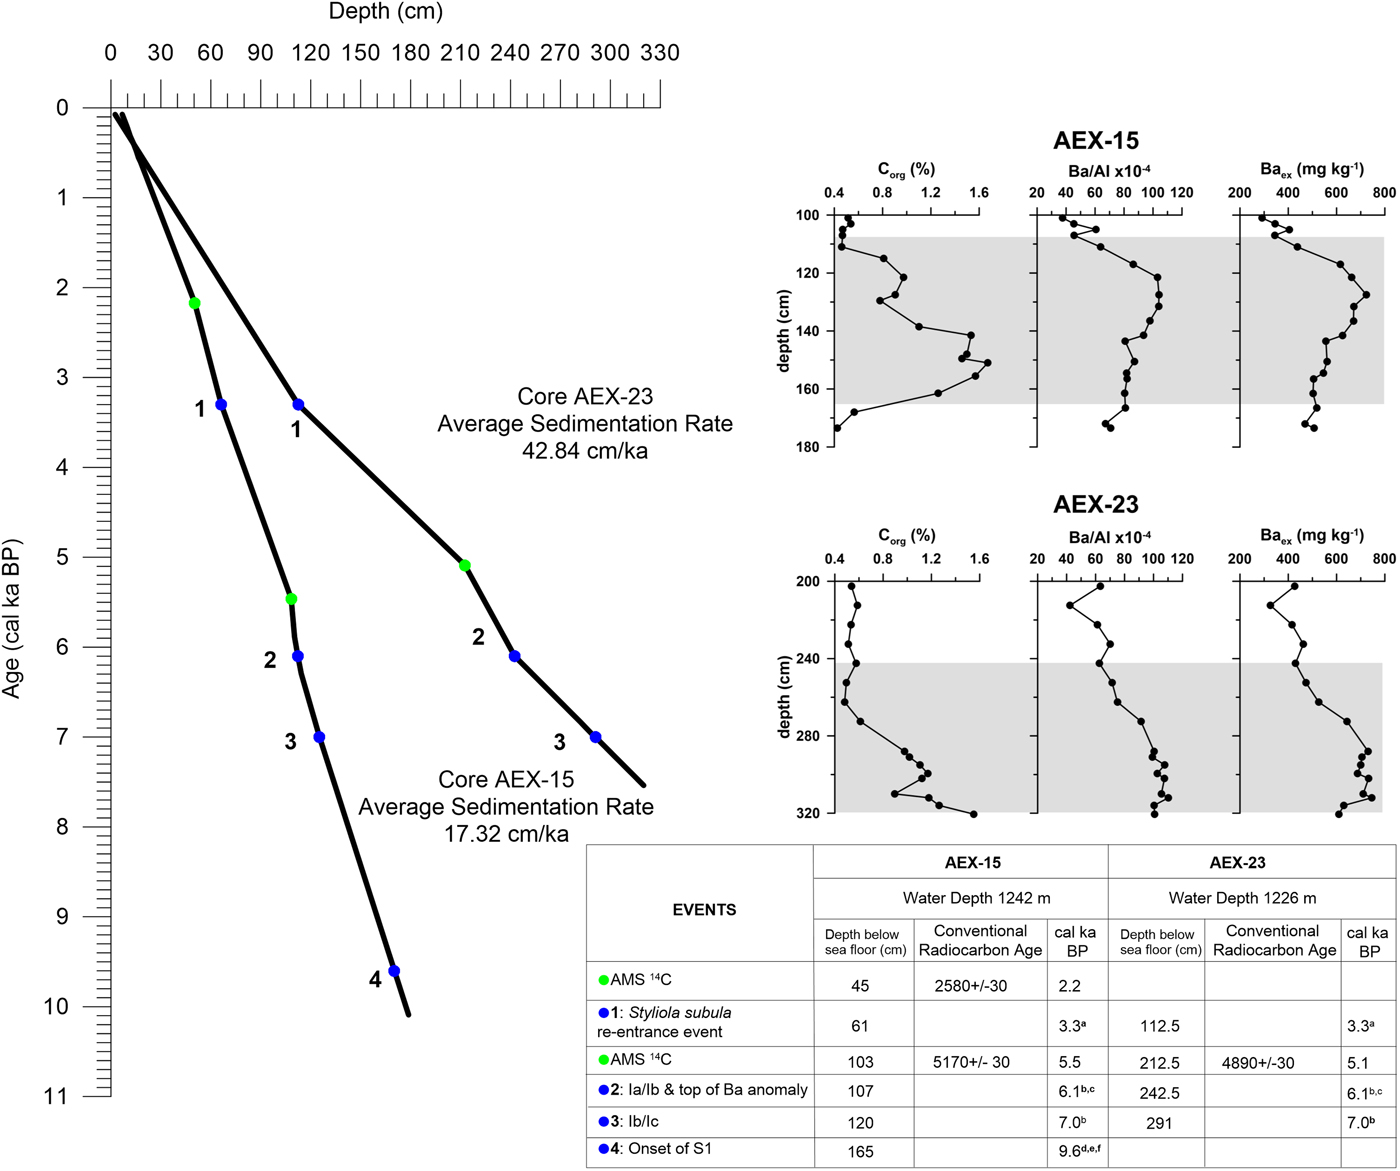
The chronostratigraphy of the cores is based on three accelerator mass spectroscopy radiocarbon (AMS 14C) dates (two for ΑΕΧ−15 and one for core AEX-23 on Globigerinoides ruber tests at Beta Analytics laboratories), supplemented by the detected additional control points, as defined by Ba, Al, and organic carbon measurements (this study) and well-dated correlation horizons from nearby north Aegean cores (Fig. 2). Conventional 14C ages were calibrated by means of the Calib version 7.0.2 software (Stuiver and Reimer, Reference Stuiver and Reimer1993) and the Marine13 data set with a regional reservoir age correction (ΔR) of 58 ± 85 yr outside the sapropel S1 interval (Reimer et al., Reference Reimer, Bard, Bayliss, Beck, Blackwell, Ramsey and Buck2013). Hereafter, ages in this study are reported in calibrated thousands of years before present, notated cal ka BP.
Time stratigraphic framework (age model and mean sedimentation rates) of the study cores along with Corg and Baex concentrations and Ba/Al ratios. Blue dots represent control points and bioevents according to the following: a Buccheri et al. (Reference Buccheri, Carpetto, Di Donato, Esposito, Feruzza, Pescatore and Russo Ermolli2002), b Casford et al. (Reference Casford, Rohling, Abu-Zied, Cooke, Fontanier, Leng and Lykousis2002), c Casford et al. (Reference Casford, Abu-Zied, Rohling, Cooke, Fontanier, Leng, Millard and Thomson2007), d Kotthoff et al. (Reference Kotthoff, Müller, Pross, Schmiedl, Lawson, van de Schootbrugge and Schulz2008a), e Geraga et al. (Reference Geraga, Ioakim, Lykousis, Tsaila Monopolis and Mylona2010), and f Herrle et al. (Reference Herrle, Bollmann, Gebühr, Schulz, Sheward and Giesenberg2018). Green dots represent accelerator mass spectrometry (AMS) 14C datings. (For interpretation of the references to color in this figure legend, the reader is referred to the web version of this article.)

Determination of organic carbon (Corg) and major elements (Al) and barium (Ba) were performed on selected sediment samples from both cores to detect the depth where the onset and termination of S1 deposition occurred (e.g., Martínez-Ruiz et al., Reference Martínez-Ruiz, Paytan, Kastner, González-Donoso, Linares, Bernasconi and Jimenez-Espejo2003, and references therein) (Fig. 2). Corg was determined in a Fisons Instruments EA-1108 CHNS analyzer. The operating parameters were very similar to those reported by Cutter and Radford-Knoery (Reference Cutter, Radford-Knoery, Hurd and Spencer1991), Nieuwenhuize et al. (Reference Nieuwenhuize, Maas and Middelburg1994), and Verardo et al. (Reference Verardo, Froelich and McIntyre1990). The precision of the method is within 5%. A detailed description of the analytical procedure is given by Karageorgis et al. (Reference Karageorgis, Katsanevakis and Kaberi2009).
Major element concentrations were determined on fused beads using an X-ray fluorescence spectrometer (Panalytical PW-2400) at the biogeochemical laboratory of the Hellenic Centre for Marine Research, which is accredited according to ELOT EN ISO/IEC 17025:2005. Aluminum and barium were determined as oxides following the procedure described in Karageorgis et al. (Reference Karageorgis, Anagnostou and Kaberi2005). In addition, barium excess (Baex) that represents marine barite, and thus enhanced productivity (Martínez-Ruiz et al., Reference Martínez-Ruiz, Paytan, Kastner, González-Donoso, Linares, Bernasconi and Jimenez-Espejo2003), was estimated according to Karageorgis et al. (Reference Karageorgis, Anagnostou and Kaberi2005). The analytical precision is 5–10% on the basis of duplicate runs of standards and unknowns, whereas accuracy was assessed using the international reference material PACS-2.
Micropaleontological analyses
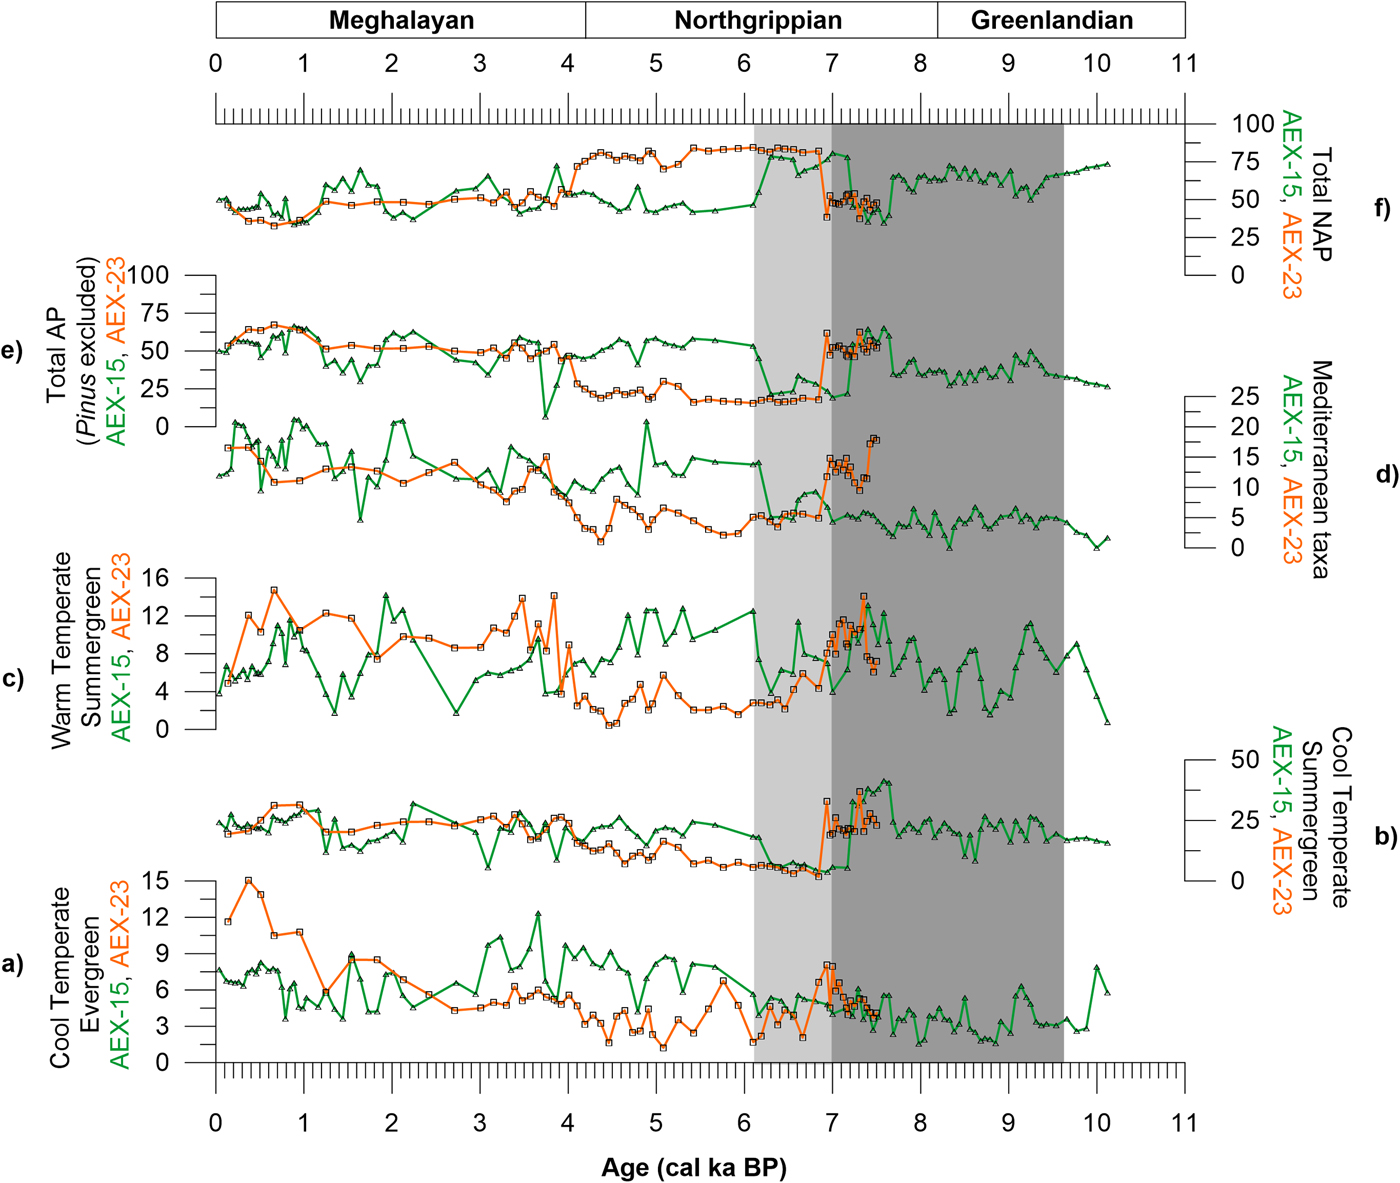
All samples were prepared following standard micropaleontological procedures. For the faunal analyses, approximately 3 cm3 of dried sediment was washed and sieved through 63 µm and 125 µm sieves, and residues were dried in an oven at 50°C. Qualitative and quantitative analyses have been performed on both the planktonic foraminiferal and pteropod assemblages for the >125 µm fraction, split into aliquots, each one containing at least 300 specimens. All shells were handpicked, identified (additionally at morphospecies level where possible; G. ruber), and counted in each sample and then converted into percentages, based on the extrapolation of a counted split (Figs. 3 and 4). The palynomorphs (when possible 400 specimens were counted and identified) were extracted using 10% HCl and 38% HF acids followed by several sievings (wet sieving through 125 µm and ultrasonic 10 µm sieves). The residues were mounted in glycerine gel on microscope slides for analysis under a binocular Nikon transmission microscope at 500× and 1000× (oil immersion) magnification. Pollen percentages for each taxon presented here are based on the main pollen sum excluding Pinus and Pteridophyte spores (Fig. 5). Planktonic foraminiferal taxonomy followed the work of Hemleben et al. (Reference Hemleben, Spindler and Anderson1989) with additional updates from Kontakiotis et al. (Reference Kontakiotis, Antonarakou, Mortyn, Drinia, Anastasakis, Zarkogiannis and Möbius2017); for pteropods, we referred to Di Geronimo (Reference Di Geronimo1970), Van der Spoel (Reference Van der Spoel1976), and Janssen (Reference Janssen2012); and for pollen and dinoflagellate cysts, we referred to Polunin (Reference Polunin1988), Marret and Zonnefeld (Reference Marret and Zonnefeld2003), and Zonneveld et al. (Reference Zonneveld, Marret, Versteegh, Bogus, Bonnet, Bouimetarhan and Crouch2013). Finally, planktonic species with phylogenetic affinities and similar ecological characteristics were counted together and grouped to better interpret distribution patterns (Fig. 3). All morphotypes of G. ruber (“Normal,” “Platys,” “Elongate,” and “Twin” types; Kontakiotis et al., Reference Kontakiotis, Antonarakou, Mortyn, Drinia, Anastasakis, Zarkogiannis and Möbius2017) were plotted together, distinguishing only the “alba” and “rosea” varieties because of different ecological characteristics. Similarly, pollen data were summarized into selected ecological groups: Mediterranean taxa, cool temperate summergreen, cool temperate evergreen, warm temperate summergreen, total nonarboreal pollen (NAP), and the total arboreal pollen (AP) (Fig. 6).
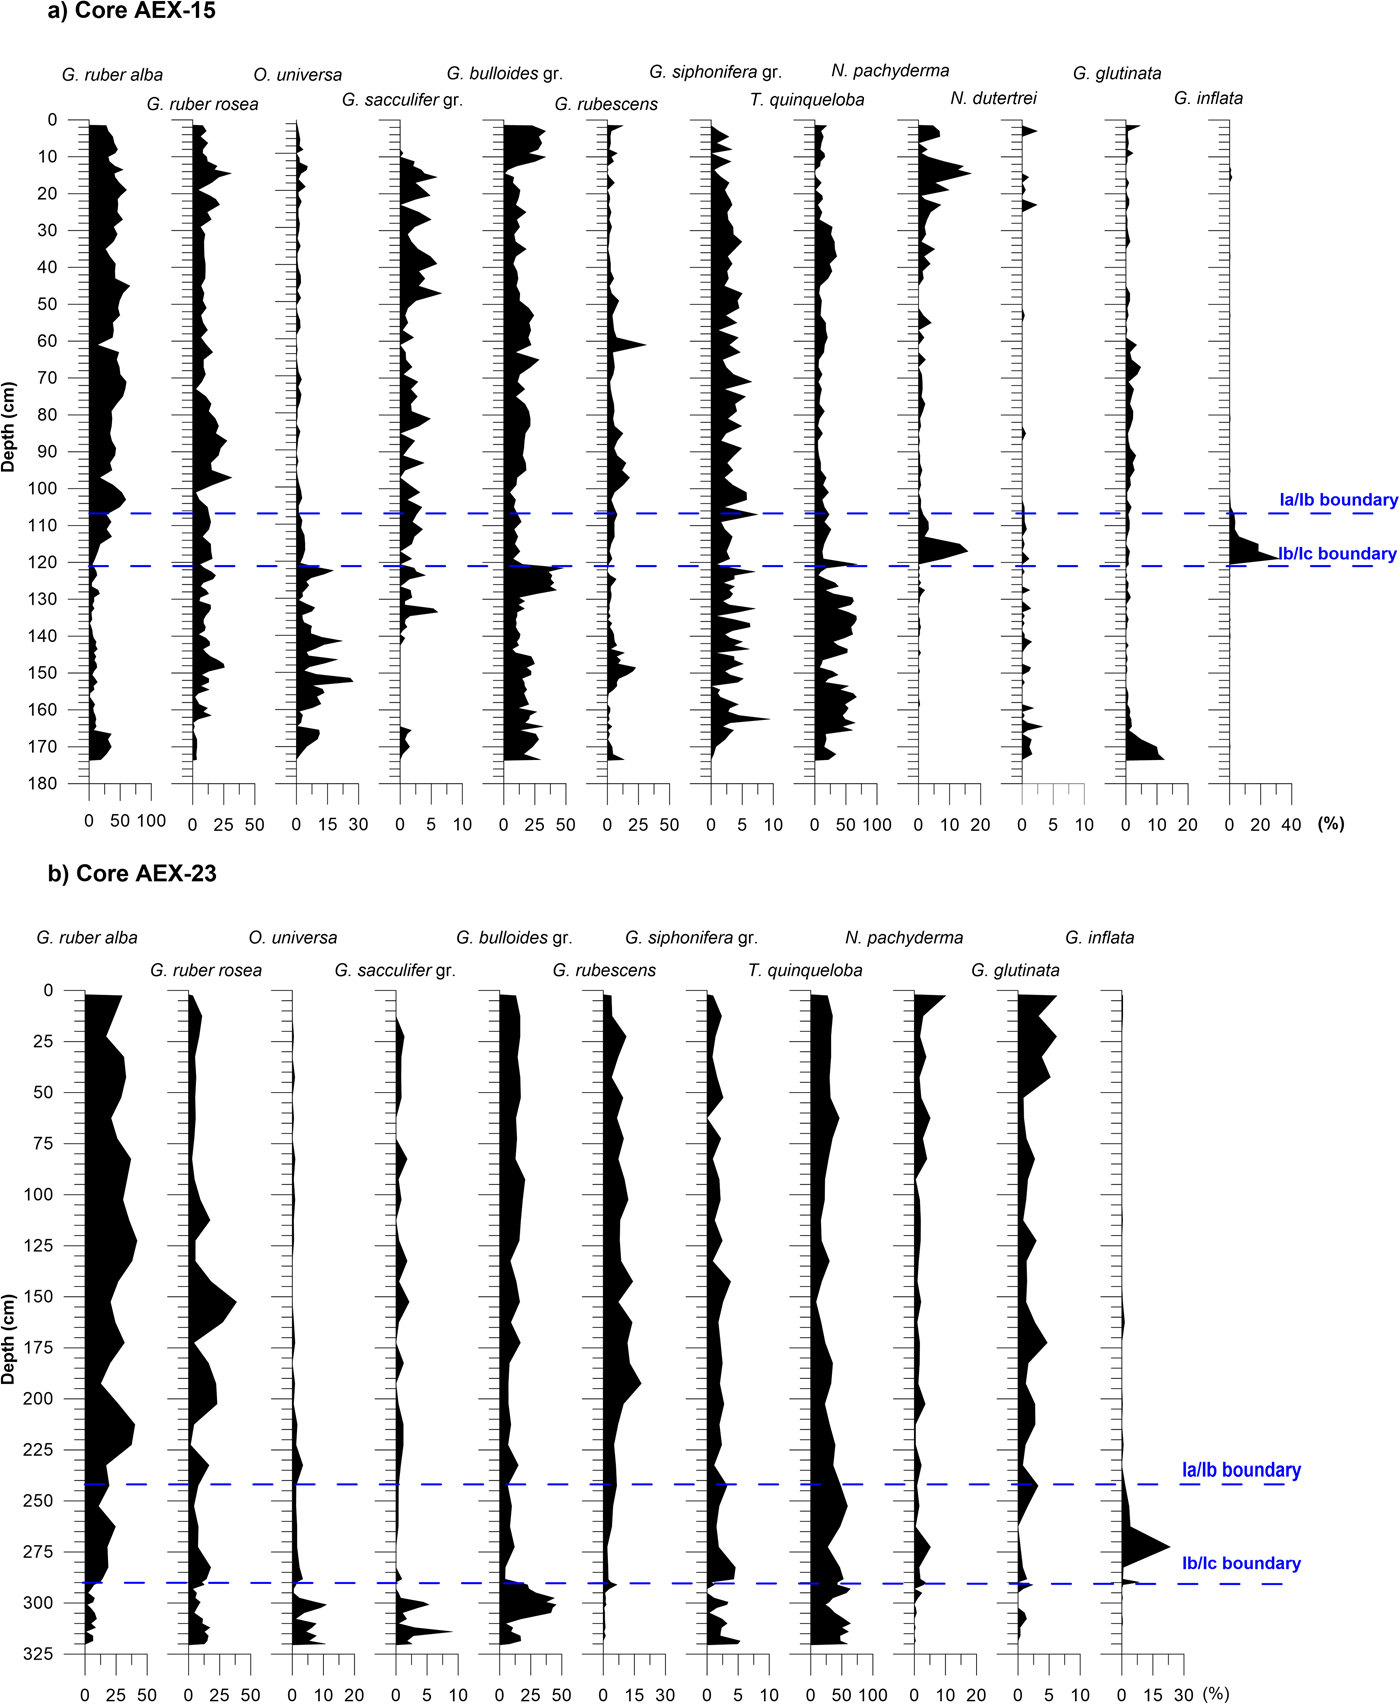
Frequency curves of the most indicative planktonic foraminiferal species in core AEX-15 (a) and AEX-23 (b). Globigerina bulloides group includes the species Globigerina bulloides and Globigerina falconensis, the Globigerinoides sacculifer group includes Globigerinoides trilobus and Globigerinoides sacculifer, and the Globigerinella siphonifera group includes the species Globigerinella aequilateralis, Globigerina calida, and Globigerina digitata. The species Globigerinita glutinata includes the morphotypes with and without bulla. Within the group of neogloboquadrinids, two types have been discerned: Neogloboquadrina pachyderma and Neogloboquadrina dutertrei. The dashed blue lines represent the Ia/Ib and Ib/Ic boundaries. (For interpretation of the references to color in this figure legend, the reader is referred to the web version of this article.)

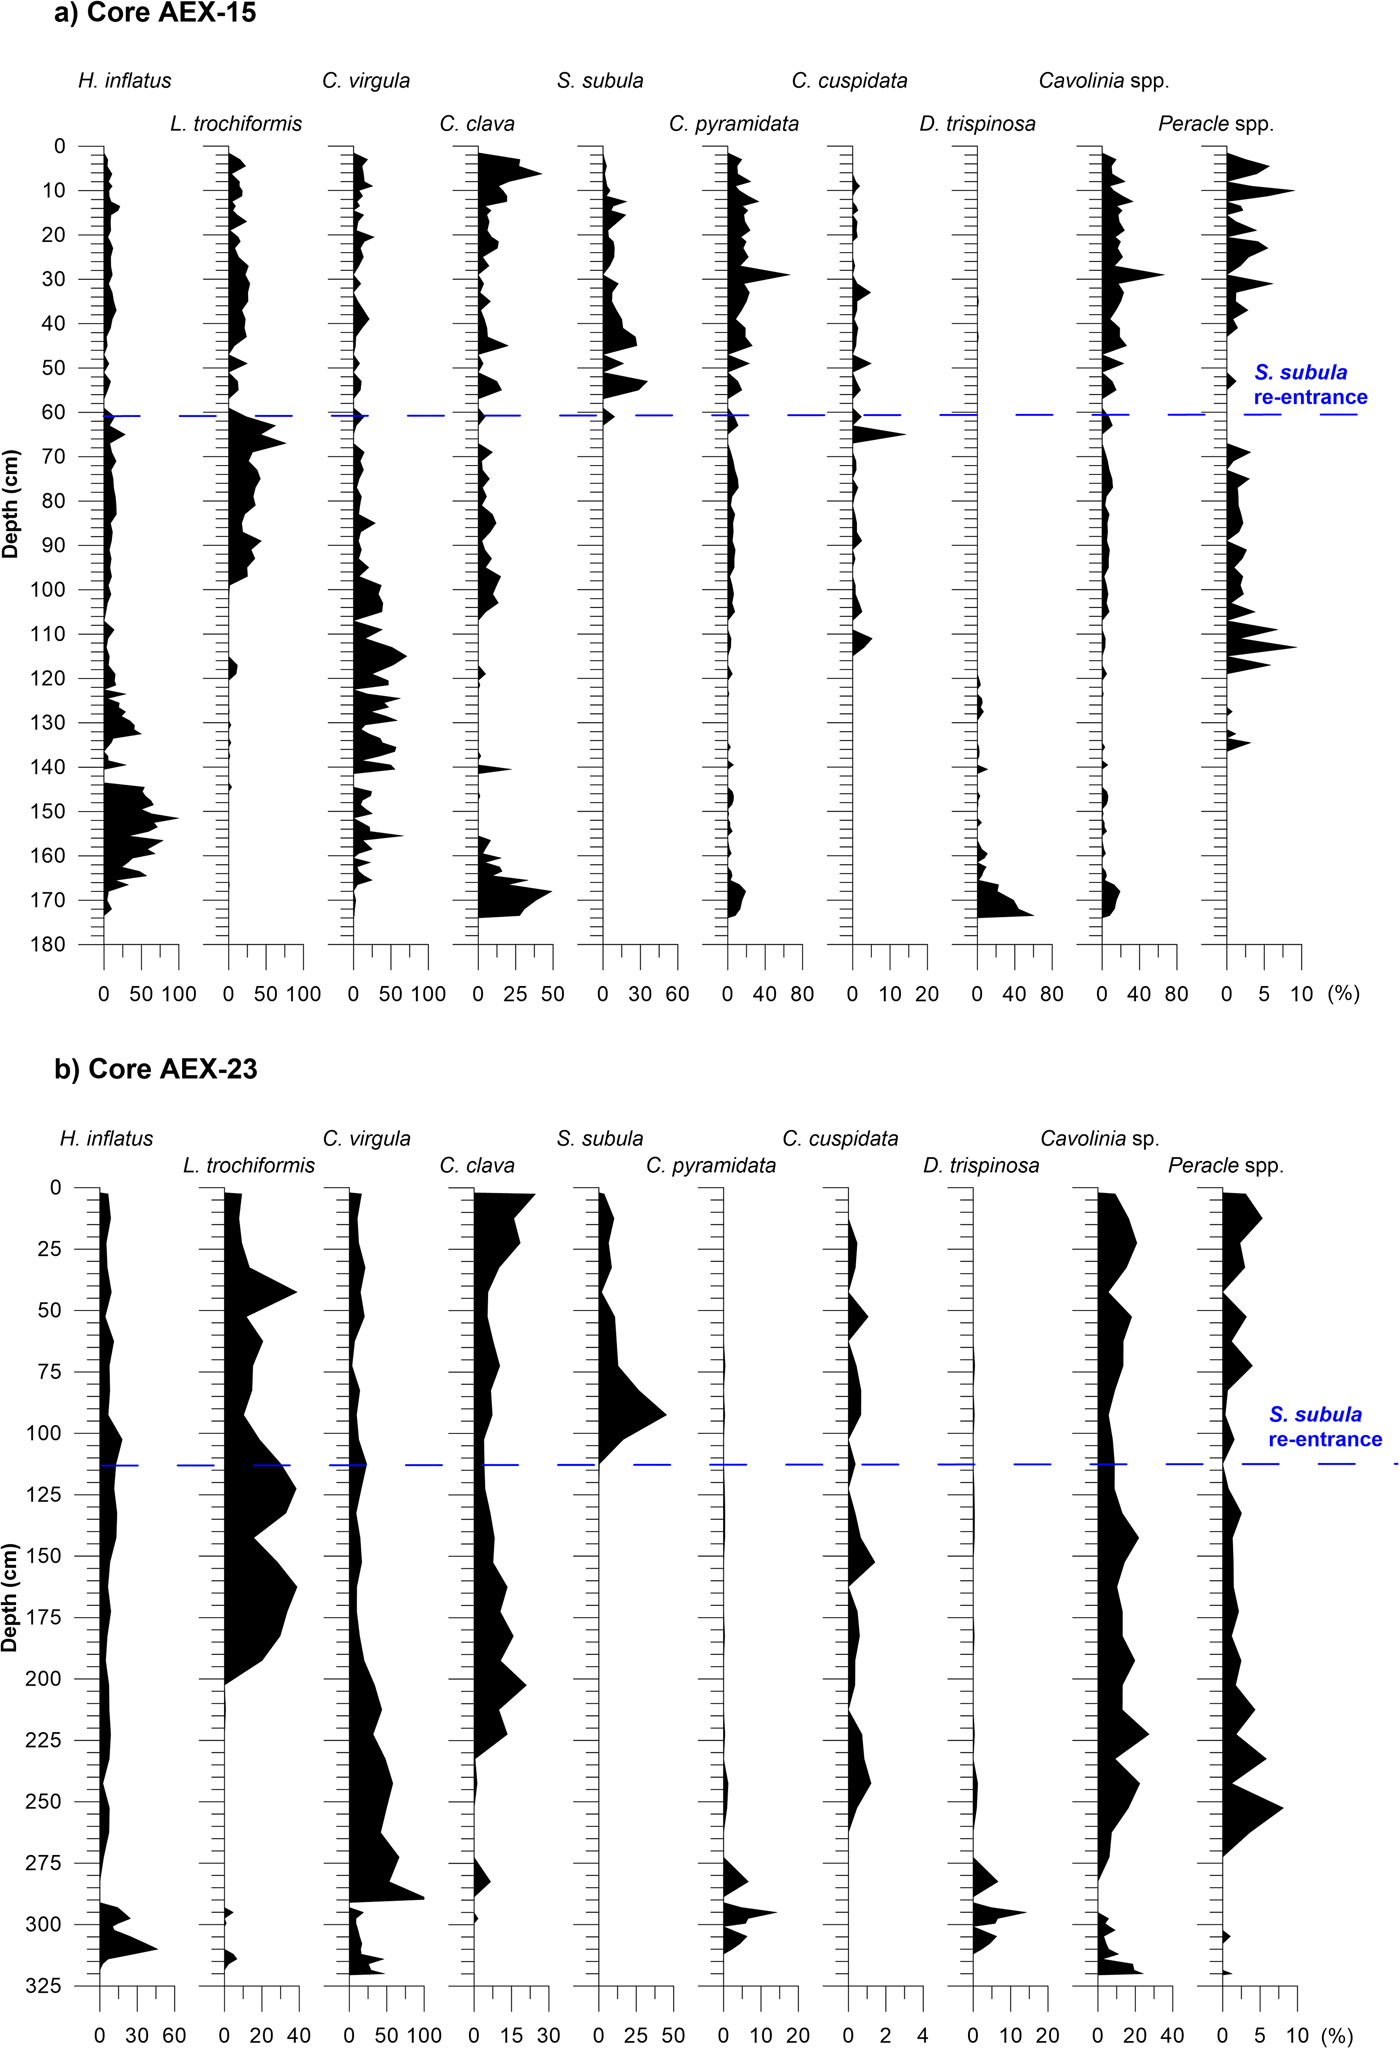
Frequency curves of the most indicative pteropoda in core AEX-15 (a) and AEX-23 (b). The dashed blue line represents the reentrance of the pteropod Styliola subula. (For interpretation of the references to color in this figure legend, the reader is referred to the web version of this article.)

Frequency curves of pollen species for core AEX-15 (a) and core AEX-23 (b).

Down-core variations of cool temperate evergreen taxa (Abies, Picea, Cedrus, Buxus, and Hedera) (a), cool temperate summergreen taxa (Betula, Quercus robur, Alnus, Corylus, Fagus, Carpinus, and Tilia) (b), warm temperate summergreen taxa (c), Mediterranean taxa (Cistus, Quercus ilex, Phillyrea, Olea, and Pistacia) (d), arboreal pollen (AP) groups (excluding Pinus) (e), and nonarboreal pollen (NAP) (Poaceae, Asteraceae, Chenopodiaceae, Artemisia, Plantago, and Ephedra) (f); green line with triangle for AEX-15 and orange line with square for AEX-23. Gray and light gray bands correspond to the sapropel S1 and its oxidized part, respectively. (For interpretation of the references to color in this figure legend, the reader is referred to the web version of this article.)

Stable isotope analyses
For stable oxygen and carbon isotope measurements (δ18Ο, δ13C), 30 specimens of the planktonic species Globigerinoides ruber f. alba were picked from the 250–300 µm size fraction. In particular, we exclusively used the morphotype “Normal” (usually represented to G. ruber sensu stricto) of Kontakiotis et al. (Reference Kontakiotis, Antonarakou, Mortyn, Drinia, Anastasakis, Zarkogiannis and Möbius2017) in order to minimize potential morphotype-specific differential responses in stable isotope compositions. This size fraction limitation was used to minimize ontogenetic and growth rate effects on shell geochemistry (Spero et al., Reference Spero, Mielke, Kalve, Lea and Pak2003). The analyses were carried out at the Laboratory of Geology and Geophysics at Edinburgh University. Foraminiferal δ18O and δ13C data were calibrated to National Bureau of Standards 19 (NBS19), and the isotope values are reported in ‰ relative to Vienna Pee Dee belemnite scale. The external standard errors of the stable carbon and oxygen isotope analyses are <0.06‰ and 0.08‰, respectively.
Paleoceanography proxy records
The planktonic foraminiferal relative distributions are used as a first-order estimate of sea-surface temperature (SST) variations. An index of the SST variations was constructed based on the down-core variation of planktonic foraminiferal abundances, referred to as planktonic paleoclimatic curve (PPC). The PPC was obtained by the formula 100 × (w − c)/(w + c), where w represents the warm-water indicators (G. ruber alba, G. ruber rosea, Orbulina universa, Globigerinoides sacculifer gr., Globoturborotalita rubescens, and Globigerinella siphonifera gr.), and c the cold-water indicators (Globorotalia inflata, Globorotalia truncatulinoides, Turborotalita quinqueloba, Globigerinita glutinata, and Globorotalia scitula) (Rohling et al., Reference Rohling, Jorissen, Vergnaud-Grazzini and Zachariasse1993). The stable isotopes (δ18O, δ13C) were used to infer SST and productivity variations, respectively.
Following the recent findings of Kontakiotis (Reference Kontakiotis.2016) from the eastern Mediterranean Sea, we also present the paleoceanographic indices of eutrophication and upwelling (E-index and U-index) as representative of the hydrographic evolution and ecosystem dynamics of the north Aegean Sea. The eutrophication index (E-index) was estimated using the sum of the eutrophic species (Neogloboquadrina pachyderma, Neogloboquadrina dutertrei, Globigerina bulloides, T. quinqueloba, and G. inflata) versus the sum of the eutrophic plus oligotrophic species (G. ruber alba, G. ruber rosea, G. rubescens, G. sacculifer, O. universa, and G. siphonifera). The percentage of G. bulloides was estimated as an upwelling index (U-index). The species G. siphonifera gr., G. rubescens, O. universa, and G. sacculifer gr. are referred as SPRUDTS group, following the ecological characteristics of Rohling et al. (Reference Rohling, Jorissen, Vergnaud-Grazzini and Zachariasse1993).
RESULTS
Planktonic foraminifera distribution pattern
Planktonic foraminifera are abundant and well preserved in all the samples from both analyzed cores. The qualitative analysis of the planktonic foraminifera allow the identification of 18 species lumped into 15 groups: Globigerinoides ruber alba, Globigerinoides ruber rosea, Globigerina bulloides group, Orbulina universa, Globigerinoides sacculifer group, Globoturborotalita rubescens, Globigerinoides conglobatus, Globogerinella siphonifera group, Globorotalia inflata, Turborotalita quinqueloba, Globorotalia truncatulinoides, Globigerinita glutinata, Globorotalia scitula, Neogloboquadrina dutertrei, and Neogloboquadrina pachyderma. The down-core stratigraphic distributions of their relative abundance are shown in Figure 3.
From the bottom of core AEX-15 (173.5 cm) up to 165 cm, the assemblage is dominated by G. ruber f. alba with percentages up to 35%, along with T. quinqueloba (34%) and G. bulloides (29%). Present with low percentages in this interval are the species G. glutinata (12%), G. rubescens (13%), and O. universa (11%). Between 165 cm and 120 cm (AEX-15), the warm subtropical species (G. ruber f. rosea and O. universa) are abundant with percentages up to 25%, and the species Turboratalita quinqueloba and G. bulloides present their maximum percentages (~68% and 48%, respectively). At the same interval neogloboquadrinids occur sporadically and with very low percentages (<2%), and G. inflata is totally absent (Fig. 3a). The relative abundance curves of G. sacculifer group, G. siphonifera group, and O. universa display highly variable down-core patterns, occasionally reaching significant percentages (10–30%). G. ruber f. alba and G. rubescens are continuously present but in small percentages. At 120 cm in AEX-15 and 291 cm in AEX-23, a sharp increase in the abundance of G. inflata (32% in AEX-15 and 23% in AEX-23) and N. pachyderma (16% in AEX-15 and 5% in AEX-23) is observed. Later on (119 cm to 1.5 cm in AEX-15 and 290 cm to 2.5 cm in AEX-23), the distribution pattern of these species is limited, with the exception of the upper part of the cores, which is marked by a sharp increase of N. pachyderma. During this interval, G. ruber f. alba reaches maximum abundances (up to 65% and 40% for AEX-15 and AEX-23, respectively). G. ruber f. rosea (~10–15%) and T. quinqueloba (~15–30%) are still present but less abundant, whereas O. universa decreases dramatically (Fig. 3). Increasing percentages of G. rubescens (~15–30%) and G. glutinata (~5%) are also recorded.
Pteropod distribution pattern
All samples examined for foraminifera include variable amounts of aragonitic pteropods. A total of 11 species of Euthecosomata (Heliconoides inflatus, Limacina trochiformis, Limacina retroversa, Creseis virgula, Creseis clava, Hyalocyclis striata, Styliola subula, Clio pyramidata, Clio cuspidata, Diacria trispinosa, and Cavolinia spp.) and 2 genera of Pseudothecosomata (Gleba sp. and Peracle spp.) were identified. Heteropoda of the family of Atlantidae were handpicked and counted without further identification. Generally, the specimens are well preserved, and the majority of them are juveniles. Adult specimens where presented were fragmented (Cavolinia, C. pyramidata, and C. cuspidata). The identification of some species or genera was made by their protoconchs (Creseis, Diacria, and Cavolinia), which was the only left residue. The down-core variation of their abundance is presented in Figure 4.
The assemblage observed from 173.5 cm to 165 cm of AEX-15 consists of high percentages of the warm-water D. trispinosa (up to 60%) and C. clava (27–49%) accompanied by C. pyramidata (~20%) and H. inflatus (~10%). Between 165 cm and 120 cm (AEX-15) and 320 cm and 291 cm (AEX-23), the fauna is characterized by the high relative abundance of H. inflatus (79% in AEX-15 and 46.5% in AEX-23), C. virgula (58% in AEX-15 and 47.5% in AEX-23), and Cavolinia spp. (22% in AEX-15 and 24.3% in AEX-23) (Fig. 4). The species C. pyramidata and D. trispinosa decrease dramatically during this interval in AEX-15 (0–6% and 0–11%, respectively), whereas in AEX-23 D. trispinosa shows two significant influxes at 305 cm and at 295 cm (up to 6% and 14%, respectively). Peracle spp. appear in abundance from 117 cm in AEX-15 and 262.5 cm in AEX-23 (Fig. 4). The interval between 119 cm and 1.5 cm in AEX-15 and 290 cm and 2.5 cm in AEX-23 presents similarities in both cores with percentages of H. inflatus decreasing (less than 28% in AEX-15 and 18% in AEX-23) and the epipelagic Creseis spp. and Cavolinia spp. being present throughout the whole interval. Limacina trochiformis appears for the first time in this interval at 103 cm in AEX-15 and at 192.5 cm in AEX-23, reaching percentages of 62% in AEX-15 and 39% in AEX-23. The steno-haline epipelagic warm-water species S. subula enters the fauna at 61 cm in AEX-15 and at 112.5 cm in AEX-23 (Fig. 4).
Pollen distribution pattern
Both cores provided abundant and well-preserved palynomorphs. The qualitative analyses allowed the identification of the most important species: 26 of AP (Pinus, Abies, Picea, Betula, Quercus ilex, Quercus robur, Cedrus, Alnus, Juglans, Corylus, Ulmus, Fagus, Carpinus, Olea-type, Pistacia-type, Phillyrea, Cistus, Platanus, Tilia, Ostrya, Acer, Buxus, Hedera, Fraxinus, Hippophae, and Populus) and 6 of NAP (Poaceae, Asteraceae, Chenopodiaceae, Plantago, Artemisia, and Ephedra). The down-core variation of their abundance is shown in Figure 5.
Between 173.5 cm and 165 cm of AEX-15, the flora is dominated by Chenopodiaceae (25%), Asteraceae (18%), Artemisia (15%), and Poaceae (13%). Apart from Q. robur (10%), the AP (Betula, Alnus, and Carpinus) is represented with low percentages (~4%). At 165 cm in the core AEX-15, an increase in the AP concentration and diversity is observed. Specifically, the Mediterranean taxa Pistacia, Phillyrea, and Olea present their first appearance, and deciduous Quercus remains a dominant element of the flora (20%) (Fig. 5a). From 107 cm, species such as Q. ilex, Q. robur, Abies, Alnus, Juglans, Fraxinus, and Olea become more abundant in AEX-15. The interval between 242.5 cm and 152.5 cm in AEX-23 presents a sharp decline in percentages of Populus, Fraxinus, Hedera, Pistacia, Olea, and Phillyrea. From 152.5 cm to the top of AEX-23, the abovementioned species increase in abundance (Fig. 5b).
Dinoflagellate distribution pattern
Nineteen species of dinoflagellate cysts were recognized from the sediments of both cores (Brigantedinium simplex, Brigantedinium cariacoense, Polysphaeridium zoharyi, Impagidinium aculeatum, Operculodinium israelianum, Impagidinium patulum, Impagidinium sphaericum, Lingulodinium machaerophorum, Nematosphaeropsis labyrinthus, Operculodinium centrocarpum, Tetactodinium psilatum, Spiniferites delicatus, Tuberculodinium vancampoae, Spiniferites mirabilis, Spiniferites bentorii, Spiniferites ramosus, Spiniferites bulloideus, Spiniferites hyperacanthus, and Bitectatodinium tepikiense). Their down-core variation is shown in Figure 7.
Frequency curves of dinoflagellate cysts for core AEX-15 (a) and core AEX-23 (b).

Between 173.5 cm and 165 cm of AEX-15, dinocysts exhibit low relative abundances with the only exceptions being the S. ramosus (37%) and L. machaerophorum (17%). Dinoflagellate cyst percentages between 165 cm and 120 cm of AEX-15 present highly variable down-core patterns with the species S. ramosus, L. machaerophorum, and O. centrocarpum being dominant in the whole interval. In AEX-23 toward 291 cm, the species B. simplex, P. zoharyi, I. patulum, and S. mirabilis are also present with higher percentages than in AEX-15. Between 120 cm and 107 cm in AEX-15 and 291 cm and 242.5 cm in AEX-23, species such as P. zoharyi, I. aculeatum, I. sphaericum, and S. mirabilis present an abrupt disappearance. From 93 cm in AEX-15 and 152.5 cm in AEX-23 to the top of both cores, the dinoflagellate cysts assemblage recovers with species such as L. machaerophorum, S. bentorii, S. mirabilis, and Spiniferites dfsp., reaching their maximum relative abundances (37%, 12%, and 7% respectively), whereas the species S. hyperacanthus, B. tepikiense, and B. cariacoense exhibit low relative abundance.
Stable isotopes
Oxygen and carbon isotopic values are presented in Figures 8 and 9. Oxygen isotopic values of G. ruber (Fig. 9b) display considerable scatter in the intervals between 173.5 cm and 120 cm of AEX-15 and 320 cm and 291 cm of core AEX-23. Less variable and rather light values are observed in the part toward the top of both cores. In detail, δ18O values between 173.5 cm and 120 cm in core AEX-15 range from −2.86‰ to + 4.15‰ (Fig. 9b); the most significant enrichments up to ~4‰ are evident at 160.5 cm (3.24‰) and at 158.5 cm (4.15‰). At about 146 cm, a shift to heavier δ18O values is observed (from 0.2‰ to 0.8‰) and is followed by a recovery of light values. The same pattern is observed again at 141 cm with δ18O values ranging from 0.1‰ to 0.9‰. In core AEX-23 between 320 cm and 291 cm, slight enrichment (−0.1‰ to + 1‰) in δ18O values is observed. From this point on, δ18O values are relatively stable in both cores, stabilizing around zero, with the only exceptions of three peaks in AEX-15 (a negative −2.8‰ at 111 cm and two positives at 89 cm [ + 1.8‰] and at 43 cm [ + 1.29‰]) and two positive peaks in AEX-23 (+1.07‰ at 62.5 cm and + 1.34‰ at 2.5 cm).
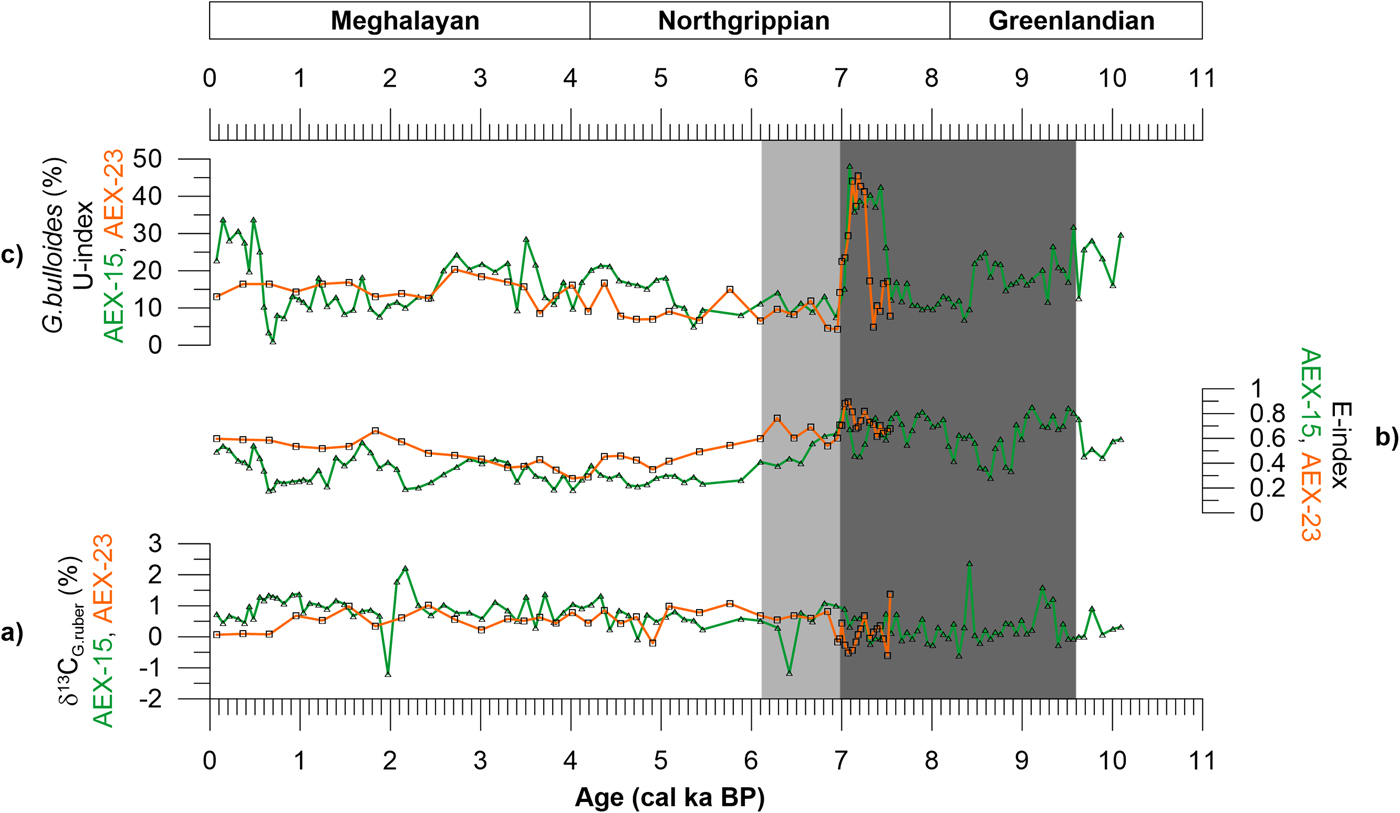
Productivity records (green line with triangle for AEX-15 and orange line with square for AEX-23). (a) Carbon isotope record (δ13CG. ruber). (b) Eutrophication index (E-index). (c) G. bulloides % abundance (U-index). Gray and light gray bands correspond to the sapropel S1 and its oxidized part, respectively. (For interpretation of the references to color in this figure legend, the reader is referred to the web version of this article.)

Comparison of North Aegean results (green line for AEX-15 and orange line for AEX-23) with relevant climate reconstructions of the eastern, central, and western Mediterranean and North Atlantic, including the following: (a) Planktonic paleoclimatic curve (PPC). (b) Oxygen isotope record (δ18OG. ruber). (c) Alkenone sea surface temperatures (SSTs) of ODP site 160-967D in the Levantine Basin (Emeis et al., Reference Emeis, Struck, Schulz, Rosenberg, Bernasconi, Erlenkeuser, Sakamoto and Martinez-Ruiz2000). (d and e) Alkenone SSTs from cores M25/4-KL11 and M40/4-SL78, respectively, from the Ionian Sea (Emeis et al., Reference Emeis, Struck, Blanz, Kohly and Woß2003). (f) δ18OG. bulloides. (g) Alkenone SSTs of core BS7938 from the Tyrrhenean Sea (Cacho et al., Reference Cacho, Grimalt, Canals, Sbaffi, Shackleton, Schönfeld and Zahn2001). (h) δ18OG. bulloides from core MD99-2343 in the Balearic Sea (Frigola et al., Reference Frigola, Moreno, Cacho, Sierro, Flores, Grimalt, Hodell and Curtis2007). (i) δ18OG. bulloides. (j) Alkenone SSTs of core MD952043 in the Alboran Sea (Cacho et al., Reference Cacho, Grimalt, Canals, Sbaffi, Shackleton, Schönfeld and Zahn2001). (k) Hematite stained grains (HSG)–based cold events. (l) δ18ON. pachyderma (d) for VM29-191 (Bond et al., Reference Bond, Showers, Cheseby, Lotti, Almasi, DeMenocal, Priore, Cullen, Hajdas and Bonani1997). Blue bands correspond to North Aegean cooling events, whereas gray and light gray bands to the sapropel S1 interval and its oxidized part. (For interpretation of the references to color in this figure legend, the reader is referred to the web version of this article.)

The carbon isotope analyses (δ13C) exhibit more scatter (Fig. 8a) than the δ18O records, especially in the lower part of both cores. In AEX-15, δ13CG. ruber shows a gradual decrease up to 120 cm, culminating in a minimum at about 142.5 cm. The only exceptions in this interval are the following positive peaks: 160.5 cm (+1.2‰), 158.5 cm (+1.6‰), and 144.5 (+2.4‰). From 120 cm to the top of this core, the general trend shows values ranging from approximately + 0.3‰ to + 1‰ with two distinct negative excursions at 41 cm (−1.2‰) and at 111 cm (−1.1‰) along with a positive one at 45 cm (+2.2‰). In AEX-23, between 320 cm and 291 cm δ13C values are depleted (from −0.6‰ to + 0.3‰). The interval between 288 cm and 212.5 cm is characterized by heavier values (average + 0.6‰). From 212.5 cm to the top, δ13CG. ruber exhibits slightly lighter values with a negative peak at 202.5 cm (−0.2‰).
DISCUSSION
Time stratigraphic framework and sedimentation rates
The age model of the analyzed cores was established by linear interpolation between all dating points. In addition to the AMS 14C dates, the biostratigraphic control provides two well-dated correlation horizons, the biozone Ia/Ib and Ib/Ic boundaries of Casford et al. (Reference Casford, Rohling, Abu-Zied, Cooke, Fontanier, Leng and Lykousis2002). Correlations are also suggested by variations in the Ba/Al and Corg concentrations. These are useful chronological standards for dating late Quaternary sequences in the central and eastern Mediterranean (including the Aegean Sea; Casford et al., Reference Casford, Rohling, Abu-Zied, Cooke, Fontanier, Leng and Lykousis2002, Reference Casford, Abu-Zied, Rohling, Cooke, Fontanier, Leng, Millard and Thomson2007; Geraga et al., Reference Geraga, Ioakim, Lykousis, Tsaila Monopolis and Mylona2010; Kontakiotis et al., Reference Kontakiotis, Antonarakou and Zachariasse2013; Drinia et al., Reference Drinia, Antonarakou, Tsourou, Kontakiotis, Psychogiou and Anastasakis2016; Kontakiotis, Reference Kontakiotis.2016) because of their Mediterranean-wide applicability and synchronicity (Capotondi et al., Reference Capotondi, Borsetti and Morigi1999; Hayes et al., Reference Hayes, Rohling, De Rijk, Kroon and Zachariasse1999; Casford et al., Reference Casford, Abu-Zied, Rohling, Cooke, Boessenkool, Brinkhuis and De Vries2001).
Based on our age model, the planktonic foraminifera distribution pattern allows identification of the biozone Ia/Ib and Ib/Ic boundaries (Casford et al., Reference Casford, Rohling, Abu-Zied, Cooke, Fontanier, Leng and Lykousis2002). Subzone Ic (173 cm–120 cm, AEX-15) was identified by the warm subtropical species (G. ruber f. rosea, and O. universa) as well as by T. quinqueloba and G. bulloides (Fig. 3a). The sharp increase in the abundance of G. inflata and N. pachyderma at 120 cm in AEX-15 and at 291 cm in AEX-23 is inferred to mark the onset of the Ib subzone, whereas the Ia/Ib boundary is marked by their decrease (107 cm in AEX-15 and 242.5 cm in AEX-23). This subzone is also characterized by the maximum abundances of G. ruber f. alba and the sharp increase of N. pachyderma at the upper part (Fig. 3).
Although the onset of sapropel S1 (~9.6 cal ka BP; Casford et al., Reference Casford, Rohling, Abu-Zied, Cooke, Fontanier, Leng and Lykousis2002, Reference Casford, Abu-Zied, Rohling, Cooke, Fontanier, Leng, Millard and Thomson2007) is clearly depicted in organic carbon content (Corg; sharp increase from background values, Fig. 2), its termination is obscured by oxidation processes. In this case, Ba is a more reliable proxy to record the original thickness of the sapropel layer (De Lange et al., Reference De Lange, Thomson, Reitz, Slomp, Principato, Erba and Corselli2008). Therefore, in core AEX-15, the vertical distribution of Corg with respect to Ba/Al and Baex shows that sapropel S1 deposition commenced at 165 cm and terminated at 107 cm, with the sediments between 107 and 120 cm representing the oxidized sapropel. In core AEX-23, elemental profiles corroborate termination at 242.5 cm, while the oxidation zone extends up to 291 cm, and the onset of S1 deposition is not reached in the core (Fig. 2). As a result, the upper boundary of S1 is determined by the Ba/Al ratios, which have been dated at 6.1 ka in the Aegean Sea (Casford et al., Reference Casford, Abu-Zied, Rohling, Cooke, Fontanier, Leng, Millard and Thomson2007). This age is consistent with the Ia/Ib boundary, which is defined by the termination of the higher percentages of G. inflata (Casford et al., Reference Casford, Rohling, Abu-Zied, Cooke, Fontanier, Leng and Lykousis2002) and correlates well with the AMS dating (5170 cal yr BP) at a 103 cm depth. Assemblage Ic, which is mainly characterized by the sapropel fauna, also occurs all over the Aegean Sea and ends on average at 7.0 cal ka BP (Casford et al., Reference Casford, Rohling, Abu-Zied, Cooke, Fontanier, Leng and Lykousis2002).
Based on the adopted chronostratigraphic framework, sediment levels used in this study span the last 10.1 cal ka BP for core AEX-15 and 7.5 cal ka BP for AEX-23, with an average sedimentation rate of 17.3 and 42.8 cm/ka, respectively (Fig. 2). These rates assume that the sediment accumulation has been consistent throughout each interval, and they are in good agreement to those reported in the north Aegean Sea (>20 cm/ka; Zachariasse et al., Reference Zachariasse, Jorissen, Perissoratis, Rohling and Tsapralis1997; Kuhnt et al., Reference Kuhnt, Schmiedl, Ehrmann, Hamann and Hemleben2007; Kotthoff et al., Reference Kotthoff, Müller, Pross, Schmiedl, Lawson, van de Schootbrugge and Schulz2008a, Reference Kotthoff, Pross, Müller, Peyron, Schmiedl, Schulz and Bordon2008b; Kontakiotis, Reference Kontakiotis.2016). The differing rates between the two cores expresses the heterogeneity of sedimentation rates previously documented in the north Aegean Sea (Roussakis et al., Reference Roussakis, Karageorgis, Conispoliatis and Lykousis2004), resulting from large seafloor topographic contrasts and variable sedimentary processes in the study area. In particular, the higher sedimentation rate of core AEX-23 is explained by the adjacent slope that transports sedimentary inputs by deep bottom currents.
Paleoenvironmental reconstruction
The geochemical records (δ18Ο, δ13C), in combination with the foraminiferal, pteropod, pollen, and dinocyst abundance records, are best interpreted as a series of successive changing, climatically driven dynamic regimes. The evidence of these changes is interpreted and discussed in terms of the events that mainly accompanied the transition out of the late glacial period (Termination 1b; Casford et al., Reference Casford, Rohling, Abu-Zied, Cooke, Fontanier, Leng and Lykousis2002), the deposition of sapropel S1 during the HCO, and the postsapropel interval. These are described subsequently as a series of transitory states together with a detailed documentation of the main isotopic and faunal/floral changes recognized in our north Aegean records (Figs. 6, 8 and 9). The timing of each state is in agreement with relevant paleoceanographic reconstructions (Siani et al., Reference Siani, Magny and Paterne2013; Grant et al., Reference Grant, Grimm, Mikolajewicz, Marino, Ziegler and Rohling2016) and may be considered typical of the particular climatic/circulation regime of the study area.
Termination 1b
From ~10.1 cal ka BP to the onset of the sapropel S1 layer, a gradual depletion of δ18Ο is recorded and can be attributed to the global signal of meltwater pulse 1B. The slight shift to lighter δ18Ο values signifies a gradual freshening of the upper water column. The close similarity in timing of the δ18Ο changes in both G. ruber foraminiferal calcite (core AEX-15) and seawater (core LC-21; Marino et al., Reference Marino, Rohling, Sangiorgi, Hayes, Casford, Lotter, Kucera and Brinkhuis2009) provides evidence that this δ18ΟG. ruber depletion prior to S1 deposition is dominated by the inflow of isotopically light, fresher surface waters into the Aegean Sea, and the consequent sea-surface freshening propagates through the entire eastern Mediterranean away of the sites of freshwater discharge (including the north Aegean Sea) because of the efficient large-scale counterclockwise circulation of the surface waters.
However, the difference in magnitude with relevant δ18Ο data from the south Aegean Sea during this time (e.g., Marino et al., Reference Marino, Rohling, Sangiorgi, Hayes, Casford, Lotter, Kucera and Brinkhuis2009; Fhlaithearta et al., Reference Fhlaithearta, Reichart, Jorissen, Fontanier, Rohling, Thomson and De Lange2010) suggests that the advection of fresher surface waters from the north through river runoff becomes inhibited because of the intense thermohaline front to the north of the study core sites, which prevents southward extension of the influence of the north Aegean surface waters. Early Holocene pollen records indicate increased precipitation over the north Aegean borderland (Kotthoff et al., Reference Kotthoff, Müller, Pross, Schmiedl, Lawson, van de Schootbrugge and Schulz2008a, Reference Kotthoff, Pross, Müller, Peyron, Schmiedl, Schulz and Bordon2008b), and so the position of this front was controlled by the local cyclonic circulation of the basin. Its intensity was the same or even stronger than today.
The accompanied high values (up to 50%) of PPC and the increasing trend of warm temperate summergreen, as well the subtropical-temperate dinocysts (P. zoharyi, I. aculeatum, I. sphaericum, S. mirabilis, and Tetactodinium psilatum) (Figs. 6 and 7c), indicate the climate amelioration. This interval is marked by high relative abundances of warm mixed-layer species (including the pteropod Diacria trispinosa) and the high abundance of G. glutinata (Figs. 3 and 4). The former is interpreted as indicative of an increase of depth and extent of the thermocline, and therefore the strengthening of summer stratification in a generally well-oxygenated environment. The shift toward the dominance of the shallower-living species G. glutinata could be explained in terms of increased seasonality. The opportunistic response of this species to any increase in nutrient variability is also in agreement with Casford et al. (Reference Casford, Rohling, Abu-Zied, Cooke, Fontanier, Leng and Lykousis2002), who presented a case for an initial period of 100–1500 yr of nutrient accumulation prior to the onset of S1 deposition. This is evident in all the productivity-related records, evidenced by the enrichment in δ13C (~1‰; equivalent to the second primary event of Casford et al. [2007]) and the increased numbers of E-index and G. bulloides abundances around 9.8 cal ka BP (Fig. 8c). The evidence of seasonality is further reinforced by the presence of G. bulloides and G. ruber f. alba, which are the main exponents of the seasonal contrasts governing planktonic foraminiferal assemblages in the Mediterranean Sea during the Holocene (Wilke et al., Reference Wilke, Meggers and Bickert2009; Wit et al., Reference Wit, Reichart, Jung and Kroon2010; Goudeau et al., Reference Goudeau, Reichart, Wit, de Nooijer, Grauel, Bernasconi and de Lange2015).
Sapropel S1 interval
Distinct fluctuations in the isotopic and faunal records of both cores indicate a remarkable climate and hydrographic variability during this interval. By 9.6 cal ka BP, S1 deposition commences, and it coincides with the abrupt increase of primary productivity (0.7 < E-index < 0.8, G. bulloides ~30%), the start of the overall δ13C depletion, the faunal shift to a dominance of mixed-layer species, and the dominance of AP over NAP (Figs. 6 and 8). Steadily low (stabilized around zero) δ18Ο values, together with high PPC values, reflect a climatic invasion toward high temperatures, with the only exception of three events (obtained around 9.5–9.1, 8.2–7.9, and 7.1–7.0 cal ka BP), where lower PPC and heavier δ18Ο values reflect lower SSTs during the early–middle Holocene (Greenlandian–Northgrippian stages) (Fig. 9a and b). These short-term cooling events are also reflected in significant faunal changes in the north Aegean Sea, such as the increase in abundance of G. bulloides and T. quinqueloba replacing the SPRUDTS group. Immediately after these events, faunal abundance and isotopic profiles return rapidly to their previous enhanced levels, and a gradual increase can be observed for PPC values (Fig. 9a and b).
The warm/humid conditions because of the monsoon intensification (Rossignol-Strick, Reference Rossignol-Strick1985) enhanced riverine inputs and resulted in low salinity and eutrophic waters, as these are documented by the elevated percentages of T. quinqueloba, especially between 8.2 and 7.5 cal ka BP. This is further supported by the contribution of Black Sea outflow after 8.0 cal ka BP (Sperling et al., Reference Sperling, Schmiedl, Hemleben, Emeis, Erlenkeuser and Grootes2003; Ehrmann et al., Reference Ehrmann, Schmiedl, Hamann, Kuhnt, Hemleben and Siebel2007). Moreover, the δ13C signatures reveal that the rainfall was more intense during that time, while the G. bulloides abundance records (Fig. 8c) show that the freshening of sea-surface waters was greater toward 7.0 cal ka BP. The reduction in NAP and the simultaneous increase in arboreal trees at 7.7 to 6.9 cal ka BP suggest higher humidity, which is in accordance with the pollen-based climatic models (Kotthoff et al., Reference Kotthoff, Müller, Pross, Schmiedl, Lawson, van de Schootbrugge and Schulz2008a), exhibiting 50% higher precipitation than in the previous time interval.
From the faunal content of the oxidized part of S1, it seems that the bottom-water oxygenation has resumed earlier than the final ending of sapropelic conditions indicated by Ba concentration. Specifically, the occurrence of the deep mixing species G. inflata and N. pachyderma reflects the prevalence of homogenization/overturn conditions in the water column (Rohling et al., Reference Rohling, Jorissen and De Stigter1997; Casford et al., Reference Casford, Rohling, Abu-Zied, Cooke, Fontanier, Leng and Lykousis2002). The subsequent regime is also characterized by the slightly colder and less eutrophic conditions, as evidenced by the PPC drop and the relatively lower E-index values (Figs. 8b and 9a). During this interval (7.0–6.1 cal ka BP), the presence of the bathypelagic Clio pyramidata, C. cuspidata, and Peracle spp. suggest the recovery of the thermohaline circulation. In addition, a reduction in AP and an increase in NAP along with a slight retreat in cool temperate summergreen vegetation characterize the termination of the S1. The dinocyst species P. zoharyi, I. aculeatum, and I. sphaericum present an abrupt disappearance in this interval, whereas an increase in abundance of L. machaerophorum, O. centrocarpum, Brigantedinium simplex, and Spiniferites sp. is observed (Fig. 7). Toward the Meghalayan, warm oligotrophic species (G. ruber alba, G. sacculifer, G. rubescens, and G. siphonifera gr.) prevail in the planktonic fauna, implying a significant reduction in primary productivity and the establishment of modern oligotrophic to mesotrophic conditions.
Late Holocene (Meghalayan stage) interval
Climatic and oceanographic boundary conditions of the north Aegean Sea change in the late Holocene. The main change is characterized by a decrease in G. sacculifer and O. universa (Fig. 3) that reveals a river-runoff reduction and further coincides with the δ13C enrichment trend (Fig. 8a) observed in both cores. This is further associated with clay mineral data known from the literature (Roussakis et al., Reference Roussakis, Karageorgis, Conispoliatis and Lykousis2004; Ehrmann et al., Reference Ehrmann, Schmiedl, Hamann, Kuhnt, Hemleben and Siebel2007) across this interval, which indicate a change in weathering conditions on land that points to particularly dry conditions in the north Aegean catchment. Moreover, the reduction in the surface water Black Sea outflow at around 4.5 cal ka BP (Sperling et al., Reference Sperling, Schmiedl, Hemleben, Emeis, Erlenkeuser and Grootes2003; Kuhnt et al., Reference Kuhnt, Schmiedl, Ehrmann, Hamann and Hemleben2007) has probably caused an increase in sea-surface salinity, which is also testified by the slightly heavier (up to 0.8‰ enrichment) planktic δ18O record (Fig. 9b), the reduction in the relative abundance of L. trochiformis, and the appearance of the stenohaline species S. subula at 3.3 cal ka BP (Fig. 4) (Buccheri et al., Reference Buccheri, Carpetto, Di Donato, Esposito, Feruzza, Pescatore and Russo Ermolli2002). These observations support the idea of a general trend to climatic aridification during the Meghalayan stage, which is in accordance with the salinity increase and oligotrophic nature of the water column of the modern north Aegean Sea.
Holocene climate variability and its relationship to large-scale climatic changes
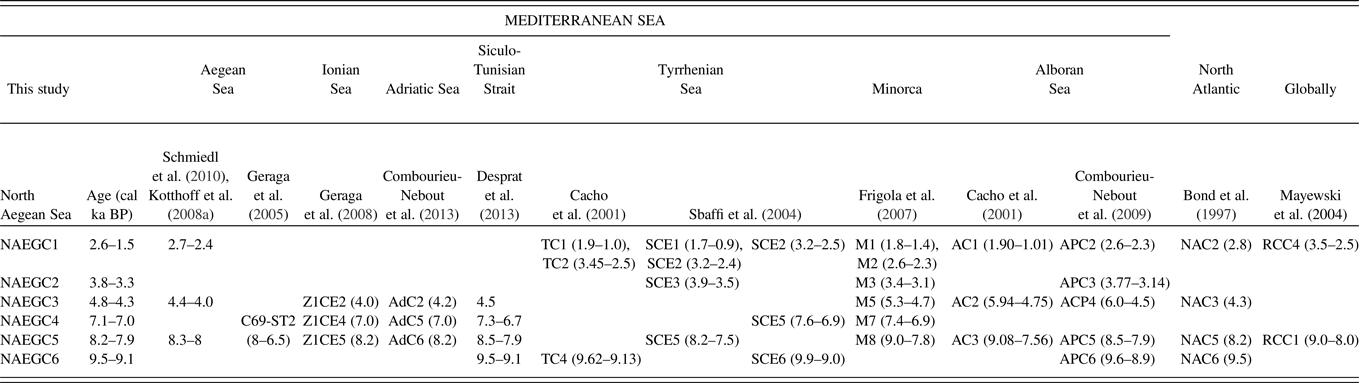
Our qualitative SST reconstructions for the north Aegean Sea reveal a distinct pattern of climate oscillations that generally agrees with the previously reported series of millennial-scale fluctuations in the region (Rohling et al., Reference Rohling, Mayewski, Abu-Zied, Casford and Hayes2002; Kotthoff et al., Reference Kotthoff, Müller, Pross, Schmiedl, Lawson, van de Schootbrugge and Schulz2008a, Reference Kotthoff, Pross, Müller, Peyron, Schmiedl, Schulz and Bordon2008b; Kontakiotis, Reference Kontakiotis.2016), but which enriches that picture with centennial-scale details. The Holocene climatic instability of the study area is further supported by episodes of brief cooling, with the suggested mechanism that caused the development of these cooling spells to involve local features, such as intensified orographically channeled, northerly air outbreaks and/or land-sea contrasts (Rohling et al., Reference Rohling, Mayewski, Abu-Zied, Casford and Hayes2002; Brayshaw et al., Reference Brayshaw, Rambeau and Smith2011). Six distinct sea-surface cooling events in the north Aegean Sea (referred to as “NAEGC”) have been identified in the present study (Fig. 9), corresponding to similar short and abrupt cold/dry events that have been described in different basins in the Mediterranean (Cacho et al., Reference Cacho, Grimalt, Canals, Sbaffi, Shackleton, Schönfeld and Zahn2001; Sbaffi et al., Reference Sbaffi, Wezel, Curzi and Zoppi2004; Geraga et al., Reference Geraga, Mylona, Tsaila-Monopoli, Papatheodorou and Ferentinos2008; Frigola et al., Reference Frigola, Moreno, Cacho, Sierro, Flores, Grimalt, Hodell and Curtis2007; Combourieu-Nebout et al., Reference Combourieu-Nebout, Peyron, Dormoy, Desprat, Beaudouin, Kotthoff and Marret2009, 2013; Schmiedl et al., Reference Schmiedl, Kuhnt, Ehrmann, Emeis, Hamann, Kotthoff, Dulski and Pross2010; Desprat et al., Reference Desprat, Combourieu-Nebout, Essallami, Sicre, Dormoy, Peyron, Siani, Bout Roumazeilles and Turon2013; Table 1). Furthermore, similarities to the GISP2 ice core, and their coincidence with times of reduced monsoonal rainfall, lowering of lake levels in eastern Africa (Gasse, Reference Gasse2000), and glacier advances in Europe (Denton and Karlen, Reference Denton and Karlen1973), suggest correlations with the paleoclimatic changes occurring at high latitudes of the northern Atlantic and worldwide (Bond et al., Reference Bond, Showers, Cheseby, Lotti, Almasi, DeMenocal, Priore, Cullen, Hajdas and Bonani1997, Reference Bond, Kromer, Beer, Muscheler, Evans, Showers, Hoffmann, Lotti-Bond, Hajdas and Bonani2001; Mayewski et al., Reference Mayewski, Rohling, Stager, Karlen, Maasch, Meeker and Meyerson2004; Wanner et al., Reference Wanner, Solomina, Grosjean, Ritz and Jetel2011, Reference Wanner, Mercolli, Grosjean and Ritz2014). These correlations reinforce earlier observations of teleconnections between Holocene climate variability of the (sub)tropics and the high latitudes at multicentennial to millennial timescales (Rohling et al., Reference Rohling, Mayewski, Abu-Zied, Casford and Hayes2002; Marino et al., Reference Marino, Rohling, Sangiorgi, Hayes, Casford, Lotter, Kucera and Brinkhuis2009). Each cooling event results in an approximate drop in temperature of 2–4°C, independently confirming what previous studies, using different methods, have shown (Rohling et al., Reference Rohling, Jorissen and De Stigter1997, Reference Rohling, Mayewski, Abu-Zied, Casford and Hayes2002; Cacho et al., Reference Cacho, Grimalt, Canals, Sbaffi, Shackleton, Schönfeld and Zahn2001).
List of short Holocene cooling events recorded in the North Aegean Sea and their correspondence to the relevant dry/cooling events in different basins (Alboran Sea, Balearic Sea, Tyrrhenian Sea, Siculo-Tunisian Strait, Adriatic Sea, Ionian Sea, and Aegean Sea) of the Mediterranean Sea, in the North Atlantic, and globally. Names of each event were provided followed by ages in brackets (in cal ka BP). In cases where the events are not named, only ages are given.

Impact of abrupt centennial-scale Holocene cooling events on eastern Mediterranean hydrologic regime
The most pronounced Holocene abrupt cooling events (NAEGC6–NAEGC4) occurred at 9.5–9.1, 8.2–7.9, and 7.1–7.0 cal ka BP. They punctuate the wettest phase as deduced by our pollen records during the Greenlandian–Northgrippian stages, and they seem to exert important control on sapropel deposition within the Mediterranean Sea. All these events parallel the widely documented abrupt coolings punctuating the early–middle Holocene: the “Boreal Oscillation” at ~10.0 cal ka BP (Björck et al., Reference Björck, Muscheler, Kromer, Andresen, Heinemeier, Johnsen, Conley, Koç, Spurk and Veski2001); the “9.3 ka event” (Rasmussen et al., Reference Rasmussen, Vinther, Clausen and Andersen2007); the “8.2-event” (Alley et al., Reference Alley, Mayewski, Sowers, Stuiver, Taylor and Clarck1997); and a final event at ~7.4 cal ka BP (Bond et al., Reference Bond, Kromer, Beer, Muscheler, Evans, Showers, Hoffmann, Lotti-Bond, Hajdas and Bonani2001), which likely corresponds to the drier episode detected at ~7.0 cal ka BP (Fig. 6). These events were related to a series of recurrent (dry) atmospheric climatic anomalies, which can be furthermore associated with meltwater pulse perturbation of the north Atlantic climate. In particular, there are two sharp negative peaks in the PPC at 9.6 and 9.1 cal ka BP, coupled with two intervening δ18O positive excursions (at ~9.3 and 9.2 cal ka BP), which are superimposed on a broader period of climatic deterioration in the Aegean Sea during this time interval. Cooling event NAEGC6 is coeval with relevant cooling events in Tyrrhenian basin centered at 9.5 cal ka BP (Rohling et al. Reference Rohling, Jorissen and De Stigter1997; Sbaffi et al., Reference Sbaffi, Wezel, Curzi and Zoppi2004) and further coincides with aridification events based on pollen assemblage changes in the Alboran Sea (Combourieu-Nebout et al., Reference Combourieu-Nebout, Peyron, Dormoy, Desprat, Beaudouin, Kotthoff and Marret2009) (Table 1). The forest decline (Fig. 6d) at this time is associated with a prominent SST cooling event in the eastern Norwegian Sea (Berner et al., Reference Berner, Koç and Godtliebsen2010) and coincides with cooling in the NGRIP (North Greenland Ice Core Project) record toward 9.95 cal ka BP, although this anomaly is not consistent across different Greenland records (Rasmussen et al., Reference Rasmussen, Vinther, Clausen and Andersen2007). NAEGC6 is possibly linked to an Atlantic meridional overturning circulation (AMOC) reduction because of a meltwater pulse at St. Lawrence Bay (Fleitmann et al., Reference Fleitmann, Mudelsee, Burns, Bradley, Kramers and Matter2008) or alternatively to contemporaneous outburst floods from proglacial lakes such as Lake Agassiz (Teller et al., Reference Teller, Leverington and Mann2002), Lake Labrador-Ungava (Jansson and Kleman, Reference Jansson and Kleman2004), Lake Superior (Yu et al., Reference Yu, Colman, Lowell, Milne, Fisher, Breckenridge, Boyd and Teller2010), or Baltic ice Lake in SW Sweden (Nesje et al., Reference Nesje, Dahl and Bakke2004), and with solar activity minima (Bond et al., Reference Bond, Kromer, Beer, Muscheler, Evans, Showers, Hoffmann, Lotti-Bond, Hajdas and Bonani2001; Magny and Bégeot, Reference Magny and Bégeot2004).
The following NAEGC5 event, constrained here by progressive δ18O enrichment to maximum values (+0.95‰) centered on 8.1 cal ka BP, corresponds to the regional expression of the 8.2 cal ka BP cold/arid north Atlantic event (Bond et al., Reference Bond, Showers, Cheseby, Lotti, Almasi, DeMenocal, Priore, Cullen, Hajdas and Bonani1997, Reference Bond, Kromer, Beer, Muscheler, Evans, Showers, Hoffmann, Lotti-Bond, Hajdas and Bonani2001). Surprisingly, that δ18O enrichment appears coeval in time but not in amplitude to the negative 2‰ δ18Oice event in the Greenland ice cores (Rasmussen et al., Reference Rasmussen, Vinther, Clausen and Andersen2007), which is thought to represent an ~6°C cooling of the air temperature over Greenland Summit (Alley et al., Reference Alley, Mayewski, Sowers, Stuiver, Taylor and Clarck1997). The significant decline in the PPC (from + 32% to −42%; Fig. 9a) also coincides well with pollen-based data (drop in deciduous trees; Fig. 6b and c) and provides evidence for an abrupt winter SST minimum on the northern Aegean borderlands in response to the 8.2 cal ka BP AMOC reduction (LeGrande et al., Reference LeGrande, Schmidt, Shindell, Field, Miller, Kocj, Faluvegi and Hoffmann2006; Wiersma and Renssen, Reference Wiersma and Renssen2006). The intensification of the atmospheric circulation (Marino et al., Reference Marino, Rohling, Sangiorgi, Hayes, Casford, Lotter, Kucera and Brinkhuis2009) during NAEGC5 led to good ventilation conditions in the Aegean basin interrupting the S1 deposition, synchronously with the termination of the formation of the enriched in organic matter layer (organic rich layer; Cacho et al., Reference Cacho, Grimalt and Canals2002) in the Alboran Sea (western Mediterranean).
The sharp drop in PPC around 7.0 cal ka BP corresponds to the NAEGC4 cooling event (Fig. 9). This event is attributed to the strengthening and increases in frequency of winter cooling, driven by changes in intensity of high-latitude continental air masses (Rohling et al., Reference Rohling, Mayewski, Abu-Zied, Casford and Hayes2002). The intensification of the atmospheric circulation during this time interval led to improved ventilation conditions in the eastern Mediterranean basin. We argue that this cooling event may have induced the resumption of deep-water formation in the north Aegean Sea. Indeed, density of the surficial waters was sufficiently high during that time interval to enable the ventilation of the deep north Aegean basin, because of the counterbalance between salinity depletion and SST decrease. This notion is also confirmed by the higher benthic δ13C (~1.1–1.4‰) values, the significant increase of the benthic foraminifera Cibicidoides (Kuhnt et al., Reference Kuhnt, Schmiedl, Ehrmann, Hamann and Hemleben2007; Abu-Zhied et al., Reference Abu-Zied, Rohling, Jorissen, Fontanier, Casford and Cooke2008; Schmiedl et al., Reference Schmiedl, Kuhnt, Ehrmann, Emeis, Hamann, Kotthoff, Dulski and Pross2010) and the planktonic G. inflata recorded in the studied and other cores between 7.0 and 6.0 cal ka BP (Casford et al., Reference Casford, Rohling, Abu-Zied, Cooke, Fontanier, Leng and Lykousis2002; Geraga et al., Reference Geraga, Ioakim, Lykousis, Tsaila Monopolis and Mylona2010; Kontakiotis, Reference Kontakiotis.2016), attesting the return to oxic conditions and the resumption of the north Aegean deep-water formation just after the end of S1. Similar short cooling events were detected using foraminiferal and pollen assemblages in the Minorca Basin (M7 event; Frigola et al., Reference Frigola, Moreno, Cacho, Sierro, Flores, Grimalt, Hodell and Curtis2007) and the Siculo-Tunisian Strait (at 7.3–6.7 cal ka BP; Desprat et al., Reference Desprat, Combourieu-Nebout, Essallami, Sicre, Dormoy, Peyron, Siani, Bout Roumazeilles and Turon2013) (Table 1). In the Adriatic and Aegean basins (AdC5 and C69-ST2 events, respectively) (Geraga et al., Reference Geraga, Tsaila-Monopolis, Ioakim, Papatheodorou and Ferentinos2005; Jimenez-Espejo et al., Reference Jimenez-Espejo, Martinez-Ruiz, Rogerson, González-Donoso, Romero, Linares and Sakamoto2008; Combourieu-Nebout et al., Reference Combourieu-Nebout, Peyron, Bout-Roumazeilles, Goring, Dormoy, Joannin, Sadori, Siani and Magny2013), these events are supposed to be responsible for sapropel termination. Following the interpretation of Rohling et al. (Reference Rohling, Mayewski, Abu-Zied, Casford and Hayes2002) and Casford et al. (Reference Casford, Rohling, Abu-Zied, Fontanier, Jorissen, Leng, Schmiedl and Thomson2003), the absence of these events in δ18OG. ruber was suggested to reflect a seasonal offset between climate forcing and the proxy carrier, as cooling is a winter phenomenon and therefore is not recorded by G. ruber, which thrives in the summer mixed layer.
At 6.3 cal ka BP, negative values in the PPC (–46%) of core AEX-23 are observed that are not followed by any enrichment in δ18OG. ruber in both cores or negative PPC values of AEX-15 (Fig. 9a and b). We suggest that the observed negative PPC peak is marked by increased T. quinqueloba percentages (59%; Fig. 3). A similar decrease in arboreal vegetation has also been observed during that time and possibly highlights the onset of the transition toward drier mid- to late Holocene.
The nature and intensity of the NAEGC3 event at 4.8–4.3 cal ka BP in our isotope record, resembling the previous events, also points to a climate origin and hence is thought to be the result of a cold and dry episode. The PPC drop of ~20% in both cores is in phase with concurrent expansion of NAP (Fig. 6f) and is associated with the 4.2 cal ka BP north Atlantic Holocene cold event (Bond et al., Reference Bond, Showers, Cheseby, Lotti, Almasi, DeMenocal, Priore, Cullen, Hajdas and Bonani1997, Reference Bond, Kromer, Beer, Muscheler, Evans, Showers, Hoffmann, Lotti-Bond, Hajdas and Bonani2001), as well as with Uk’37-SST minima along the Mediterranean Sea (Emeis et al., Reference Emeis, Struck, Schulz, Rosenberg, Bernasconi, Erlenkeuser, Sakamoto and Martinez-Ruiz2000, Reference Emeis, Struck, Blanz, Kohly and Woß2003; Cacho et al., Reference Cacho, Grimalt, Canals, Sbaffi, Shackleton, Schönfeld and Zahn2001) (Fig. 9). NAEGC3 could also correspond to the ACP4 of the Adriatic Sea (Combourieu-Nebout et al., Reference Combourieu-Nebout, Peyron, Dormoy, Desprat, Beaudouin, Kotthoff and Marret2009), M5 in Minorca Basin (Frigola et al., Reference Frigola, Moreno, Cacho, Sierro, Flores, Grimalt, Hodell and Curtis2007), the 4.5 cal ka BP event of the Siculo-Tunisian Strait (Desprat et al., Reference Desprat, Combourieu-Nebout, Essallami, Sicre, Dormoy, Peyron, Siani, Bout Roumazeilles and Turon2013), the Ionian and Levantine Seas (Emeis et al., Reference Emeis, Struck, Schulz, Rosenberg, Bernasconi, Erlenkeuser, Sakamoto and Martinez-Ruiz2000, Reference Emeis, Struck, Blanz, Kohly and Woß2003; Geraga et al., Reference Geraga, Mylona, Tsaila-Monopoli, Papatheodorou and Ferentinos2008), AdC3 in Adriatic Sea (Combourieu-Nebout et al., Reference Combourieu-Nebout, Peyron, Bout-Roumazeilles, Goring, Dormoy, Joannin, Sadori, Siani and Magny2013), and the 4–4.4 cal ka BP of the north Aegean Sea (Kotthoff et al., Reference Kotthoff, Müller, Pross, Schmiedl, Lawson, van de Schootbrugge and Schulz2008a; Schmiedl et al., Reference Schmiedl, Kuhnt, Ehrmann, Emeis, Hamann, Kotthoff, Dulski and Pross2010) (Table 1). This event is further evident on the northern side of the Mediterranean Basin (Magny et al., Reference Magny, Vannière, Zanchetta, Fouache, Touchais, Petrika, Coussot, Walter-Simonnet and Arnaud2009; Peyron et al., Reference Peyron, Goring, Dormoy, Kotthoff, Pross, de Beaulieu, Drescher-Schneider, Vannière and Magny2011), in the Medjerda Valley (Faust et al., Reference Faust, Zielhofer, Baena-Escudero and Diaz del Olmo2004; Zielhofer et al., Reference Zielhofer, Faust, Escudero, Diaz del Olmo, Kadereit, Moldenhauer and Porras2004), and in the speleothems of Gueldaman Cave (Ruan et al., Reference Ruan, Kherbouche, Genty, Blamart, Cheng, Dewilde, Hachi, Edwards, Régnier and Michelot2016). This cold episode, largely expressed in climate records as expanding from polar to tropical regions, has been attributed to a weakening of the Northern Hemisphere summer insolation (Bond et al., Reference Bond, Kromer, Beer, Muscheler, Evans, Showers, Hoffmann, Lotti-Bond, Hajdas and Bonani2001; Mayewski et al., Reference Mayewski, Rohling, Stager, Karlen, Maasch, Meeker and Meyerson2004). This cold and arid spell, although weakened in the north Aegean Sea (Kontakiotis, Reference Kontakiotis.2016), caused the temporary enhanced deep-water ventilation and consequently the restoration of oxic conditions in the north Aegean. This is further supported by the low accumulation rates of marine and terrestrial biomarkers and elevated δ15N values from nearby north Aegean cores (Gogou et al., Reference Gogou, Bouloubassi, Lykousis, Arnaboldi, Gaitani and Meyers2007), which indicate that the deep north Aegean was fully oxygenated during that period.
The interval between 3.8 and 3.3 cal ka BP comprises heavier δ18O values and a drop in the PPC of ~25% in both cores (Fig. 9a and b). This episode (NAEGC2) coincides with equivalent events in the Mediterranean Sea based on planktonic foraminifera and pollen assemblages (Sbaffi et al., Reference Sbaffi, Wezel, Curzi and Zoppi2004; Frigola et al., Reference Frigola, Moreno, Cacho, Sierro, Flores, Grimalt, Hodell and Curtis2007; Combourieu-Nebout et al., Reference Combourieu-Nebout, Peyron, Dormoy, Desprat, Beaudouin, Kotthoff and Marret2009) (Table 1). In the Tyrrhenian Sea, this event appears to be intense with an approximate decrease in SST of 2.5–3.5°C based on alkenone and the modern analogue technic SSTs reconstructions (Sbaffi et al., Reference Sbaffi, Wezel, Curzi and Zoppi2004). At 2.6–1.5 cal ka BP, heavier isotope values, significant drop in PPC, and abrupt deciduous forest reduction have been documented in our cores corresponding to NAEGC1 event (Fig. 9). This is correlated with the dry episode recorded from marine cores in the eastern Mediterranean between 3.0 and 1.7 cal ka BP (Magny et al., Reference Magny, Bégeot, Guiot and Peyron2003; Jalut et al., Reference Jalut, Dedoubat, Fontugne and Otto2009). It is also evident in the western and central part of the Mediterranean between 3.2 and 1.4 cal ka BP (Cacho et al., Reference Cacho, Grimalt, Canals, Sbaffi, Shackleton, Schönfeld and Zahn2001; Sbaffi et al., Reference Sbaffi, Wezel, Curzi and Zoppi2004; Frigola et al., Reference Frigola, Moreno, Cacho, Sierro, Flores, Grimalt, Hodell and Curtis2007; Combourieu-Nebout et al., Reference Combourieu-Nebout, Peyron, Dormoy, Desprat, Beaudouin, Kotthoff and Marret2009) and is correlated to the NAC2 event (Bond et al., Reference Bond, Showers, Cheseby, Lotti, Almasi, DeMenocal, Priore, Cullen, Hajdas and Bonani1997) (Table 1).
CONCLUSIONS
A multidisciplinary study of the sediments of cores AEX-15 and AEX-23 from the North Aegean Trough enables the understanding of long- and short-term oceanographic and climatic variations of the last ~10 cal ka BP in the north Aegean Sea. The interpretations are based on the down-core variations of the stable isotope (δ18O, δ13C) values and the abundances of planktonic foraminiferal, pteropod, and palynomorph assemblages, in association with temperature- and productivity-related paleoceanographic data. Overall, the high sedimentation rates encountered in the analyzed cores and the high-resolution sampling have contributed to the detection of six cold/arid events throughout the Holocene, as well as the preservation of their processes and mechanisms. Although absolute age control provides only modest constraint, these events also appear to correlate with equivalent events documented within and beyond the Mediterranean Sea in north latitude areas, northeastern Africa, and the Middle East, pointing to large, hemispheric-scale teleconnections.
ACKNOWLEDGMENTS
This work was supported by the National Strategic Development Program EE (NSRF 2007–2013) and was carried out in the frame of the “YPOTHER” project realized at the Institute of Geology and Mineral Exploration in collaboration with the Institute of Oceanography of the Hellenic Centre for Marine Research (HCMR). We wish to thank the captain and crew of R/V Aegaeo (HCMR) for their technical assistance during the YPOTHER cruises, and Mrs. A. Androni (HCMR) for the organic carbon analysis. Constructive comments by two anonymous reviewers have been essential in improving this manuscript and Dr. Louisa Bradtmiller (associate editor) is thanked for her editorial handling.