





Introduction
Alfalfa is one of the most important perennial legumes in livestock production because it provides high-quality forage (Harling et al. Reference Harling, Sollenberger, Rios, Dubeux and Wallau2022). It is widely planted in the United States (6.7 million ha) with Wisconsin having the most area planted of any U.S. state (105,000 ha) (USDA-NASS 2025). This crop is commonly planted in rotation with corn. Including alfalfa in rotation with corn has many benefits, including higher corn yields (Riedell and Osborne Reference Riedell and Osborne2017), reduced nitrogen fertilization requirements (Peng et al. Reference Peng, Zhang, Han, Li, Zhang, Cao and Chen2024), reduced soil erosion (Wu et al. Reference Wu, Wu, Feng and Merkley2011), fewer greenhouse gas emissions (Osterholz et al. Reference Osterholz, Kucharik, Hedtcke and Posner2014), and reduced pest pressure (Clay and Aguilar Reference Clay and Aguilar1998). Due to these factors, this crop rotation is widely used throughout the midwestern United States (Hesterman et al. Reference Hesterman, Sheaffer and Fuller1986).
One challenge in this crop rotation is the selection of herbicides for use on corn that will not persist and injure alfalfa planted the following year. Herbicides are used on 96% of the corn area planted in the United States with at least 65% receiving a residual herbicide (USDA-NASS 2021). These herbicides can persist in the soil for months to years and have the potential to cause injury to alfalfa planted the following year. While herbicide labels provide recommendations on how long to wait to plant alfalfa following application, they can be complicated to follow because they may vary based on application rating, timing, and environmental (e.g., precipitation) and physical (e.g., soil organic matter) factors (Colquhoun Reference Colquhoun2006). Efforts to educate farmers of these restrictions have been ongoing (Colquhoun Reference Colquhoun2006); however, reports of injury are increasing in the upper midwestern United States (Bechman Reference Bechman2024).
While atrazine has been studied (Kells et al. Reference Kells, Leep, Tesar, Leavitt and Cudnohufsky1990) and used for the last 60 yr, other residual active ingredients are now being used on corn crops that have the potential to injure alfalfa the following year. These include clopyralid (CLOP, used on 18% of corn acreage grown in the United States), acetochlor (ACET, used on 34%), flumetsulam (FLUM, used on 7%), and mesotrione (MESO, used on 47% of corn acreage grown in the United States) (USDA-NASS 2025). These products are often mixed and applied later in the season to control herbicide-resistant plants such as waterhemp [Amaranthus tuberculatus (Moq.) J.D. Saur], which is becoming increasingly difficult to control (Faleco et al. Reference Faleco, Oliveira, Arneson, Renz, Stoltenberg and Werle2022). This later timing of application reduces the time for herbicides to break down in the soil prior to planting alfalfa. While plant-back restrictions for products that contain these active ingredients range from spring of the following year to 1 yr after application, the label on the premixed product lists restrictions associated with rain, soil organic matter content, and time of application, and suggest that injury may occur to alfalfa planted the following spring (Corteva 2023, 2024). We are not aware of any published research on the impacts of these active ingredients on alfalfa, but injury has been documented after corn (O’Sullivan et al. Reference O’Sullivan, Thomas and Bouw1999) and other crops (Simarmata et al. Reference Simarmata, Harsono and Hartal2018) have been planted.
To overcome this lack of knowledge, we established field trials in southern Wisconsin to evaluate common residual herbicides used on corn crops. We evaluated whether these herbicides would affect alfalfa establishment and resulting productivity in the fall or the following spring after application. Because residual premixed herbicides with multiple active ingredients are commonly applied to corn, we evaluated two different premixed products (CLOP + MESO + ACET and CLOP + MESO + FLUM) along with each active ingredient that constitutes the premix separately. We hypothesized that alfalfa density and aboveground and belowground biomass would be reduced when planted in fall and spring by these mixtures with clopyralid as the active ingredient that causes the injury.
Materials and Methods
The experiment was conducted at the University of Wisconsin-Madison research stations near Arlington (ARS) (43.17517°N, 89.21013°W) and Lancaster (LARS) (42.49298°N, 90.47329°W), from June 2023 through September 2024 and repeated the following year at both locations. ARS contains a Plano silt loam soil (fine-silty, mixed, superactive, mesic, typic Argiudoll, pH 6.3, and with 3.4 % organic matter), and LARS is composed of a New Glarus silt loam (fine-silty over clayey, mixed, superactive, mesic typic Hapludalfs, pH 6.9, and with 2.7 % organic matter).
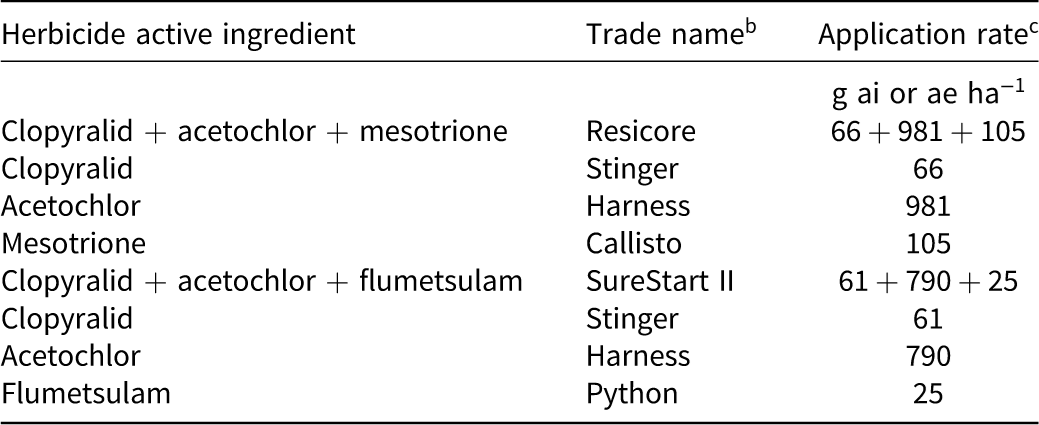
The experimental design was a randomized complete block with four replications at each location. The experiment compared the effects of two residual herbicides applied to corn silage that contain multiple active ingredients that may affect alfalfa when planted after corn harvest. We compared CLOP (66 g ae ha−1) + ACET (981 g ai ha−1) + MESO (105 g ai ha−1) and CLOP (61 g ae ha−1) + ACET (790 g ai ha−1) + FLUM (25 g ai ha−1). We were also interested in the effect that each component had on alfalfa, so each active ingredient and rate were also evaluated as separate treatments. This resulted in nine treatments, including a nontreated control (NTC) (Table 1A). Herbicides were delivered to plots 3 m wide by 7.6 m long using a CO2-pressurized backpack sprayer equipped with a 3-m-wide handheld boom fitted with six nozzles spaced 50.8 cm apart (TT11004; TeeJet, Glendale Heights, IL) at 140 L ha−1. In the first year of the experiment, treatments were applied on June 9, 2023, at each location when the corn was at the V4 growth stage. The corn (grown for silage) was no-till planted on May 5, 2023, at both locations at a planting density of 88,960 seed ha−1 at ARS and 85,746 seed ha−1 at LARS. When the experiments were repeated in 2024, treatments were applied on June 8, 2024, at ARS and June 14th at LARS, at the same corn growth stage and corn stand density as the previous year. The corn (grown for silage) was no-till planted on May 4, 2024, at ARS and May 10, 2024. Both locations, both years were managed according to University of Wisconsin Extension Recommendations (Corn Agronomy 2025) and harvested in mid-September at both locations in both years.
Herbicides used in the experiments. a

Table 1. Long description
The table presents data on herbicide active ingredients, their trade names, and application rates. It has three columns: Herbicide active ingredient, Trade name, and Application rate. The table contains nine rows, each representing a different herbicide treatment or combination. Row 1: Clopyralid + acetochlor + mesotrione, Resicore, 66 + 981 + 105. Row 2: Clopyralid, Stinger, 66. Row 3: Acetochlor, Harness, 981. Row 4: Mesotrione, Callisto, 105. Row 5: Clopyralid + acetochlor + flumetsulam, SureStart II, 61 + 790 + 25. Row 6: Clopyralid, Stinger, 61. Row 7: Acetochlor, Harness, 790. Row 8: Flumetsulam, Python, 25. Row 9: Nontreated control (NTC), NTC, 0. The application rates are given in grams of active ingredient (g ai) or acid equivalent (g ae) per hectare (ha).
a Experiments were carried out at two University of Wisconsin-Madison research farms in 2023.
b Herbicide manufacturers: Resicore, Stinger, and SureStart II are manufactured by Corteva Agriscience, Indianapolis, IN; Harness is manufactured by Bayer CropScience, St. Louis, MO; and Python is manufactured by AMVAC Chemical Corporation, Newport Beach, CA.
c The CLOP rate is g ae ha−1; the other herbicides are measured in g ai ha−1.
Greenhouse Bioassay
Treated soil was harvested in the 2023 experiments at each location following the methodology described by Severo Silva et al. (Reference Severo Silva, Arneson, Silva and Werle2023) on November 21 and 20, 2023, at ARS and LARS, respectively. These dates were just prior to temperatures that typically freeze the soil at both locations. Treated soil was collected using a bulb transplanter (5.7 cm wide by 10.1 cm long; Fiskars, Middleton, WI) in four random locations within the middle of each interrow, avoiding the 1.5-m edge of each plot. Sampling tools were washed between each plot with water and then cleaned with paper towels. The soil was immediately placed in a plastic bag (∼1,000 g), stored in a cooler, then transferred to a freezer (set to −20 C), where samples were stored for approximately 2 mo.
The samples were used to conduct a greenhouse bioassay between January and March of 2024, at the University of Wisconsin-Madison D.C. Smith Greenhouse (43.04302°N, 89.24453°W). The soil samples from each treatment were thawed for 2 d, sieved to remove roots and other large pieces of organic matter, then combined across replications to create one sample for each treatment at each location. Soil from each of these samples was then put into 30 16-cm by 2.5-cm “cone-tainers” (Stuewe & Sons, Inc., Tangent, OR) for each treatment. One of three commercial alfalfa cultivars (Cultivar 1, AFX 460; Alforex, Albany, OR), (Cultivar 2, 54VR12; Pioneer, Johnston, IA), and (Cultivar 3, SpringPearl; Renk, Sun Prairie, WI), were then planted into 10 cone-tainers for each treatment, planted on January 24, 2024. This resulted in 270 experimental units (9 treatments × 3 cultivars × 10 replications) for each location. All cone-tainers for each treatment and cultivar were randomly assigned a location in the greenhouse, resulting in a completely randomized design with two factors. The plants were grown inside the greenhouse environment for 50 d. Greenhouse average temperature was 24 C during the day and 21 C during the night, with 16 h of supplemental light powered by high-pressure sodium lamps, turned on when natural levels were below 200 W m−2. Plants were watered from the surface as needed to keep soil saturated during the first week after planting. Initially, three seeds were planted per cone and then, after emergence, plants were thinned to one per cone-tainer. After thinning, cone-tainers were watered every day from the soil surface with a dilute concentration of macronutrients using a 20-10-20 fertilizer (ICL Fertilizers, Tel Aviv, Israel), containing 500 ppm of nitrogen and potassium, respectively, and 250 ppm of phosphorus.
After 50 d after planting, alfalfa shoots for each cone-tainer were clipped at the soil surface. The soil was removed from the roots of containers by gentle washing in a water bath. Afterward, both biomass samples for each cone-tainer were placed in separate bags, oven-dried at 65 C to constant mass, and then weighed.
All data were analyzed using R statistical software (v. 4.3.1; R Core Team, 2025). A linear mixed model using the lme4 package (Bates et al. Reference Bates, Maechler, Bolker and Walker2015) was used to analyze the response variables. Model assumptions of normality and homoscedasticity were assessed by a visual examination of residuals and found to meet the assumptions. Initially, treatment, cultivar, location, and their interaction were considered fixed effects, while the plant was a random effect. We detected significant interactions between locations and treatments for all response variables (P < 0.05); therefore, each location was analyzed separately with cultivar, treatment, and interactions as fixed effects. With this model, we found several instances when the response variable had a significant interaction between treatment and cultivar (P < 0.05). When this occurred, we analyzed each cultivar independently with treatment as the sole fixed effect.
Contrasts were performed on specific treatment combinations to investigate which active ingredient(s) would affect biomass. The first contrast compared the NTC to CLOP treatments (61 ae ha−1 and 66 ae ha−1). The second and third contrasts focused on the NTC against each commercial premix, CLOP (66 ae ha−1) + ACET (981 ai ha−1) + MESO (105 ai ha−1) and CLOP (66 ae ha−1) + ACET (981 ai ha−1) + FLUM (25 ai ha−1). The remaining contrasts compared the NTC to individual active ingredients contained within each premix, and these included MESO (105 ai ha−1), ACET (981 ai ha−1 + 790 ai ha−1), and FLUM (25 ai ha−1). Each contrast was performed using a t-test, and the resulting P-value was adjusted using Bonferroni correction (Bonferroni Reference Bonferroni1936). Contrasts were considered different if the adjusted P-value was < 0.05.
Field Bioassay
In addition to the greenhouse bioassay, we evaluated the effect of applications to alfalfa planted in the field the following spring. In 2024 alfalfa Cultivar 2 was planted on April 22, 2024, and May 5, 2024, in the fields treated in 2023 at ARS and LARS, respectively. This was repeated in 2025 in fields treated in 2024 with the same alfalfa Cultivar 2 planted on April 28 at LARS and April 24 at ARS. At both locations and in both years, alfalfa was no-till–drilled into the field with rows spaced 19.05 cm apart at a seeding rate of 20.2 kg pure live seed ha−1. The experiment design, replication, and plot sizes remained the same (randomized complete block design with four replications) as alfalfa was planted directly into the same fields treated in 2023 or 2024. Alfalfa at ARS was sprayed on 2024 and 2025 with Lambda T-2 (Helena Agri-enterprises, LLC) to mitigate the damage from potato leafhoppers (Empoasca fabae) and 2,802 g ha−1 of glyphosate (Roundup PowerMAX; Bayer, St. Louis, MO) was applied for weed control at both locations and years.
Stand counts were assessed 45 d after planting at both locations and years. Alfalfa plants were counted by randomly selecting four locations in each plot and counting the number of plants within a row for 1 m for each plot. Counts were averaged across all four areas and converted into alfalfa plant density per square meter. Aboveground biomass was harvested once at each location: June 26, 2024, at ARS; July 10, 2024, at LARS; July 11, 2025, at ARS; and July 8, at LARS. For each sampling event two 0.5-m2 quadrats were randomly located within each plot (avoiding the borders), and shoots were clipped to 2.5 cm height. Shoot biomass was combined across both quadrats within a plot, placed in paper bags, oven-dried at 65 C to reach constant mass, and then weighed.
Biomass and stand density were analyzed using R statistical software (v. 4.3.1; R Core Team 2025), where a linear model utilizing the lme4 package (Bates et al. Reference Bates, Maechler, Bolker and Walker2015) was used. As interactions were previously found between locations and other factors with the greenhouse bioassay, each location and year were analyzed separately with treatment and block as fixed effects. Model assumptions of normality and homoscedasticity were assessed by a visual examination of residuals, and it was found to meet the assumptions.
Results and Discussion
Weather Conditions
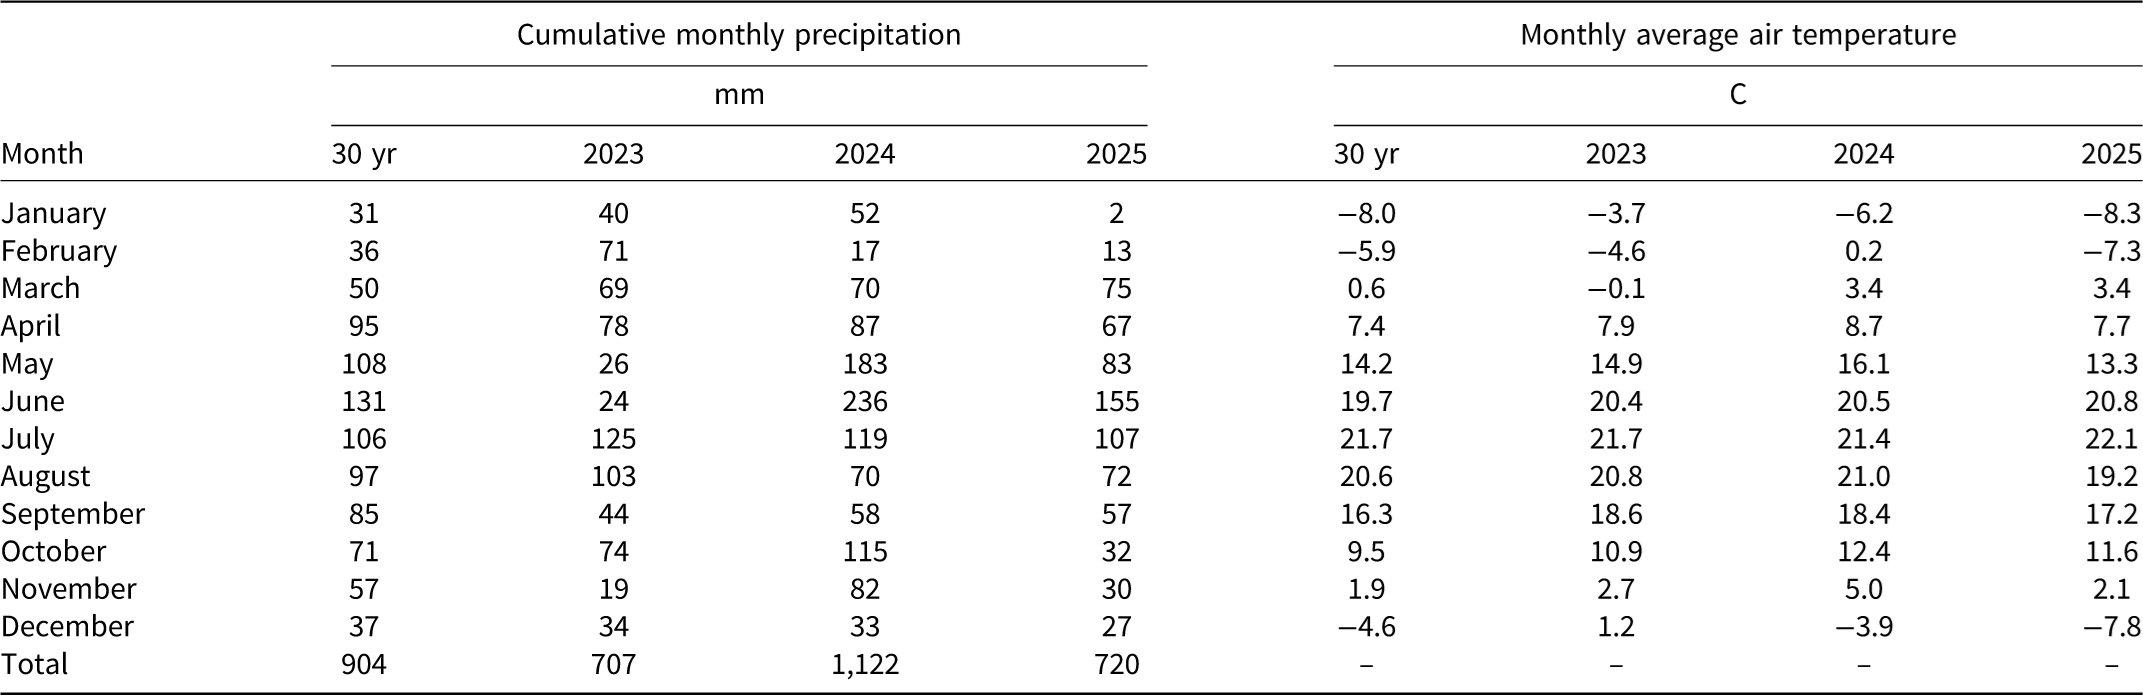
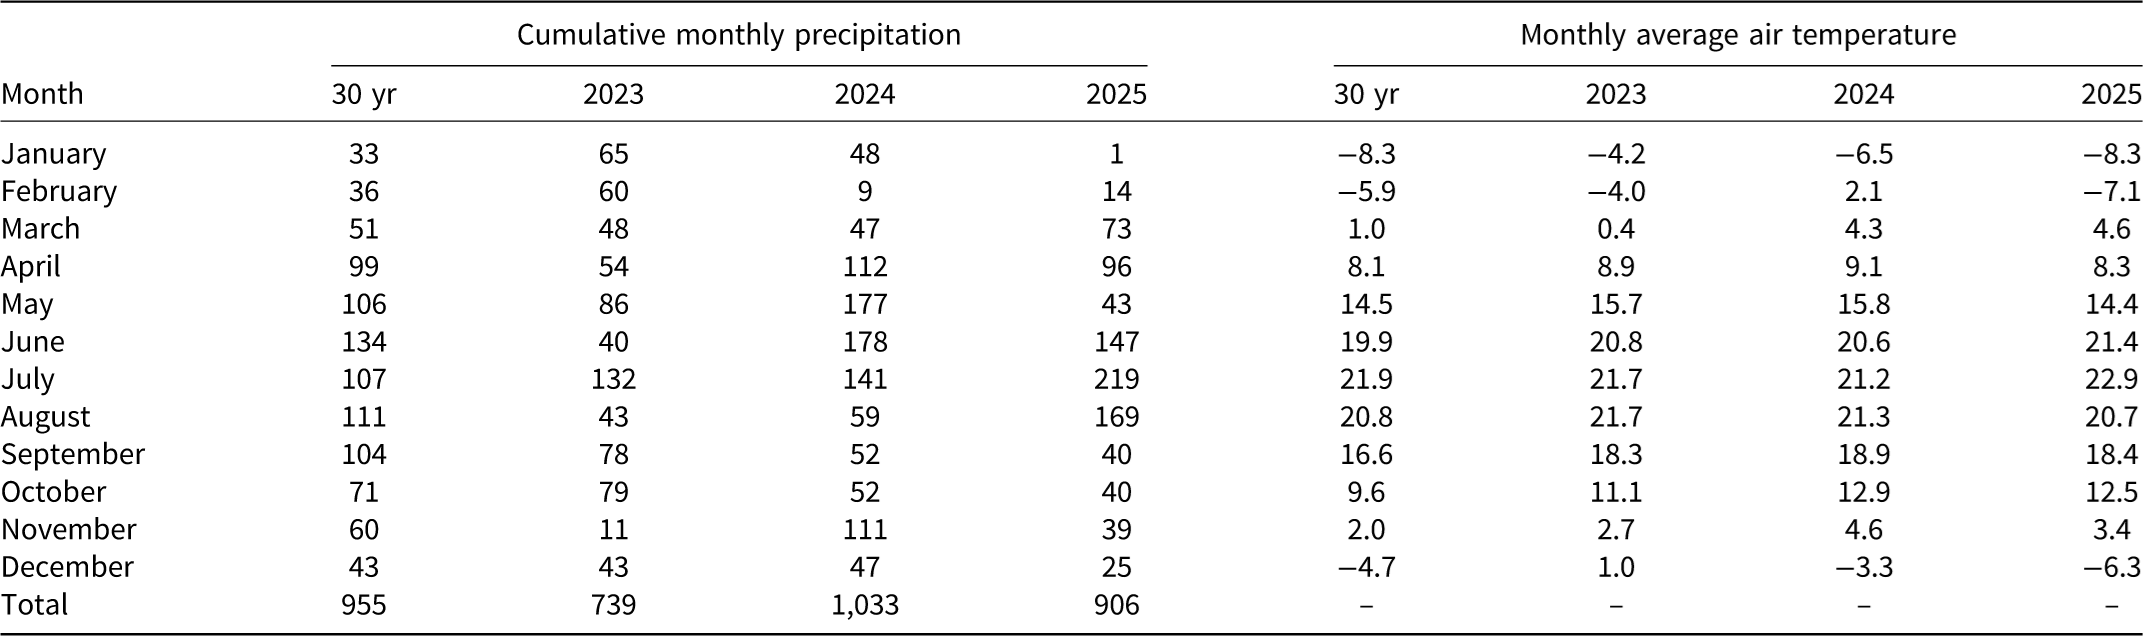
During 2023, Wisconsin experienced a drought during the summer months (April, May, and June) with deficits at each location ranging from 18% to 82% compared with the 30-yr average (Tables 2 and 3). In contrast, both locations received excess precipitation in 2024, with May and June totals exceeding the 30-yr averages by 30% to 80%. Air temperature in fall 2023 and winter 2024 was abnormally high, ranging from 1 C to 6 C higher than the 30-yr average at both locations; otherwise, temperature was within 10% of 30-yr averages. In 2025, air temperatures and precipitation generally followed the 30-yr average at both sites, aside from a notably dry winter and a few isolated summer rains.
Monthly precipitation and average air temperature from 2023 to 2025 and the 30-yr average for 1991 to 2020 in Arlington, Wisconsin.

Table 2. Long description
A table comparing monthly precipitation and average air temperature in Arlington, Wisconsin. The table has 13 rows and 8 columns. The columns are labeled as follows: Month, Cumulative monthly precipitation (mm) for the years 2023, 2024, and 2025, and Monthly average air temperature (C) for the years 2023, 2024, and 2025. The rows are labeled with the months from January to December, plus a Total row. Row 1: January, 40, 52, 2, -8.0, -3.7, -6.2. Row 2: February, 71, 17, 13, -5.9, -4.6, 0.2. Row 3: March, 69, 70, 75, 0.6, -0.1, 3.4. Row 4: April, 78, 87, 67, 7.4, 7.9, 7.7. Row 5: May, 26, 183, 83, 14.2, 14.9, 16.1. Row 6: June, 24, 236, 155, 19.7, 20.4, 20.5. Row 7: July, 125, 119, 107, 21.7, 21.7, 21.4. Row 8: August, 103, 70, 72, 20.6, 20.8, 21.0. Row 9: September, 44, 58, 57, 16.3, 18.6, 18.4. Row 10: October, 74, 115, 32, 9.5, 10.9, 12.4. Row 11: November, 19, 82, 30, 1.9, 2.7, 5.0. Row 12: December, 34, 33, 27, -4.6, 1.2, -3.9. Row 13: Total, 904, 707, 1122, -, -, -.
Monthly precipitation and average air temperature from 2023 to 2025 and the 30-yr average for 1991 to 2020 in Lancaster, Wisconsin.

Table 3. Long description
The table presents data on cumulative monthly precipitation and monthly average air temperature for the years 2023, 2024, and 2025, compared to a 30-year average from 1991 to 2020 in Lancaster, Wisconsin. The table has 13 rows and 8 columns. The columns are labeled as follows: Cumulative monthly precipitation for 30-year average, 2023, 2024, and 2025; Monthly average air temperature for 30-year average, 2023, 2024, and 2025. The rows are labeled by month, from January to December, with an additional row for the total. Row 1: January, 33, 65, 48, 1, -8.3, -4.2, -6.5, -8.3. Row 2: February, 36, 60, 9, 14, -5.9, -4.0, 2.1, -7.1. Row 3: March, 51, 48, 47, 73, 1.0, 0.4, 4.3, 4.6. Row 4: April, 99, 54, 112, 96, 8.1, 8.9, 9.1, 8.3. Row 5: May, 106, 86, 177, 43, 14.5, 15.7, 15.8, 14.4. Row 6: June, 134, 40, 178, 147, 19.9, 20.8, 20.6, 21.4. Row 7: July, 107, 132, 141, 219, 21.9, 21.7, 21.2, 22.9. Row 8: August, 111, 43, 59, 169, 20.8, 21.7, 21.3, 20.7. Row 9: September, 104, 78, 52, 40, 16.6, 18.3, 18.9, 18.4. Row 10: October, 71, 79, 52, 40, 9.6, 11.1, 12.9, 12.5. Row 11: November, 60, 11, 111, 39, 2.0, 2.7, 4.6, 3.4. Row 12: December, 43, 43, 47, 25, -4.7, 1.0, -3.3, -6.3. Row 13: Total, 955, 739, 1033, 906.
Greenhouse Bioassay from Fall Soil Samples
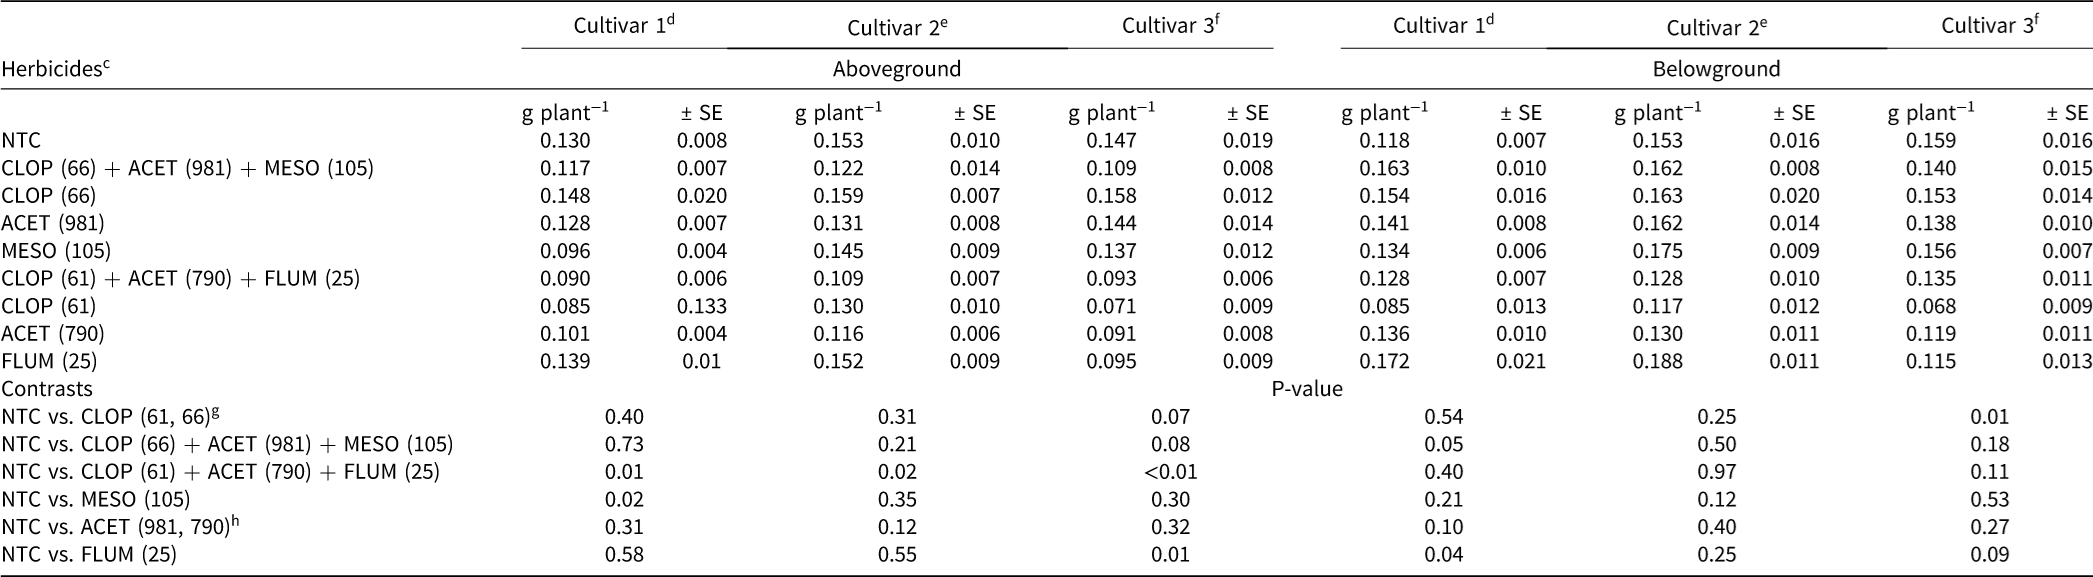
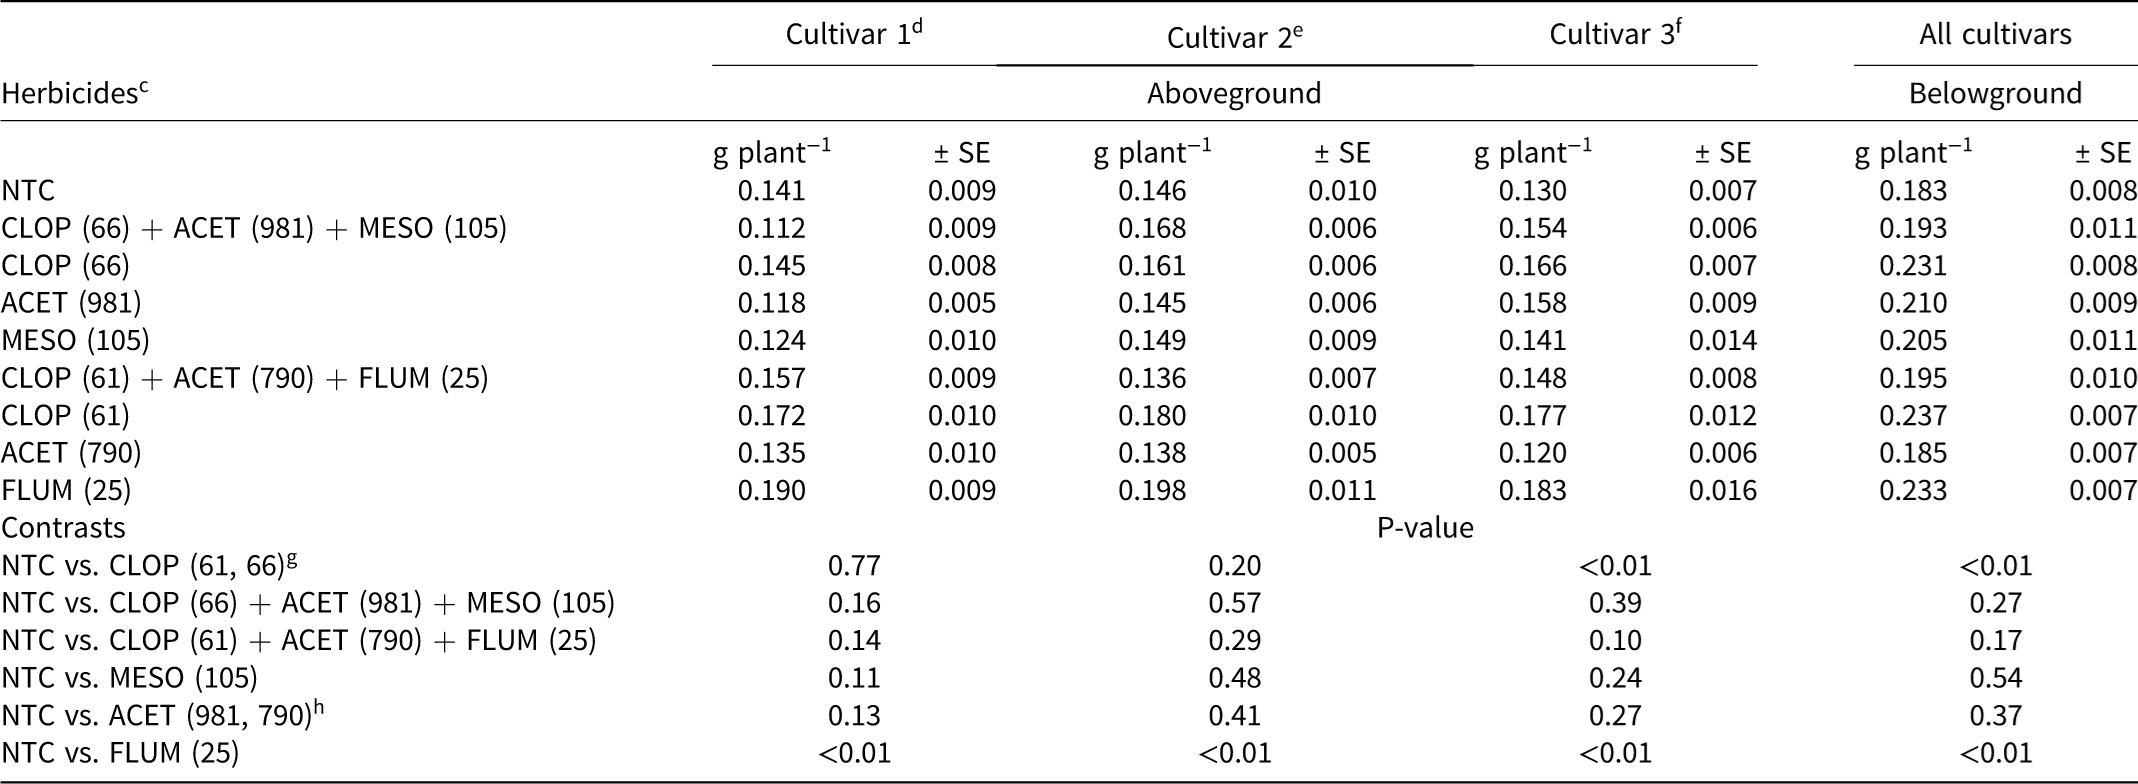
Cultivars differed in their responses to treatments for aboveground biomass for LARS (P = 0.04) and ARS (P = 0.01); therefore, they were analyzed separately. At LARS, the aboveground biomass of Cultivars 1, 2, and 3 was reduced by 31%, 29%, and 37%, respectively, when CLOP + ACET + FLUM was applied, while the cultivars had specific biomass reduction responses to MESO and FLUM. For example, the aboveground biomass of Cultivar 1 was reduced by 35% with FLUM, while a 26% reduction of Cultivar 3 was observed when MESO was applied. No other herbicide combination resulted in reduced aboveground biomass from fall-collected soil at LARS (Table 4). At ARL, all cultivars exhibited greater aboveground biomass (26% to 29%) after FLUM, but only Cultivar 3 exhibited a reduction (21%) after CLOP was applied. No differences were observed with ACET or mixes of residual herbicides (Table 5). Belowground biomass at LARS also responded differently to treatments among cultivars, with a 31% reduction in Cultivar 1 by FLUM and also a 31% reduction in Cultivar 3 by CLOP. At ARL, there was no interaction between cultivars, but a >20% increase in belowground biomass was observed after CLOP and FLUM applications across cultivars.
Influence of herbicide treatments on alfalfa aboveground and belowground biomass from soil collected on November 20, 2023, in Lancaster, Wisconsin. a,b

Table 4. Long description
A table comparing the influence of herbicide treatments on alfalfa aboveground and belowground biomass. The table has 12 columns and 15 rows, including headers and contrasts. Columns are grouped into aboveground and belowground biomass measurements for three cultivars. Row 1: Cultivar 1 Aboveground, Cultivar 2 Aboveground, Cultivar 3 Aboveground, Cultivar 1 Belowground, Cultivar 2 Belowground, Cultivar 3 Belowground. Row 2: NTC, 0.130 ± 0.008, 0.153 ± 0.010, 0.147 ± 0.019, 0.118 ± 0.007, 0.153 ± 0.016, 0.159 ± 0.016. Row 3: CLOP (66) + ACET (981) + MESO (105), 0.117 ± 0.007, 0.122 ± 0.014, 0.109 ± 0.008, 0.163 ± 0.010, 0.162 ± 0.008, 0.140 ± 0.015. Row 4: CLOP (66), 0.148 ± 0.020, 0.159 ± 0.007, 0.158 ± 0.012, 0.154 ± 0.016, 0.163 ± 0.020, 0.153 ± 0.014. Row 5: ACET (981), 0.128 ± 0.007, 0.131 ± 0.008, 0.144 ± 0.014, 0.141 ± 0.008, 0.162 ± 0.014, 0.138 ± 0.010. Row 6: MESO (105), 0.096 ± 0.004, 0.145 ± 0.009, 0.137 ± 0.012, 0.134 ± 0.006, 0.175 ± 0.009, 0.156 ± 0.007. Row 7: CLOP (61) + ACET (790) + FLUM (25), 0.090 ± 0.006, 0.109 ± 0.007, 0.093 ± 0.006, 0.128 ± 0.007, 0.128 ± 0.010, 0.135 ± 0.011. Row 8: CLOP (61), 0.085 ± 0.005, 0.130 ± 0.010, 0.071 ± 0.009, 0.085 ± 0.013, 0.117 ± 0.012, 0.068 ± 0.009. Row 9: ACET (790), 0.101 ± 0.004, 0.116 ± 0.006, 0.091 ± 0.008, 0.136 ± 0.010, 0.130 ± 0.011, 0.119 ± 0.011. Row 10: FLUM (25), 0.139 ± 0.01, 0.152 ± 0.009, 0.095 ± 0.009, 0.172 ± 0.021, 0.188 ± 0.011, 0.115 ± 0.013. Row 11: Contrasts, P-value,, , , , . Row 12: NTC vs. CLOP (61, 66), 0.40, 0.31, 0.54, 0.25, 0.01, . Row 13: NTC vs. CLOP (66) + ACET (981) + MESO (105), 0.73, 0.21, 0.08, 0.50, 0.18, . Row 14: NTC vs. CLOP (61) + ACET (790) + FLUM (25), 0.01, 0.02, <0.01, 0.40, 0.97, . Row 15: NTC vs. MESO (105), 0.02, 0.35, 0.30, 0.21, 0.12, .
a Abbreviations: ACET, acetochlor; CLOP, clopyralid; FLUM, flumetsulam; MESO, mesotrione; NTC, nontreated control.
b Three different alfalfa cultivars were evaluated, where 10 plants were grown for each treatment for 50 d (n = 270 experimental units). Contrasts were used to evaluate whether premixes or active ingredients within them changed the aboveground or belowground growth (α = 0.05).
c The rate of each treatment is listed in parentheses. The CLOP rate is g ae ha−1; the other herbicides are measured in g ai ha−1.
d Cultivar 1 is AFX 460, Alforex Seeds, a DLF brand, Albany, OR.
e Cultivar 2 is 54VR12, Pioneer, Johnston, IA.
f Cultivar 3 is SpringPearl, Renk Seed Company, Sun Prairie, WI.
g Treatments contained clopyralid only.
h Treatment contained acetochlor only.
Influence of herbicide treatments on alfalfa aboveground and belowground biomass from soil collected on November 21, 2023, in Arlington, Wisconsin. a,b

Table 5. Long description
The table presents data on the effects of various herbicide treatments on the aboveground and belowground biomass of three alfalfa cultivars. It includes measurements for each cultivar under different herbicide treatments, with values given in grams per plant (g plant⁻¹) and standard error (SE). The table is divided into sections for aboveground biomass of Cultivar 1, Cultivar 2, Cultivar 3, and belowground biomass for all cultivars. Each section lists the herbicide treatments and their corresponding biomass values. The table also includes P-values for various contrasts between treatments. Row 1: NTC, 0.141 ± 0.009, 0.146 ± 0.010, 0.130 ± 0.007, 0.183 ± 0.008. Row 2: CLOP (66) + ACET (981) + MESO (105), 0.112 ± 0.009, 0.168 ± 0.006, 0.154 ± 0.006, 0.193 ± 0.011. Row 3: CLOP (66), 0.145 ± 0.008, 0.161 ± 0.006, 0.166 ± 0.007, 0.231 ± 0.008. Row 4: ACET (981), 0.118 ± 0.005, 0.145 ± 0.006, 0.158 ± 0.009, 0.210 ± 0.009. Row 5: MESO (105), 0.124 ± 0.010, 0.149 ± 0.009, 0.141 ± 0.014, 0.205 ± 0.011. Row 6: CLOP (61) + ACET (790) + FLUM (25), 0.157 ± 0.009, 0.136 ± 0.007, 0.148 ± 0.008, 0.195 ± 0.010. Row 7: CLOP (61), 0.172 ± 0.010, 0.180 ± 0.010, 0.177 ± 0.012, 0.237 ± 0.007. Row 8: ACET (790), 0.135 ± 0.010, 0.138 ± 0.005, 0.120 ± 0.006, 0.185 ± 0.007. Row 9: FLUM (25), 0.190 ± 0.009, 0.198 ± 0.011, 0.183 ± 0.016, 0.233 ± 0.007. Row 10: P-value, 0.77, <0.01, <0.01, <0.01. Row 11: NTC vs. CLOP (61, 66), 0.16, 0.20, 0.39, 0.27. Row 12: NTC vs. CLOP (66) + ACET (981) + MESO (105), 0.14, 0.29, 0.10, 0.17. Row 13: NTC vs. MESO (105), 0.11, 0.48, 0.24, 0.54. Row 14: NTC vs. ACET (981, 790), 0.13, 0.41, 0.27, 0.37. Row 15: NTC vs. FLUM (25), <0.01, <0.01, <0.01, <0.01.
a Abbreviations: ACET, acetochlor; CLOP, clopyralid; FLUM, flumetsulam; MESO, mesotrione; NTC, nontreated control.
b Three different alfalfa cultivars were evaluated, where 10 plants were grown for each treatment for 50 d (n = 270 experimental units). Contrasts were used to evaluate whether premixes or active ingredients within them changed the aboveground or belowground growth (α = 0.05).
c The rate of each treatment is listed in parentheses. The CLOP rate is g ae ha−1; the other herbicides are measured in g ai ha−1.
d Cultivar 1 is AFX 460, Alforex Seeds, a DLF brand, Albany, OR.
e Cultivar 2 is 54VR12, Pioneer, Johnston, IA.
f Cultivar 3 is SpringPearl, Renk Seed Company, Sun Prairie, WI.
g Treatments contained clopyralid only.
h Treatment contained acetochlor only.
Results demonstrate that different tolerances to herbicides exist among alfalfa cultivars. Differential tolerances of cultivars to herbicides have been previously demonstrated; for example, Cui and Yang (Reference Cui and Yang2011) found alfalfa cultivars differed in root length and biomass when treated with napropamide. While no comprehensive analysis of tolerances across active ingredients has occurred in alfalfa germplasm, results from experiments with soybean (Taylor-Lovell et al. Reference Taylor-Lovell, Wax and Nelson2001) and corn (Metzger et al. Reference Metzger, Soltani, Raeder, Hooker, Robinson and Sikkema2019) suggest that varying tolerances of germplasm to different active ingredient is common. Reductions in aboveground biomass were observed in at least one location with one cultivar was treated with CLOP, FLUM, MESO, and the combination of CLOP + ACET + FLUM. Alfalfa has been found to be sensitive to FLUM (Arregui et al. Reference Arregui, Sánchez and Scotta2001), MESO (Osterholtz et al. Reference Osterholz, Dias, Grabber and Renz2021), and CLOP (Renz Reference Renz2010), but the herbicides were applied to growing alfalfa or in the fall before spring planting, not 10 mo prior to planting alfalfa, as in this study. Although reductions in aboveground biomass were observed, the same treatments did not always confer reductions in belowground biomass. Often, different plant organs have different sensitivities to chemicals. This has been well studied with pea roots exhibiting less sensitivity than shoots to auxin herbicides (Grossmann Reference Grossmann2010; McCarthy-Suárez et al. Reference McCarthy-Suárez, Gómez, del Río and Palma2011). Additional research is needed to confirm this effect with non-auxinic herbicides. Because belowground biomass is not typically evaluated in bioassays, this highlights the importance of this result. Poor root development while alfalfa, a perennial crop, is becoming established, can impact future yield and longevity of the crop (Jones and Olsen Reference Jones and Olsen1987). Increases in both aboveground and belowground biomass after applications of FLUM and belowground biomass after CLOP applications were observed at ARL only. This increase in biomass may have been caused by low soil concentrations of these herbicides that can cause an increase in biomass (hormesis) (Calabrese and Blain Reference Calabrese and Blain2009). Other researchers have found that hormesis can result in increases in biomass of between 30% and 60% (Belz and Duke Reference Belz and Duke2014), and this may be the reason for the increase.
As differences in aboveground and belowground biomass rarely agreed between treatments among sites, this suggests that site-specific factors were affecting herbicide degradation. These herbicides have half-lives from of 9 d to 120 d (Senseman Reference Senseman2014). Because their degradation in soil occurs primarily through microbial breakdown, soil moisture and temperature are expected to affect degradation (Ahmad et al. Reference Ahmad, James, Rahman and Holland2003; Kucharski et al. Reference Kucharski, Dziągwa and Sadowski2014). ARS had less rain in fall 2023 (137 mm, 36% below the 30-yr avg) compared with LARS (168 mm, 29% less than the 30-yr avg). In 2024, fall precipitation increased at both locations, with ARS receiving 255 mm (20% above normal) and LARS receiving 215 mm (9% below normal). In contrast, fall 2025 was dry at both sites, with ARS and LARS each receiving 119 mm, corresponding to 44% and 49% below their respective 30-yr average. This higher fall precipitation could have enhanced herbicide breakdown or diluted concentrations by transporting the herbicide to deeper depths. Temperature in the winter could also be another factor because it can affect the breakdown of CLOP (Bergström et al. Reference Bergström, McGibbon, Day and Snel1991) and MESO (Halle and Richard Reference Ter Halle and Richard2006). While winter temperatures were warmer than 30-yr averages in March, they were similar among sites during 2023, 2024, and 2025, and therefore likely did not contribute to the differences observed between sites. Soil organic matter could have also influenced persistence because it was lower at LARS (2.7%) than ARS (3.4%). While the difference is small, organic matter can have large effects on herbicide breakdown (Villaverde et al. Reference Villaverde, Kah and Brown2008). Greater sensitivity of aboveground and belowground biomass at LARS could also have been due to the presence of the plant pathogen Aphanomyces euteiches in LARS soil, because it was detected in living roots of the alfalfa plants from the LARS soil (not detected in roots from ARS soil). This soil-borne disease infects alfalfa roots and affects aboveground and belowground root development (Giles et al. Reference Giles, Tordsen, Rebstock, Bucciarelli, Samac and Sathoff2022; Wu et al. Reference Wu, Chang, Hwang, Conner, Fredua-Agyeman, Feindel and Strelkov2019). While no research has documented that infected plants are more sensitive to these herbicides, given the stress from infection, it is plausible that this could have increased sensitivity to herbicides.
Field Bioassay
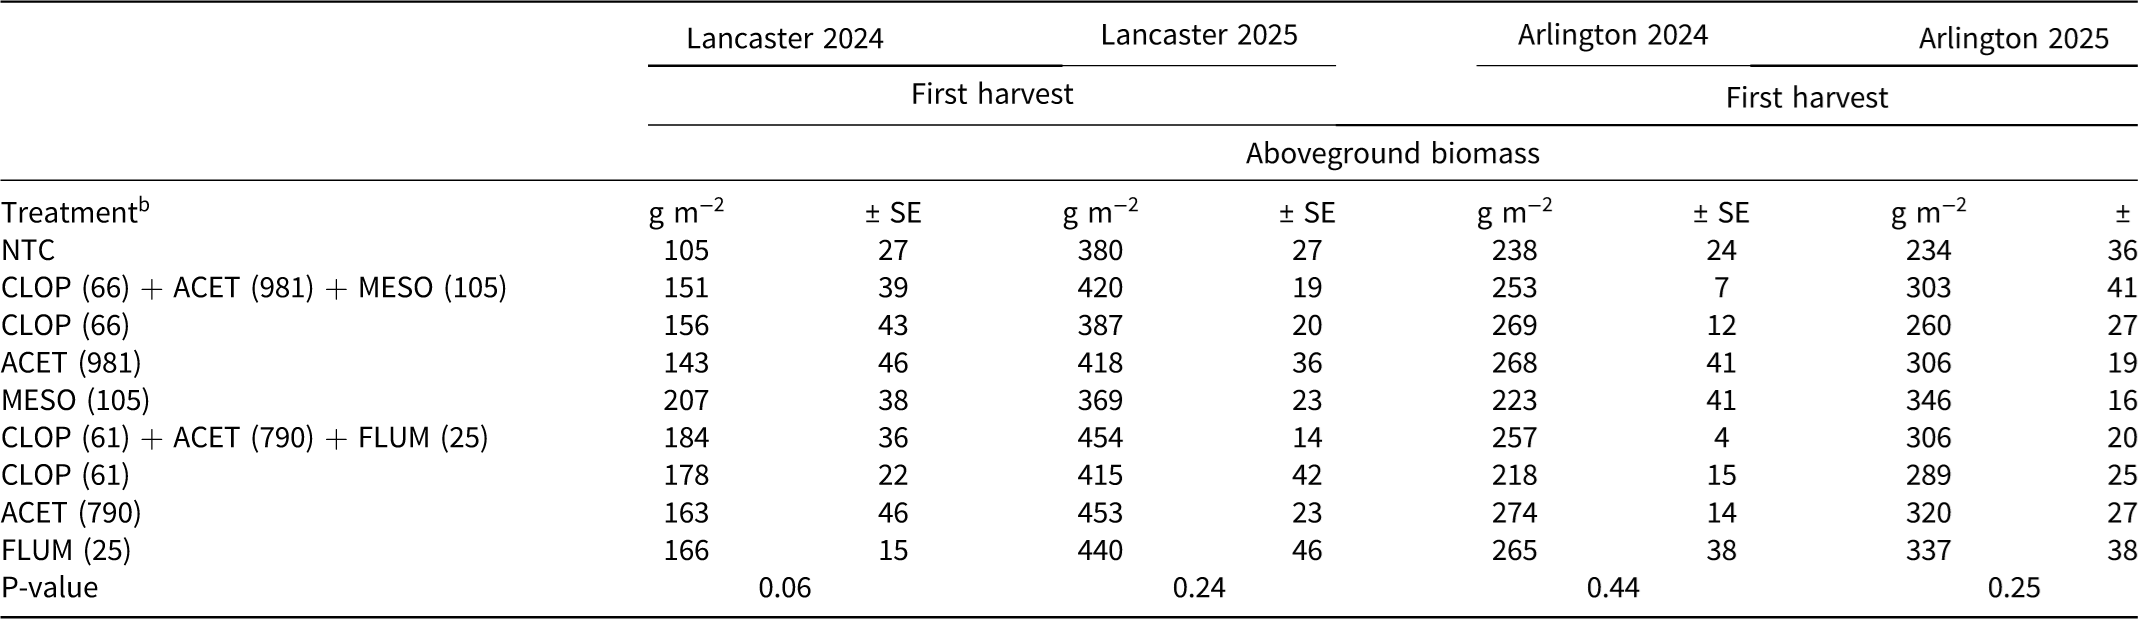
Alfalfa was successfully established at both field locations in both years. Stand density averaged 480 plants m−2 at ARS and 354 plants m−2 at LARS in June 2024, 430 plants m−2 at ARS and 397 plants m−2 at LARS in June 2025, and did not differ among treatments (P > 0.05) (data not shown). Densities >300 plants m−2 are considered a successful stand (Tesar and Marble Reference Tesar, Marble, Hanson, Barnes and Hill1988) and lack of difference in density among treatments suggests no mortality from herbicide treatments. Additionally, no differences in aboveground biomass were observed at either location or year in the first harvest (P > 0.05) (Table 6).
Effect of herbicide treatments on aboveground alfalfa biomass of the first harvest in 2024 and 2025 at both experimental locations. As no differences were detected from the first harvest, no additional measurements were made.

Table 6. Long description
A table comparing aboveground alfalfa biomass under different herbicide treatments across two locations, Lancaster and Arlington, for the years 2024 and 2025. The table has 10 rows and 12 columns. Column headers are Lancaster 2024, Lancaster 2025, Arlington 2024, and Arlington 2025, each with subheaders First harvest and Aboveground biomass. Row labels include various treatments and P-value. Row 1: NTC, 105 g m^-2 ± 27, 380 g m^-2 ± 27, 238 g m^-2 ± 24, 234 g m^-2 ± 36. Row 2: CLOP (66) + ACET (981) + MESO (105), 151 g m^-2 ± 39, 420 g m^-2 ± 19, 253 g m^-2 ± 7, 303 g m^-2 ± 41. Row 3: CLOP (66), 156 g m^-2 ± 43, 387 g m^-2 ± 20, 269 g m^-2 ± 12, 260 g m^-2 ± 27. Row 4: ACET (981), 143 g m^-2 ± 46, 418 g m^-2 ± 36, 268 g m^-2 ± 41, 306 g m^-2 ± 19. Row 5: MESO (105), 207 g m^-2 ± 38, 369 g m^-2 ± 23, 223 g m^-2 ± 41, 346 g m^-2 ± 16. Row 6: CLOP (61) + ACET (790) + FLUM (25), 184 g m^-2 ± 36, 454 g m^-2 ± 14, 257 g m^-2 ± 4, 306 g m^-2 ± 20. Row 7: CLOP (61), 178 g m^-2 ± 22, 415 g m^-2 ± 42, 218 g m^-2 ± 15, 289 g m^-2 ± 25. Row 8: ACET (790), 163 g m^-2 ± 46, 453 g m^-2 ± 23, 274 g m^-2 ± 14, 320 g m^-2 ± 27. Row 9: FLUM (25), 166 g m^-2 ± 15, 440 g m^-2 ± 46, 265 g m^-2 ± 38, 337 g m^-2 ± 38. Row 10: P-value, 0.06, 0.24, 0.44, 0.25.
aAbbreviations: CLOP, clopyralid; ACET, acetochlor; MESO, mesotrione; FLUM, flumetsulam, NTC, nontreated control.
b The rate of each treatment is listed in parentheses. The CLOP rate is g ae ha−1; the other herbicides are measured in g ai ha−1.
Field results differed from greenhouse results in that no differences were noted at either location. Given the plant-back interval for alfalfa with these herbicides ranged from 10.5 mo to 18 mo and drought in summer 2023 when the herbicides were being applied, we expected to observe differences in at least some of the locations and years. One reason for the lack of difference from field spring planting could be a longer time between herbicide application and alfalfa planting in the field (319 d in 2024 and 314 d during 2025) vs. the greenhouse study (229 d). While the soil is cold/frozen for much of this time in Wisconsin, monthly average air temperatures were warmer than the 30-yr average over both winters (February–March in 2024, March in 2025), which could have allowed further breakdown in the soil to concentrations that do not affect alfalfa. Another potential reason could be the cultivar selected to develop the field portion of the experiment. Cultivar 2 showed higher tolerance to CLOP, MESO, and FLUM than the other cultivars (Tables 5 and 6). Excess precipitation could also facilitate breakdown, as we observed in spring 2024 (24% to 25% higher than normal precipitation). This can increase herbicide breakdown and move mobile herbicides deeper into the soil, thus diluting their concentration (Malone et al. Reference Malone, Weatherington-Rice, Shipitalo, Fausey, Ma and Ahuja2004). Movement of CLOP is well documented (Pik et al. Reference Pik, Peake, Strosher and Hodgson1977) and FLUM persistence in the soil is highly affected by rain (Murphy and Shaw Reference Murphy and Shaw1997). MESO and ACET degradation, however, are not as closely linked to precipitation or movement (Kucharski et al. Reference Kucharski, Dziągwa and Sadowski2014; Sun et al. Reference Sun, Xu, Sun, Qin and Wang2013). Given that high precipitation in spring occurred in only one year and the inconsistent importance in breakdown of all active ingredients, it is unlikely that this is a primary factor responsible for breakdown to safe levels for alfalfa. While site-specific factors are influencing results, additional environments with varying environmental and physical factors are needed to accurately determine the mechanisms responsible for degradation.
While our results could not confirm that common residual herbicides used in corn plots were persisting and affecting alfalfa establishment and productivity the following spring, our results suggest that the potential exists in Wisconsin. Site-specific environmental and physical factors such as precipitation, organic matter, and air temperatures, are likely to be important in influencing the breakdown of these herbicides to safe levels. In addition to these factors, our research documents that alfalfa varieties can vary in their tolerance to these herbicides. While only three different cultivars were evaluated, they were from diverse germplasm and suggest this could be an additional factor that influences their tolerance. Quantification of the level of tolerance of alfalfa germplasm to common herbicides is needed. This information could be used in breeding efforts to improve tolerance or to inform producers of the sensitivity of a particular variety to a particular herbicide.
Practical Implications
This research provides information to help producers who are using corn residual herbicides with long plant-back restrictions and are planting alfalfa the following spring. Our results did not find any reductions in alfalfa plant density or biomass when alfalfa was planted in the spring after summer applications of common premixes. Despite this, producers and crop consultants should monitor areas where these premixtures are applied and avoid planting alfalfa when conditions are conducive to herbicide carryover of these products, as reductions in alfalfa biomass were observed from bioassays taken the fall prior to planting. Additionally, the discovery of varying tolerances in alfalfa germplasm to herbicides could improve outreach to farmers on which alfalfa cultivars are most sensitive to these herbicides and potentially be used in alfalfa breeding efforts to increase tolerance to these herbicides.
Acknowledgments
We thank colleagues and staff at the University of Wisconsin-Madison Lancaster Agricultural Research Station and Arlington Agricultural Research Station, and Renz Weed Science Laboratory students and staff for providing technical support for this project. We specifically thank Dan Smith, Douglas Wiedenbeck, and Travis Wilson for their help with field and greenhouse studies.
Funding
This research received no specific grant from any funding agency or commercial or not-for-profit organization.
Competing Interests
The authors declare they have no competing interests.

 Open access

