Introduction
One method by which individuals communicate social information is through modulation of tone of voice (prosody). For example, in social situations individuals sometimes choose to communicate information by saying the opposite of what they mean, while simultaneously modulating their tone of voice to communicate their counterfactual intent. This process, termed attitudinal prosody or ‘sarcasm’, is often performed with hostility. Alternatively, it may be used adaptively to communicate displeasure or anger without using words or vocal characteristics (e.g. direct insults, yelling) that might otherwise be considered even more threatening. In either case, intact sarcasm perception is an important component of social cognition and ‘mentalizing’ (e.g. the ability to understand the mental state of oneself and others: the theory of mind, ToM) (Winner et al. Reference Winner, Brownell, Happe, Blum and Pincus1998). In schizophrenia, social cognition is considered crucial for psychosocial impairment and rate limiting to social recovery (Green & Leitman, Reference Green and Leitman2008; Fett et al. Reference Fett, Viechtbauer, Dominguez, Penn, van Os and Krabbendam2011).
Although social cognition depends upon numerous forms of information that give rise to ToM, sarcasm may play a particularly important role in modern society across cultures (for review, see Cheang & Pell, Reference Cheang and Pell2009). For example, sarcasm is important for reciprocal social interaction and the development of age-appropriate peer relationships, it is associated with decreased defensiveness and with effective problem-solving skills, and is a common way to foster and conform to group membership in both the workplace and more causal settings (Smith & White, Reference Smith and White1965; Gibbs, Reference Gibbs2000). Because of its ambiguity with regard to other forms of expressing anger, sarcasm may also be a less threatening way to convey displeasure or anger, and thus may serve an adaptive purpose (Jorgenson, Reference Jorgenson1996; Fong, Reference Fong2006; Miron-Spektor et al. Reference Miron-Spektor, Efrat-Treister, Rafaeli and Schwarz-Cohen2011). Sarcasm differs from other forms of deception, such as ‘lying’, in that the sender is intending to have the receiver detect the true meaning, so that appropriate social interaction depends upon such detection. Sarcasm perception also requires more cognitive effort to discern; it is therefore more memorable than non-sarcastic speech and may enhance creative thinking (Gibbs, Reference Gibbs1986; Miron-Spektor et al. Reference Miron-Spektor, Efrat-Treister, Rafaeli and Schwarz-Cohen2011).
In schizophrenia, social cognitive deficits, including auditory (voice) emotion recognition (AER, ‘affective prosody’), have increasingly been linked to impairments in basic auditory function (Leitman et al. Reference Leitman, Laukka, Juslin, Saccente, Butler and Javitt2010; Gold et al. Reference Gold, Butler, Revheim, Leitman, Hansen, Gur, Kantrowitz, Laukka, Juslin, Silipo and Javitt2012; Kantrowitz et al. Reference Kantrowitz, Leitman, Lehrfeld, Laukka, Juslin, Butler, Silipo and Javitt2013), over and above the contributions of general cognitive impairment. Furthermore, in schizophrenia, emotion recognition deficits correlate with neurophysiological dysfunction within sensory brain regions (Leitman et al. Reference Leitman, Hoptman, Foxe, Saccente, Wylie, Nierenberg, Jalbrzikowski, Lim and Javitt2007, Reference Leitman, Wolf, Laukka, Ragland, Valdez, Turetsky, Gur and Gur2011). In the current study we investigated impairments in sarcasm detection in schizophrenia from both a prosody/sensory- and a connectivity-based perspective.
Our group first demonstrated sarcasm detection deficits in schizophrenia in 2006 (Leitman et al. Reference Leitman, Ziwich, Pasternak and Javitt2006), a finding that has since been replicated by several additional groups (Kern et al. Reference Kern, Green, Fiske, Kee, Lee, Sergi, Horan, Subotnik, Sugar and Nuechterlein2009; Sparks et al. Reference Sparks, McDonald, Lino, O'Donnell and Green2010; Mancuso et al. Reference Mancuso, Horan, Kern and Green2011). Although sarcasm is typically studied in the context of ToM, similar to AER, sarcasm is often impossible to detect without making use of the psychophysical, non-verbal features that contradict the semantic features. In particular, proper detection of pitch modulations, such as mean voice pitch (F0M) and pitch variability (F0SD), is important for both AER and sarcasm (Banse & Scherer, Reference Banse and Scherer1996; Juslin & Laukka, Reference Juslin and Laukka2001). Sarcasm is communicated by a reduction in F0M and F0SD in the range of 5–20% (Cheang & Pell, Reference Cheang and Pell2008). Additional changes in duration, voice quality, intensity and tempo are observed more variably across studies (Rockwell, Reference Rockwell2000, Reference Rockwell2007; Cheang & Pell, Reference Cheang and Pell2008). Thus, to the extent that ToM deficits in schizophrenia are driven by sensory-level impairments, as was suggested by our preliminary study (Leitman et al. Reference Leitman, Ziwich, Pasternak and Javitt2006), high correlation would be expected between sarcasm and AER performance.
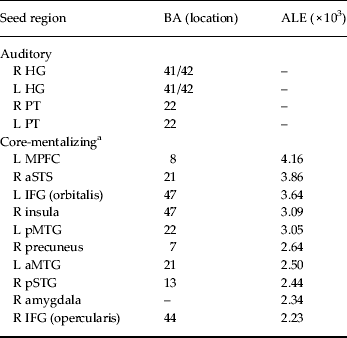
At present, identifying neural substrates of ToM in general, and sarcasm detection in particular, is an area of active research. ToM ability is linked to function within a widespread mentalizing network, consisting primarily of frontolimbic brain regions. These regions are associated with ToM in general (Vollm et al. Reference Vollm, Taylor, Richardson, Corcoran, Stirling, McKie, Deakin and Elliott2006; Materna et al. Reference Materna, Dicke and Thier2008; Loughead et al. Reference Loughead, Luborsky, Weingarten, Krause, German, Kirk and Gur2010; Abu-Akel & Shamay-Tsoory, Reference Abu-Akel and Shamay-Tsoory2011; Pedersen et al. Reference Pedersen, Koelkebeck, Brandt, Wee, Kueppers, Kugel, Kohl, Bauer and Ohrmann2012) and with sarcasm in particular (Uchiyama et al. Reference Uchiyama, Seki, Kageyama, Saito, Koeda, Ohno and Sadato2006, Reference Uchiyama, Saito, Tanabe, Harada, Seki, Ohno, Koeda and Sadato2012; Kipps et al. Reference Kipps, Nestor, Acosta-Cabronero, Arnold and Hodges2009). A recent meta-analysis of ToM neuroimaging studies identified a putative ‘core-mentalizing’ network (Table 1) that includes primarily frontal and paralimbic/limbic areas but also the auditory cortex/temporal lobe (Mar, Reference Mar2011), suggesting that these areas contribute significantly to the process of mentalization.
Auditory and ToM core-mentalizing seed regions

ToM, Theory of mind; BA, Brodmann area; L, left; R, right; p, posterior; a, anterior; HG, Heschel's gyrus; PT, planum temporale; MPFG, medial prefrontal frontal gyrus; STS, superior temporal sulcus; IFG, inferior frontal gyrus; MTG, middle temporal gyrus; STG, superior temporal gyrus.
a Seeds identified in an activation likelihood estimation (ALE) meta-analysis of non-story-based studies of ToM (Mar, Reference Mar2011).
As in previous work, we assessed sarcasm using the attitudinal subtest of the Aprosodia Battery (APT; Orbelo et al. Reference Orbelo, Grim, Talbott and Ross2005), adding an acoustic analysis of the individual items within the test, permitting evaluation of the degree to which variation in specific psychophysical parameters (F0M, F0SD, intensity) affected between-group performance. All subjects were also tested on simple pitch-processing ability using the tone-matching test, and on AER using the Juslin & Laukka (Reference Juslin and Laukka2001) battery. Based on findings suggesting the relative importance of processing speed for community function (Bowie et al. Reference Bowie, Leung, Reichenberg, McClure, Patterson, Heaton and Harvey2008; Kern et al. Reference Kern, Gold, Dickinson, Green, Nuechterlein, Baade, Keefe, Mesholam-Gately, Seidman, Lee, Sugar and Marder2011), all subjects were tested on the Wechsler Adult Intelligence Scale-III (WAIS-III) Processing Speed Index (PSI), a component of the Performance IQ construct (Wechsler, Reference Wechsler1997), as a proxy for general neurocognitive function.
In the present study we also used resting-state functional magnetic resonance imaging (rsfMRI) to evaluate the relationship of the brain connectivity of the auditory cortex/core-mentalizing region and sarcasm impairments in schizophrenia. rsfMRI is a recently developed, reliable (Turner et al. Reference Turner, Chen, Mathalon, Allen, Mayer, Abbott, Calhoun and Bustillo2012) technique that permits assessment of resting-state functional connectivity (rsFC) between brain regions by evaluating the coherence of low-frequency oscillations (0.01–0.1 Hz) in blood oxygen level-dependent (BOLD) signals during the resting state (Friston, Reference Friston1994; Biswal et al. Reference Biswal, Yetkin, Haughton and Hyde1995, Reference Biswal, Mennes, Zuo, Gohel, Kelly, Smith, Beckmann, Bucker, Colcombe, Dogonowski, Ernst, Hyde, Kotter, McMahon, Maddon, Madsen, Butler, Hampson, Hoptman, Kiviniemi, Li, Lin, Lowe, Mayberg, Peltier, Petersen, Raichle, Rombouts, Rypma, Schlagger, Schmidt, Siegle, Sorg, Teng, Villringer, Walter, Wang, Whitfield-Gabrieli, Windishchberger, Zhang, Zang, Castellanos and Milham2010).
Previous studies (Das et al. Reference Das, Calhoun and Malhi2012a ,Reference Das, Lagopoulos, Coulston, Henderson and Malhi b ) have found impaired FC within putative mentalizing networks during a visual ToM task, but the specific role of sensory regions (primary auditory cortex) versus ‘core-mentalizing regions’ in ToM impairments was not assessed, and moreover, no auditory ToM tasks were assessed. In the present study, correlational seeds were placed within both auditory regions and regions identified from meta-analysis of recent ToM studies (Table 1) (Mar, Reference Mar2011). Based upon our previous findings of significant auditory dysfunction in schizophrenia patients, we predicted that the schizophrenia group would show significant correlation between ToM deficits and rsFC within auditory regions, suggesting that auditory dysfunction might be rate limiting, whereas in controls the correlations would be to core-mentalizing regions.
Method
Subjects
Subjects comprised 76 medicated patients recruited from chronic in-patient (51%) and supervised residential out-patient sites (49%) associated with the Nathan Kline Institute (NKI) and 72 controls recruited from the healthy volunteer pool at NKI who had completed the sarcasm perception and all ancillary tasks (PSI, AER and tone matching). All subjects gave their signed informed consent to participate in the study, and patients met DSM-IV-TR criteria (First et al. Reference First, Spitzer, Gibbon and Williams1994) for either schizophrenia (n = 61) or schizo-affective disorder (n = 15), with no significant between-diagnosis differences or hospital status seen on the auditory tasks (all p > 0.22). We excluded controls with a history of an Axis I psychiatric disorder, as defined by the Structured Clinical Interview for DSM-IV (SCID). Patients and controls were excluded if they had any neurological or auditory disorders noted on their medical history or in prior records, or for alcohol or substance dependence within the past 6 months and/or abuse within the past month (First et al. Reference First, Spitzer, Gibbon and Williams1994). To assess the relationship between clinical symptoms and overall functioning, a subsample of subjects were interviewed using semistructured clinical interviews: the Positive and Negative Symptom Scale (PANSS; Kay et al. Reference Kay, Fiszbein and Opler1987), the Global Assessment of Functioning (GAF; Hall, Reference Hall1995) and the Independent Living Scale (ILS; Revheim & Medalia, Reference Revheim and Medalia2004). Clinical ratings were consistent with moderate levels of illness.
Acoustic analysis of the psychophysical features of the individual stimuli of the sarcasm task was conducted on 52 patients and 61 controls for whom full item-level data were recorded. We also report on an imaging subset of 17 patients and 22 controls who completed the sarcasm task and participated in the MRI. The imaging subset included two patients and eight controls who did not complete all the ancillary tasks and therefore were not included in the larger sample. Supplementary Table S1 presents details on the demographics, clinical ratings and subsample sizes.
Auditory tasks
Auditory tasks were presented on a CD player at a sound level that was comfortable for each listener in a sound-attenuated room.
Attitudinal prosody (sarcasm perception)
As in previous work (Leitman et al. Reference Leitman, Ziwich, Pasternak and Javitt2006), sarcasm perception was assessed using the APT (Orbelo et al. Reference Orbelo, Grim, Talbott and Ross2005). This battery of tests consists of 10 semantically neutral sentences (e.g. ‘That was a smart thing to say’) that were recorded by a female speaker in both a sincere and a sarcastic manner for a total of 20 unique utterances (10 pairs). These utterances were repeated twice for a total of 40 stimuli. Subjects were instructed to state, after each stimulus, whether the speaker was being sincere or sarcastic. If subjects were confused by the instructions, further elaboration, using more commonplace synonyms, was provided. Subjects’ scores reflected overall percent correct (sarcasm) as the primary outcome, with ‘Hits’ as the correct detection of sarcastic utterances and correct rejections (CR), that is the correct detection of sincere utterances, analyzed secondarily. As in the previous study (Leitman et al. Reference Leitman, Ziwich, Pasternak and Javitt2006), non-parametric signal detection measures of sensitivity (A′) and bias (B′) were calculated. Acoustic analysis of the individual stimuli was conducted with PRAAT software (Boersma, Reference Boersma2001). Mean (F0M) and variability (F0SD) of pitch were measured, as were mean and variability of intensity (volume).
AER
AER was assessed using 32 stimuli from Juslin & Laukka's (Reference Juslin and Laukka2001) emotional prosody task, as described previously (Gold et al. Reference Gold, Butler, Revheim, Leitman, Hansen, Gur, Kantrowitz, Laukka, Juslin, Silipo and Javitt2012). The sentences were scored based on the speaker's intended emotion (happy, sad, angry, fear or neutral). The sentences were semantically neutral and consisted of both statements and questions (i.e. ‘It is eleven o'clock’, ‘Is it eleven o'clock?’). Correct percent responses were analyzed across groups. These data represent a subsample that has been presented previously (Gold et al. Reference Gold, Butler, Revheim, Leitman, Hansen, Gur, Kantrowitz, Laukka, Juslin, Silipo and Javitt2012).
Tone-matching task
Pitch processing was obtained using a simple tone-matching task (Leitman et al. Reference Leitman, Laukka, Juslin, Saccente, Butler and Javitt2010). This task consists of pairs of 100-ms tones in series, with a 500-ms intertone interval. Within each pair, tones are either identical or differed in frequency by specified amounts in each block (2.5, 5, 10, 20 or 50%). In each block, 12 of the tones are identical and 14 are dissimilar. Tones are derived from three reference frequencies (500, 1000 and 2000 Hz) to avoid learning effects. In all, the test consisted of five blocks of 26 pairs of tones.
Statistical analyses
Between-group comparisons were performed using multivariate ANOVA, with follow-up independent-sample t tests as required. Relationships among measures were determined by Pearson correlations and multivariate linear regression, as indicated. Two-tailed statistics are used throughout (α level of p < 0.05). Between-group effect sizes (Cohen's d) were calculated (Cohen, Reference Cohen1988).
MRI acquisition
Scanning took place on the 1.5-T Siemens Vision Scanner (Germany) at the NKI Center for Advanced Brain Imaging. Participants received a magnetization-prepared rapid gradient echo (MPRAGE) T1-weighted scan [repetition time (TR) = 11.6 ms, echo time (TE) = 4.9 ms, inversion time (TI) = 1122 ms, matrix = 256 × 256, field of view (FOV) = 256 mm, slice thickness = 1 mm, 190 slices, no gap, one acquisition), and a 6-min rsfMRI scan (TR = 2000 ms, TE = 50 ms, matrix = 64 × 64, FOV = 224 mm, 5 mm slice thickness, 22 slices, no gap, 180 acquisitions). For the resting-state scan, participants were instructed to close their eyes and remain awake.
Data analysis
Resting-state data were preprocessed, as described elsewhere in detail (Margulies et al. Reference Margulies, Kelly, Uddin, Biswal, Castellanos and Milham2007; Kelly et al. Reference Kelly, Uddin, Biswal, Castellanos and Milham2008; Hoptman et al. Reference Hoptman, Zuo, Butler, Javitt, D'Angelo, Mauro and Milham2010), using scripts provided by the 1000 Functional Connectomes Project (Biswal et al. Reference Biswal, Mennes, Zuo, Gohel, Kelly, Smith, Beckmann, Bucker, Colcombe, Dogonowski, Ernst, Hyde, Kotter, McMahon, Maddon, Madsen, Butler, Hampson, Hoptman, Kiviniemi, Li, Lin, Lowe, Mayberg, Peltier, Petersen, Raichle, Rombouts, Rypma, Schlagger, Schmidt, Siegle, Sorg, Teng, Villringer, Walter, Wang, Whitfield-Gabrieli, Windishchberger, Zhang, Zang, Castellanos and Milham2010), available at www.nitrc.org/projects/fcon_1000/. In brief, the first 10 volumes were discarded to eliminate T1 relaxation effects. Thereafter, images were motion corrected using AFNI (Cox, Reference Cox1996). Next, time series were smoothed using a 6-mm full-width at half-maximum (FWHM) Gaussian kernel and spatially normalized to Montreal Neurological Institute (MNI) space (2 × 2 × 2 mm3 resolution) using FSL (www.fmrib.ox.ac.uk/fsl). The MPRAGE image was segmented using FSL's FAST software to obtain image masks for white matter (WM) and cerebrospinal fluid (CSF) compartments, which were also projected into MNI space and used to extract the corresponding time series for the resting-state scans. The WM and CSF time series were then averaged across voxels within their respective compartments. These time series, along with the time series for the six motion parameters and the global signal, were regressed out from the MNI space echo–planar imaging (EPI) time series.
Four auditory cortex anatomically based regions of interest (ROIs) were derived from the Harvard Oxford Cortical Structural Atlas that is part of FSL: left and right Heschl's gyrus (HG), and left and right planum temporale (PT). These regions were extracted from the Atlas and were thresholded at 25% probability. They were then used to extract time series for the relevant ROIs from the residualized images described above. The resulting time series for each ROI were then regressed against the residualized images described above to compute the FC for each region.
To examine the specific role of the primary auditory cortex, we also examined core-mentalizing network ROIs identified in an activation likelihood estimation (ALE) meta-analysis for non-story-based studies of ToM (see Table 6 in Mar, Reference Mar2011). These regions were available as supplementary material (www.annualreviews.org/doi/suppl/10.1146/annurev-psych-120709-145406). We downloaded the ROIs and resampled them to 2 × 2 × 2 mm3 MNI space prior to data analysis. We included the top 10 ROIs, as ranked by ALE size. In some cases, whole-brain coverage was not possible, so computations were limited to voxels for which all subjects had data. The core-mentalizing ROIs analyzed are listed in Table 1.
Group-level analyses were conducted using the FSL ordinary least squares (OLS) model implemented in FLAME. Two-sample t tests on rsFC maps between patients and normal controls were performed to examine the differences in rsFC between the two groups. This statistical procedure produced thresholded z statistic maps of clusters defined by a threshold of z = 2.3 and a corrected cluster threshold of p = 0.05 using Gaussian random field theory (Worsley, Reference Worsley, Jezzard, Matthew and Smith2001), and revealed brain regions showing significantly different rsFC between patients and healthy controls. These same corrections applied to the regression analyses between rsFC and sarcasm.
Because small amounts of movement from volume to volume can influence rsFC results (Power et al. Reference Power, Barnes, Snyder, Schlaggar and Petersen2012), we computed framewise displacements (FDs) for our data, which were used as covariates in all analyses. Four patients and three controls in the original cohort of 21 patients and 25 controls had FD > 0.5 on more than 35 volumes (i.e. < 4.8 min of usable data) and were eliminated from our final analyses, yielding a reported sample of 17 patients and 22 controls (Supplementary Table S1). Groups did not differ in FD (p < 0.42).
Results
Between-group auditory task analysis
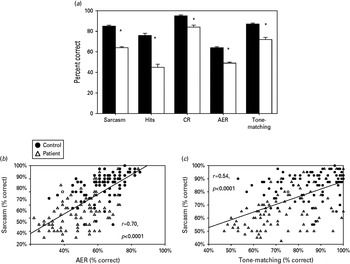
As predicted, highly significant differences in percent correct were seen between groups on a multivariate ANOVA across the three auditory tasks (Fig. 1 a: F 1,146 = 118, p < 0.001), along with a significant group × task interaction (F 2,145 = 6.8, p < 0.001), reflecting larger effect size group differences for sarcasm (F 1,146 = 132.4, p < 0.001, d = 1.4 s.d.) than for either tone matching (F 1,146 = 46.7, p < 0.001, d = 1.0 s.d.) or AER differences (F 1,146 = 57.7, p < 0.001, d = 1.1 s.d.). For tone matching, both patients and controls showed the expected improvement across levels, suggesting appropriate task engagement (Supplementary Table S2).
(a) Bar graph (mean ± standard error of the mean) of percent correct for auditory processing tasks. Sarcasm, overall correct; Hits, correct detection of sarcastic utterances; CR, correct rejections, that is correct detection of sincere utterances; AER, auditory emotion recognition; TMT, tone-matching task. * p < 0.05 on independent-samples t test. (b,c) Scatter plots of sarcasm perception versus (b) AER and (c) TMT. Significant within-group correlations with the TMT are seen for schizophrenia patients (r = 0.45, n = 76, p < 0.001) but not controls (r = 0.18, n = 72, p = 0.13).

Deficits in overall accuracy in the sarcasm task reflected a reduction in both hits (i.e. correct detection of sarcastic utterances: F 1,146 = 73.5, p < 0.001) and correct rejections (CRs: that is correct detection of sincere utterances: F 1,146 = 21.1, p < 0.001) (Fig. 1 a). Furthermore, signal detection analysis (Supplementary Table S2) of both sarcasm and tone matching showed that both resulted from a reduction in sensitivity (sarcasm: t 139 = 8.1, p < 0.001; tone matching: t 146 = 5.1, p < 0.001), with no significant difference in bias (sarcasm: t 139 = 1.4, p = 0.17; tone matching: t 146 = 0.3, p = 0.76). Between-group percent correct differences for sarcasm (F 4,143 = 57.7, p < 0.001), tone matching (F 4,143 = 20.7, p < 0.001) and AER (F 4,143 = 29.2, p < 0.001) remained significant when controlling for age, gender and PSI, suggesting that they could not be accounted for solely by demographic variables or general cognitive ability.
Relationships among auditory measures
In the absence of covariates, sarcasm perception correlated significantly with both tone-matching performance (r = 0.56, n = 148, p < 0.001) (Fig. 1 b) and AER (r = 0.70, n = 148, p < 0.001) (Fig. 1 c) across groups. These correlations remained significant across groups when controlling for PSI (r = 0.77, F 3,144 = 73.2, p < 0.001) or group membership (r = 0.80, F 3,144 = 87.4, p < 0.001) (Supplementary Table S3). Moreover, independent correlations with sarcasm perception were seen within the schizophrenia group for tone matching (r = 0.45, n = 76, p < 0.001), AER (r = 0.56, n = 76, p < 0.001) and PSI (r = 0.40, n = 76, p < 0.001). By contrast, no significant correlation between sarcasm and tone matching was observed in controls alone (r = 0.18, n = 72, p = 0.13), although the correlations with PSI (r = 0.28, n = 72, p = 0.018) and AER (r = 0.54, n = 72, p < 0.001) remained significant.
Relationship with outcome and demographics clinical ratings
No significant correlations were seen between sarcasm perception and subjects’ socio-economic status (SES), duration of illness or chlorpromazine (CPZ) equivalents. Significant correlations were seen between sarcasm perception and general function measures GAF (r = 0.28, n = 66, p = 0.022) and ILS (r = 0.38, n = 73, p = 0.001).
Acoustic analysis
The psychophysical features (F0M, F0SD and intensity values) for the sarcastic and sincere stimuli were extracted using acoustic analysis (PRAAT) software (Table 2). Across all unique utterances in this task (n = 10 pairs), F0M of sarcastic stimuli was significantly lower (12 ± 5%, p > 0.0001) in sarcastic stimuli than in the corresponding sincere stimuli, and F0SD showed a trend towards being significantly lower (21 ± 28%, p = 0.065). Other measures, such as intensity and intensity variability, were not significantly different.
Acoustic analysis of sarcasm task

F0M, Mean fundamental frequency (pitch); F0SD, variability of fundamental frequency (pitch); df, degrees of freedom; s.d., standard deviation.
To explore the influence of specific features on sarcasm perception (overall percent correct), we conducted a three-way, group [(patient/control) × intention (sincere/sarcastic) × stimulus (unique sentence/utterance)] analysis across the 10 pairs of stimuli. As expected, patients showed worse overall performance (F 1,111 = 102.2, p < 0.00001) and also lower relative performance for sarcastic versus sincere stimuli (group × intention: F 1,103 = 15.7, p < 0.0001). Patients also showed a differential response across stimuli versus controls as reflected in a significant group × intention × stimulus (F 9,103 = 3.2, p = 0.002).
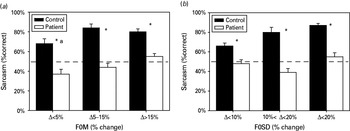
To parse this interaction, stimuli were divided according to levels of F0M (Fig. 2 a) and F0SD (Fig. 2 b) based on the magnitude of the percent difference between sincere and sarcastic forms. Patients performed significantly below chance performance for stimuli with < 5% difference in F0M between the sincere and sarcastic forms (t 51 = 2.94, p = 0.005), suggesting that they heard stimuli with low levels of F0M difference as being actively sincere. Furthermore, significant group × F0M level (F 2,110 = 4.4, p = 0.015) and group × F0SD level interactions (F 2,110 = 8.8, p = 0.0002) were seen (Fig. 2 b).
Bar graph (mean ± standard error of the mean) of percent correct for sarcasm, with stimuli categorized by the percent difference in (a) F0M and (b) F0SD between corresponding sincere and sarcastic statements. A group × F0M (F 2,110 = 4.4, p = 0.015) and group × F0SD (F 2,110 = 8.8, p = 0.0002) level interaction was found, suggesting that patients had increasing difficulty with smaller percent differences. The dashed line represents chance performance rate (50%). * p < 0.001 between groups on the independent-sample t test. a p < 0.01 vs. chance (50%) for the patient group on the one-sample t test.

Relationship between functional connectivity and sarcasm
To determine potential neural substrates of sarcasm perception, an rsFC analysis was conducted. Seeds were placed in four auditory and 10 core-mentalizing regions (Table 1). rsFC was then determined on a voxel-wise basis throughout the brain, and regions that showed significant rsFC correlations to the seed relative to performance on the sarcasm task were identified. These regions were then used for across-group correlational analysis. Separate analyses were conducted for auditory and core seeds.
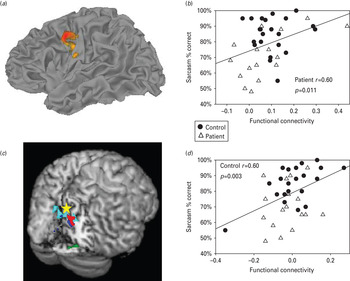
For auditory regions, a significant correlation was observed between sarcasm performance and rsFC between right HG and left precentral gyrus/medial frontal gyrus (Fig. 3 a and Supplementary Table S4). Clusters extended to the left postcentral gyrus [Brodmann area (BA) 3/4/1]. A regression performed across all subjects showed significant correlation between rsFC and sarcasm performance, even when group was included as a factor (r = 0.37, n = 39, p = 0.022, Fig. 3 b). The correlation was independently significant only within the patient (BA 6, r = 0.60, n = 17, p = 0.011), and not the control (r = 0.01, n = 22, p = 0.96), group. Moreover, the two correlation coefficients differed significantly (p = 0.049). No significant correlation of regions relative to sarcasm were detected for the remaining auditory seeds (left HG or right/left PT).
(a) Correlation region of resting-state functional connectivity (rsFC) for right Heschl's gyrus (R HG) and sarcasm perception in patients with schizophrenia. (b) Scatter plot of sarcasm perception versus rsFC in R HG. (c) Correlation region of rsFC for the left posterior medial temporal gyrus (L pMTG: red), right anterior superior temporal sulcus (R aSTS: blue), right insula (green), and right posterior superior temporal gyrus (R pSTG: cyan) and sarcasm perception in controls. Correlations thresholded at p < 0.05, corrected for Gaussian random fields. (d) Scatter plot of sarcasm perception versus rsFC in the R pSTG. Correlations remained significant using Spearman (non-parametric) correlations (ρ = 0.43, p = 0.043).

For core-mentalizing regions, significant rsFC correlation regions were observed for four of the 10 seed locations (Supplementary Table S5). Significant rsFC was primarily seen between the seed region and the precuneus/cuneus and surrounding cortex (Fig. 3 c). Core regions for which significant correlation patterns were observed included the right posterior superior temporal gyrus (R pSTG, Fig. 3 d), left posterior medial temporal gyrus (L pMTG), right anterior superior temporal sulcus (R aSTS), and right insula. For both R pSTG and L pMTG, regression performed across all subjects showed a correlation with sarcasm that remained significant even after group was included as a factor, but which was independently significant only within the control, and not the patient, group (Supplementary Table S5). For R aSTS and insula, correlations were significant only within the control group.
Discussion
ToM and sarcasm perception depend upon interactions within large-scale brain networks involving sensory, and also putative ‘core-mentalizing’ brain, regions identified in a recent meta-analysis (Mar, Reference Mar2011). Dysfunction anywhere within these networks will produce behavioral deficits, with the pattern depending upon the nature and locus of the dysfunction. The present study confirms sarcasm detection deficits in schizophrenia, along with more basic auditory and emotion processing deficits, and relates these deficits to impairments within specific sensory/cognitive regions using both correlational analyses and rsfMRI. In patients, deficits in sarcasm detection correlate significantly with auditory dysfunction even following control for more general cognitive impairments, as reflected in the PSI. Furthermore, in patients, but not controls, sarcasm detection performance correlates with FC between the right auditory cortex, a region known to be involved in prosodic processing (Mitchell & Ross, Reference Mitchell and Ross2008), and the left precentral gyrus, a region with a known role in emotion processing (Li et al. 2012). By contrast, in controls, but not patients, correlations were only seen within core-mentalizing regions.
We have previously shown that an inability to process mean pitch (F0M) and pitch variability (F0SD) contributes significantly to AER deficits in schizophrenia (Gold et al. Reference Gold, Butler, Revheim, Leitman, Hansen, Gur, Kantrowitz, Laukka, Juslin, Silipo and Javitt2012). In this study, patients performed significantly below chance for stimuli in which the mean pitch (F0M) difference between sincere and sarcastic utterances was < 5%, suggesting that they heard these stimuli as being actively sincere, even while controls heard them as primarily sarcastic (Fig. 2 a). Patients showed a similar inability to use pitch variability (F0SD) in discriminating between sarcasm and sincere (Fig. 2 b). These findings thus suggest that impaired sensitivity to pitch change in schizophrenia contributes significantly to impairments in ToM, and also in AER, discrimination.
Controls showed a significant correlation between sarcasm detection and rsFC levels for four of the brain regions identified in the meta-analysis (Mar, Reference Mar2011), but not for auditory regions. The rsFC targets of these core-mentalizing regions relative to sarcasm detection centered on the precuneus/cuneus (Fig. 3 c), consistent with a proposed role for this region as a processing core essential for mentalizing (Hagmann et al. Reference Hagmann, Cammoun, Gigandet, Meuli, Honey, Wedeen and Sporns2008). To our knowledge, this is the first study to show between-region rsFC correlations with sarcasm performance in control subjects, although reductions in task-related FC among R STG, insula and cuneus have been previously reported during a visual ToM task performance in schizophrenia (Das et al. Reference Das, Calhoun and Malhi2012a ,Reference Das, Lagopoulos, Coulston, Henderson and Malhi b ). Although Das and colleagues examined FC of core-mentalizing regions, they did not evaluate the role of sensory regions using either behavioral or neuroimaging measures. In general, potential sensory contributions to cognitive impairments in schizophrenia have been understudied, primarily because researchers do not collect the appropriate measures in designing and conducting their studies.
By contrast, patients only had correlations between sarcasm performance and rsFC of the right auditory cortex, and not core-mentalizing regions. This suggests that, for patients, the function of the primary auditory cortex may be rate limiting for sarcasm detection and may determine the difference between chance level and above chance level performance, whereas for controls, connectivity among higher brain regions may be rate limiting and may differentiate between good and near-perfect performance. Taken together, the present results highlight the difficulties faced by patients in normal social situations. As shown by acoustic analysis of the stimuli, the degree of pitch difference typically used to communicate sarcasm is relatively small and only slightly above threshold for most healthy individuals (Supplementary Table S2). Thus, other factors involving mentalization determine the level of performance for controls. By contrast, for patients, the degree of pitch difference is at or below their detection threshold, so auditory discrimination itself becomes rate limiting. Similarly, for controls, integrity of rsFC between core-mentalizing regions becomes rate limiting, whereas for patients correlations are observed only for the right auditory cortex.
Despite the robust findings, there are specific limitations to the present study. First, we did not include general ToM tasks. In other studies, several aspects of ToM, such as detection of lying, have been paradoxically intact despite deficits in detection of sarcasm (Kern et al. Reference Kern, Green, Fiske, Kee, Lee, Sergi, Horan, Subotnik, Sugar and Nuechterlein2009). These findings were interpreted as supporting a specific role for detection of psychophysical features, such as F0M and F0SD, as reported here. Nevertheless, deficits are observed across a large range of ToM tasks in schizophrenia, not all of which require pitch-based acoustic processing (Biedermann et al. Reference Biedermann, Frajo-Apor and Hofer2012). The reduced rsFC observed in core-mentalizing frontolimbic regions in patients suggests that tasks relying specifically on these regions should be sensitive to cortical processing impairments in schizophrenia.
Second, although we did not find any relationship with mean antipsychotic drug dose or illness duration, our sample consisted primarily of chronically medicated patients at a state psychiatric hospital and related supervised out-patient facilities, and we excluded controls with Axis I disorders. Moreover, our measure of general cognition, although strongly supported by the literature (Bowie et al. Reference Bowie, Leung, Reichenberg, McClure, Patterson, Heaton and Harvey2008; Kern et al. Reference Kern, Gold, Dickinson, Green, Nuechterlein, Baade, Keefe, Mesholam-Gately, Seidman, Lee, Sugar and Marder2011), does not assess other potentially important domains. Thus, we cannot fully separate the effects of medication or chronic cognitive or functional impairment on sarcasm detection or rsFC. However, it should be noted that rsFC is task independent (i.e. obtained while subjects are not performing a specific behavioral paradigm), so that rsFC correlations are not confounded by the direct influence of motivation or performance on brain measures. Third, although we based our analyzed core-mentalizing ROIs on an independent meta-analysis, we note that our chosen regions are an approximation of the ‘true’ core-mentalizing region, limiting the specificity of our findings. Fourth, our acoustic analysis was limited by the low number of stimuli in the task, and future studies should confirm these findings with a larger stimulus set.
In conclusion, schizophrenia patients show severe deficits in daily interaction that stem, at least in part, from simple communicatory disturbance. The insensitivity of patients to subtle pitch features is related to dysfunction at the level of the auditory sensory cortex, and is detected with rsfMRI, which is an increasingly important method for delineating patterns of neural dysfunction underlying cognitive impairments in schizophrenia. Given the importance of functions such as AER or sarcasm detection to daily function, approaches to improving tonal detection ability, along with connectivity between auditory and frontolimbic brain regions, may be crucial for sensory-based cognitive remediation and functional rehabilitation in schizophrenia. If replicated, the present results may be useful for informing potential sensory-based cognitive remediation (Fisher et al. Reference Fisher, Holland, Merzenich and Vinogradov2009; Kantrowitz et al. Reference Kantrowitz, Revheim, Pasternak, Silipo and Javitt2009; Norton et al. Reference Norton, McBain, Ongur and Chen2011) and brain stimulation-based treatment development (Clark et al. Reference Clark, Coffman, Mayer, Weisend, Lane, Calhoun, Raybourn, Garcia and Wassermann2012; Demirtas-Tatlidede et al. Reference Demirtas-Tatlidede, Vahabzadeh-Hagh and Pascual-Leone2013).
Supplementary material
For supplementary material accompanying this paper, visit http://dx.doi.org/10.1017/S0033291713000834.
Acknowledgments
The preparation of this manuscript was supported in part by the National Center for Research Resources and the National Center for Advancing Translational Sciences, National Institutes of Health, through Grant No. UL1 RR024156, and the Dr Joseph E. and Lillian Pisetsky Young Investigator Award for Clinical Research in Serious Mental Illness to J.T.K., R01 DA03383, P50 MH086385 and R37 MH49334 to D.C.J., K01MH094689 and a National Alliance for Research on Schizophrenia and Depression (NARSAD) (Brain and Behavior Research Foundation) Young Investigator Award to D.I.L. and R01MH064783, R01MH084848 and R21MH084031 to M.J.H. The content is solely the responsibility of the authors and does not necessarily represent the official views of the NIH. We also thank D. Orbelo and E. Ross for the use of the APT.
Declaration of Interest
Dr Kantrowitz reports having received consulting payments within the past 2 years from Quadrant Health, RTI Health Solutions, the Sacoor Medical Group and AgencyRx. He has conducted clinical research supported by the National Institute of Mental Health (NIMH), Roche-Genentech, EnVivo, Psychogenics, Sunovion, Novartis, Pfizer, Lilly, Jazz and GlaxoSmithKline. He owns a small number of shares of common stock in GlaxoSmithKline. Dr Javitt reports having received consulting payments within the past 2 years from Schering-Plough, Takeda, NPS Allelix, Solvay, Sepracor, AstraZeneca, Pfizer, Cypress, Merck, Sunovion, Lilly, and BMS. He has received research support from Pfizer and Roche. He holds intellectual property rights for use of NMDA modulators in the treatment of neuropsychiatric disorders. He has served on the advisory board of Promentis.