A pesar de cuanto se ha escrito acerca de la agricultura española de los siglos XVIII, XIX y XX, la querella entre los historiadores está lejos de haber sido resuelta. De ello dan fe los debates que de cuando en cuando salpican la escena historiográfica españolaFootnote 1. La imagen dominante hasta la década de 1980 era la de un sector agrario estancado que no había cumplido las tareas que los teóricos del desarrollo atribuyen a la agricultura en el proceso de crecimiento económico, de manera que se prolongaba con un lenguaje actualizado la tradición pesimista del regeneracionismo. El avance de la investigación empírica y la acumulación de series cuantitativas desde los años ochenta modificaron ese panorama, desvelando un sector agrario más dinámico de lo que se había supuesto y reforzando la idea de trayectorias diferenciadas en las regiones españolasFootnote 2.
Desechada de modo definitivo la tesis del estancamiento agrario, la cuestión a dilucidar es si se trató meramente de un crecimiento de tipo extensivo, abocado por tanto a la trampa maltusiana, o de si se puede hablar de crecimiento intensivo. Aunque no se descartan ganancias de productividad derivadas de una creciente especialización regional, predomina la idea de un crecimiento insuficiente y fundamentalmente extensivo, de modo que los añejos argumentos regeneracionistas han sido reciclados en el debate sobre las causas del atraso relativo. Así, se ha discutido la responsabilidad como obstáculos al crecimiento de la geografía y condiciones ambientales, del sistema social y la desigual distribución de la renta, de la dimensión y articulación del mercado interno, de las políticas estatales (y en particular, del proteccionismo triguero) y de las actitudes empresariales. Con todo, la cuestión de si creció la productividad agraria, y cuánto lo hizo, permanece en gran medida abiertaFootnote 3.
En este trabajo se plantea revisar este problema desde una perspectiva regional, ceñida a la mitad sur de Navarra. El enfoque localizado es necesario ya que, por un lado, la agricultura española del siglo XIX era intrínsecamente plural, y por otro lado, las posibilidades de lograr avances significativos en una reconstrucción cuantitativa de las variables agrarias con las fuentes disponibles de cobertura estatal parecen poco probables. El objetivo es múltiple. Por un lado, se pretende reconstruir sendas series de índices de evolución de precios agrarios y de costes de los factores de producción. Por otro, se busca combinar esos dos indicadores a través de un cociente que relacione el crecimiento de los precios de productos y el de factores, para ensayar una aproximación –bien conocida en la literatura económica – al concepto de productividad total de los factores (TFP). No se trata tan sólo de replicar los ejercicios realizados para otros países, sino también de testar la validez de un modelo de equilibrio general como es éste en un contexto tan peculiar como la Navarra del siglo XIXFootnote 4.
Téngase en cuenta que, siguiendo a Jorgenson y Griliches, la tasa de crecimiento de la productividad total de los factores presupone una función de producción con retornos constantes a escala, precio de los factores igual a su productividad marginal y tasas de sustitución marginal de bienes igual a sus precios relativos, o lo que es lo mismo, un mercado de competencia perfectaFootnote 5. Cabe, por tanto, desconfiar de la idoneidad de este instrumento aplicado a una sociedad que sólo parcialmente podría ser considerada como una economía de mercado. Sabido es que una parte importante, aunque imprecisa, de la producción era destinada al autoconsumo (alimento, semilla, piensos) y que en cuanto a los factores, las necesidades de mano de obra eran satisfechas en gran medida por la fuerza de trabajo familiar, mientras que una parte de la tierra permanecía al margen del mercado como bienes vinculados y en manos muertas. Navarra presentaba además algunas particularidades institucionales como su estrecho y rígido marco aduanero y la pervivencia de mecanismos de tasa de precios y jornales. Sin embargo, no es menos cierto que la producción para el mercado era un hecho, incluso entre los pequeños propietarios, inclinados a cultivos comerciales como viñedos y huertas, al tiempo que las estructuras de propiedad de la tierra determinaban la existencia de una amplia bolsa de fuerza de trabajo susceptible de ser contratada a jornal y de un amplio mercado de alquiler de la tierra que, bajo contratos de arrendamiento a corto plazo, podía movilizar un tercio de la superficie cultivadaFootnote 6.
En las páginas siguientes se aborda, en primer lugar, la construcción de los dos índices de precios agrarios y coste de los factores. En la segunda sección se muestra la serie de productividad total de los factores que resulta de esos dos índices y se lleva a cabo un test de validez a partir de datos directos de alcance general. En la tercera sección, se contrastan estos resultados con algunos indicadores directos de la evolución de la productividad en algunas explotaciones concretas y se avanzan algunas hipótesis explicativas de la evolución de la curva en sus distintas fases.
1 Trama y urdimbre: las series de índices de precios agrarios y coste de los factores
Para calcular la productividad total de los factores debemos contar con series anuales de precios de diferentes productos y factores de producción, así como con sendas matrices de coeficientes de composición del producto y del coste total de producción. Las fuentes utilizadas son algunas contabilidades de patrimonios familiares, corporaciones eclesiásticas, ayuntamientos, carnicerías municipales y fundaciones benéficas. Para el cálculo se puede emplear la fórmula utilizada por Hoffman, que calcula separadamente un índice geométrico ponderado de crecimiento de los precios y otro de los costes, o bien seguir a Clark, que deflacta por separado los índices de evolución de cada uno de los factores como paso previo a su multiplicación. El resultado no varíaFootnote 7.
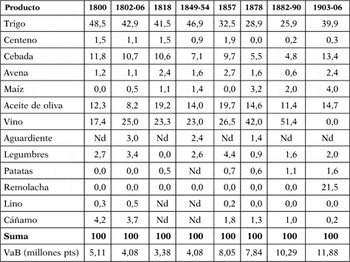
La primera cuestión que debemos plantearnos es qué mercancías deben entrar a formar parte del índice de precios agrarios y en qué proporción, para lo cual contamos con algunas informaciones sobre el producto agrícola en la comarca (cuadro 1). Aunque la fiabilidad de estas fuentes es muy desigual y las cifras globales que algunas de ellas ofrecen no merecen ninguna confianza, nos pueden servir, pese a todo, para dibujar la estructura interna del valor agrícola bruto (VaB)Footnote 8. Interesa destacar la relativa estabilidad en su composición durante la primera mitad del siglo y la alteración atestiguada desde 1854, cuando el vino pasó de suponer una cuarta parte del producto hasta alcanzar en la década de 1880 la mitad del mismo. El auge vitivinícola experimentado hasta 1896 (fecha en que fue declarada la epidemia de filoxera en la provincia) implicó una inversión en el peso relativo de los cultivos de ciclo anual respecto a los permanentes, en el que el vino reemplazó al trigo como producto principal. Algunas de estas fuentes ofrecen además información sobre producciones ganaderas, que nos permiten cifrar en un doce por cien su participación en el total del producto agrarioFootnote 9. Teniendo en cuenta estos cambios en la composición del producto se propone aquí un doble índice de precios agrarios y coste de los factores, empalmando dos índices geométricos de ponderaciones fijas en el año base 1856. Dada la estructura productiva que muestra el cuadro 1, contar con series de precios de nueve mercancías – trigo, cebada, alubias, patata, vino, aceite de oliva, carne de vaca, carnero y lana – nos permite dar cobertura a más del noventa por cien del producto agrarioFootnote 10.
COMPOSICIÓN DEL PRODUCTO AGRÍCOLA EN LA COMARCA DE TUDELA DE NAVARRA, 1800-1906
(Datos en porcentaje sobre el producto agrícola bruto valorado a los precios medios del quinquenio 1853-1857)

Fuentes: 1800 (Lana, Reference Lana1999: 142-146); 1802-06 (AGN, Reino, Estadística, legajo 49); 1818 (Yanguas y Miranda, Reference Yanguas and Miranda1828: 171-173); 1849-54 (Archivo Municipal de Tudela, Catastro); 1857 (estimación a partir de Sanz Baeza, 1859, pp.83-95); 1878 (AAN, DFN, cj. 40.979); 1882-90 (JCA, 1891a, 1891b, 1891c); 1903-06 (Lana, Reference Lana1999: 147-151)
Notas: VaB: Producto agrícola bruto valorado a los precios medios del quinquenio 1853-1857 y expresado en millones de pesetas.
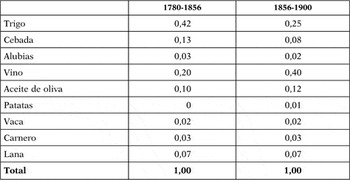
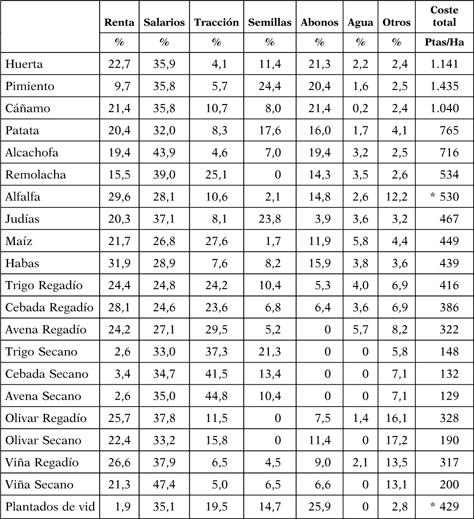
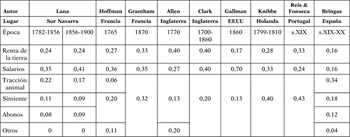
Por el lado del denominador han de tomarse igualmente decisiones acerca de las proporciones asignadas a los diferentes factores dentro del coste de producción. Para comienzos del siglo XX contamos con un conjunto de cartillas evaluatorias de extraordinaria calidad, que fueron confeccionadas por ingenieros en nómina de la Diputación provincial tras un exhaustivo trabajo de campo (cuadro 3). A falta de mejores fuentes para el siglo XIX, y habida cuenta del peso abrumador de los procedimientos manuales y del escaso contenido tecnológico que sugiere el utillaje descrito en estas cartillas, se propone tomar estos datos como base para ponderar la estructura del coste de los factores durante el siglo XIX. Esto no significa que no se produjeran algunos cambios técnicos o que la propia estructura de costes no se modificase al cambiar las proporciones entre cultivos herbáceos y leñosos. Teniendo en cuenta esto último y aplicando los porcentajes correspondientes a cada producto que obran en el cuadro 2, se han obtenido dos matrices de ponderaciones aplicables a los periodos anterior y posterior al año 1856Footnote 11. El resultado se ofrece en el cuadro 4, al lado de un conjunto de ponderaciones utilizadas por otros autores en ejercicios similares. Lo que pone de relieve este contraste es, en primer lugar, la validez de los coeficientes propuestos para Navarra, que se mantienen lejos de los valores extremos, y en segundo lugar, la cautela con que debemos abordar el uso comparativo de las cifras resultantes de estos ejercicios dadas las diferencias existentes a la hora de establecer las ponderaciones.
PONDERACIONES DEL ÍNDICE DE PRECIOS AGRARIOS, 1780-1900

Fuente: Elaborado a partir de CUADRO 1
PARTICIPACIÓN DE LOS FACTORES EN EL COSTE DE CULTIVO EN EL SUR DE NAVARRA HACIA 1905.
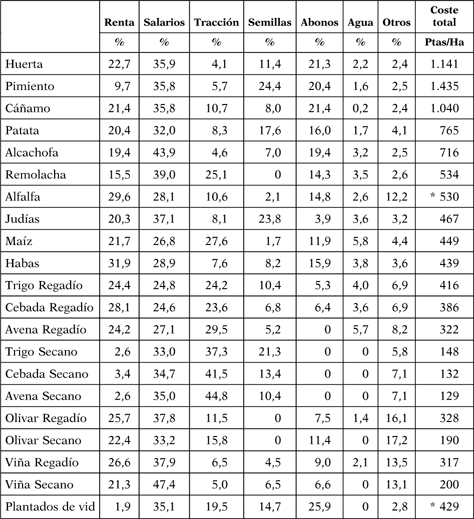
Fuentes: Cartillas evaluatorias confeccionadas y firmadas por el ingeniero agrónomo Florencio Roldán para Tudela (24-10-1905) y Cascante (31-8-1906), AGN, DFN, Catastro, cjs.16133-16151. Para el caso del viñedo se han manejado las cartillas evaluatorias de 1890 de Fustiñana, Tulebras, Ribaforada, Murillo el Cuende, Murillo el Fruto y Milagro. AGN, DFN, Catastro, cj. 16.131
Notas: *.- promedio de 6 años para la alfalfa; promedio de 3 años para los plantados de vid.
PONDERACIONES DE LOS FACTORES DE PRODUCCIÓN EN EL COSTE TOTAL DE CULTIVO SEGÚN DIFERENTES AUTORES Y PROPUESTA PARA EL SUR DE NAVARRA.

Fuentes: Hoffman (Reference Hoffman1996: 215); Grantham (Reference Grantham1996: 58); Allen (Reference Allen1992: 226); Clark (Reference Clark1999: 230); Gallman (Reference Gallman1972: 205); Knibbe (Reference Knibbe2006); Fonseca y Reis (2011); Bringas (Reference Bringas2000: 146); CUADRO 3.
El paso siguiente es el de reunir las series a las que se han de aplicar estos coeficientes de ponderación. El jornal diario común del peón de campo se ha escogido como representativo de los salarios, de modo que contamos con una serie homogénea en cuanto a la cualidad del trabajador y la duración de la jornadaFootnote 12. En el caso de la simiente se ha optado por emplear como indicador la serie de precios del trigo que forma parte ya del índice de precios agrarios. La serie referida al coste del equipo de tracción animal se ha podido elaborar gracias a las abundantes anotaciones de alquiler diario de yuntas que figuran en las cuentas de explotación, escogiéndose los datos referidos a la yunta de dos mulas (y desechando las de bueyes y asnos o tres o más animales) a fin de obtener una serie homogénea. El jornal de la yunta remunera el equipo de tracción en su conjunto, de modo que al lado de la fuerza de tiro animal se incluyen implícitamente los piensos necesarios para alimentarla, los cuidados veterinarios, herraje y esquileo, y el equipamiento (desde los atalajes a los remolques y arados), pero también incorpora la remuneración del factor trabajo correspondiente al conductor, por cuya razón se ha descontado del jornal de yunta el importe del salario diario del peón de campoFootnote 13.
Más complicado es construir un índice de coste de los fertilizantes. Siendo escasas y discontinuas las menciones a la compra de estiércol en las contabilidades privadas, se ha optado por una vía indirecta, aprovechando la anotación en las cuentas de ayuntamientos y carnicerías municipales de lo obtenido en las subastas del aprovechamiento del estiércol de los corrales de su propiedad. El inconveniente de la serie radica en que el arrendador de los fiemos podría no coincidir con el usuario de los mismos, y que por tanto no se trataría de precios al agricultor, sino de precios obtenidos por el intermediario. También hay que tener en cuenta que el precio de subasta puede en ocasiones reflejar, no la cotización del estiércol, sino la cantidad del mismo que cabía esperar obtener durante el periodo de arriendo habida cuenta del número de cabezas que se preveía alojarían los corrales. No obstante, los datos disponibles sobre el precio del estiércol por unidad de peso confirman en términos generales el movimiento de la curvaFootnote 14.
La última serie, la de la renta de la tierra, es la que presenta mayor complejidad. Lo habitual es encontrar en la documentación contable rentas pagadas en una cantidad estipulada de trigo por tierras de labor de regadío y secano. Las rentas en metálico son menos frecuentes, quedando circunscritas al alquiler de huertas, viñedos y pastos. Se ha seguido por ello la opción de construir nueve series de renta en especie con diferente recorrido temporal que han sido transformadas a números índices como paso previo a su empalme. Luego se ha traducido ese índice a términos físicos expresados en hectolitros por hectárea teniendo en cuenta la renta media que ofrecen siete series en 1859 (4,14 hls/ha)Footnote 15. Sobre esa serie se han calculado dos variaciones. La primera resulta de aplicar hasta 1840 un aumento del 12,5 por cien en concepto de diezmo y primicia. La segunda eleva esa cuantía tomando en cuenta las contribuciones ordinarias y extraordinarias, utilizando como referencia las pagadas por los marqueses de San Adrián en proporción a sus ingresosFootnote 16. Disponemos así de tres series alternativas de renta de la tierra que se pueden emplear en el ejercicio. En la medida en que las contribuciones al Estado corrían mayoritariamente a cuenta del propietario, se entiende aquí que esta exacción de renta agraria va ya incluida en la propia renta del suelo. No así en el caso del diezmo, que se superponía hasta 1840 sobre esa detracción. La serie que se empleará aquí, por tanto, es la que suma renta y diezmo, transformada a su valor monetario con la serie de precios del trigo como multiplicador.
2 ACCELERANDO … RITARDANDO. EL TEMPO DE LA PRODUCTIVIDAD TOTAL DE LOS FACTORES EN EL SUR DE NAVARRA, 1782-1900
Reunidas todas las piezas del puzzle, podemos aplicar la fórmula para estimar la productividad total de los factores. Tras estos cálculos se esconde una intuición relativamente simple: una mayor productividad también significa producir a un coste menor. Esto puede traducirse inicialmente en mayores beneficios para los agricultores más productivos, pero conducirían finalmente bien a rentas superiores para los terratenientes, bien a salarios más altos para los trabajadores agrícolas, bien a remuneraciones superiores para el capital agrícola, o bien a precios más bajos para los consumidores.
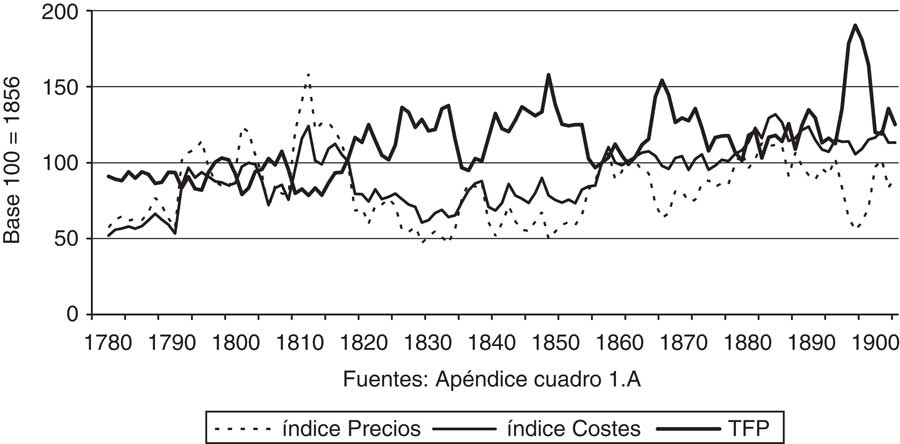
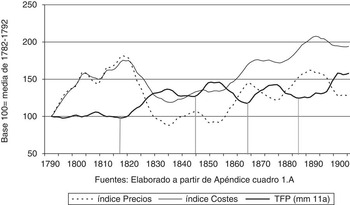
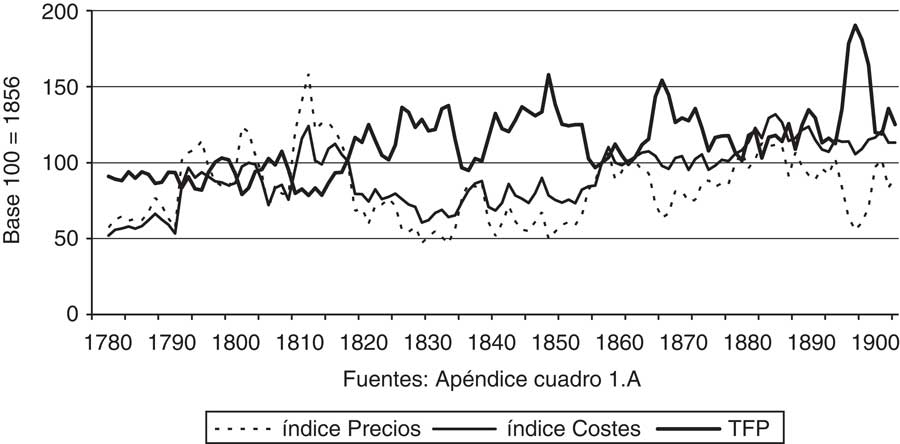
Los resultados pueden observarse en el gráfico 1, donde se recogen también la evolución del índice de precios del producto agrario y la del coste de producción. Los datos, de carácter anual, se presentan como números índices con base cien en el año 1856. Es fácil detectar a simple vista la relación existente entre el signo de la dinámica de precios y la dirección de la serie que identificamos con la productividad total de los factores. Durante el periodo inflacionario de las guerras de la Revolución y el Imperio francés (1792-1814), la serie TFP sigue una dirección a la baja, del mismo modo que ocurre durante la etapa de aumento de precios de la primera guerra carlista (1833-39) o durante los ciclos alcistas de 1854-64 y 1875-85. Por el contrario, las etapas de deflación de precios se saldan con importantes avances de la serie TFP, en particular entre 1815-1833, 1861-1866 y 1891-1895. La relación es más evidente si disponemos las series en forma de medias móviles de once años como se hace en el gráfico 2Footnote 17. Para mostrar de manera más clara la evolución de estas tres series a lo largo del tiempo se ha modificado el año base, de manera que los índices se refieren en este gráfico a la media aritmética de los años 1782-1792. La relación inversa entre la curva TFP y la de precios agrarios se revela prácticamente perfecta, y la inevitable pregunta es: ¿Refleja efectivamente la curva TFP una mejora en la eficiencia productiva o tan sólo nos está indicando el margen entre precios percibidos y precios pagados en que se mueve el productor?
ÍNDICES DE EVOLUCIÓN DE PRECIOS AGRARIOS Y COSTE DE LOS FACTORES EN EL SUR DE NAVARRA, 1782-1900(datos anuales, índice 100 = 1856)
ÍNDICES DE EVOLUCIÓN DE PRECIOS AGRARIOS, COSTE DE LOS FACTORES Y TFP EN EL SUR DE NAVARRA, 1782-1900(medias móviles de 11 años, base 100 = 1782-1792)

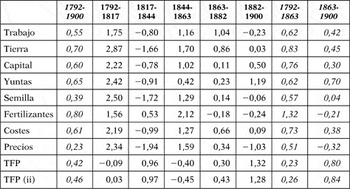
En el corto plazo no cabe duda de que la serie indica, de manera inversa, cómo evoluciona la rentabilidad de las explotaciones. La formación de los precios de los productos agrarios se verifica en un marco más abierto y fluido, lo que les confiere una mayor volatilidad, mientras que los precios de los factores, en especial los de la fuerza de trabajo y los de la tierra, necesitan más tiempo para ajustarse. De modo que a corto plazo la serie depende de los movimientos que experimentan los precios agrarios. Pero también es cierto que, observado en el largo plazo, el gráfico está reflejando necesariamente una mejora en el uso de los factores. Si el coste de éstos creció entre 1792 y 1900 a un ritmo anual del 0,61 por cien (cuadro 5) y los precios agrarios tan sólo aumentaron a razón de un 0,23 por cien por año, es inevitable pensar que las explotaciones que operaban en 1900 eran mucho más productivas que las de cien años atrásFootnote 18.
TASAS DE CRECIMIENTO ANUAL (%) DE PRECIOS AGRARIOS Y COSTES DE LOS FACTORES EN EL SUR DE NAVARRA, 1792-1900 (estimados a partir de medias móviles de 11 años fechadas en el último)

Fuentes: Vid.anexo
Notas: (ii) Se ha calculado, a efectos meramente informativos, una serie alternativa de TFP incluyendo junto a la renta de la tierra y el diezmo las contribuciones, aunque en esta región éstas quedaban por regla general a cargo del propietario.
Ahora bien, ¿Cómo debemos interpretar ese 0,42 por cien anual de crecimiento de la TFP en el sur de Navarra entre 1792 y 1900? ¿Es mucho o es poco? La búsqueda de términos de comparación ha de hacerse con suma cautela. Como ya se ha señalado, pese a la aparente similitud de los índices TFP con los que contamos, la diversidad de métodos de cálculo empleados (productos, precios y ponderaciones elegidas) puede llevarnos a comparar cosas distintas. Limitémonos a señalar que el dato de Navarra coincide a grandes rasgos con la estimación que realizó Bringas para el conjunto de España con distinta ponderación de factoresFootnote 19, y también que podría situarse en una posición intermedia entre los pobres resultados del Alentejo portugués y las tasas estimadas para algunas regiones de Francia y Gran BretañaFootnote 20. Más que la cuantía de la tasa, quizás resulte revelador contrastar los movimientos y tendencias de la curva que dibuja la TFP en distintas regiones. Y en este sentido hallamos una cierta coincidencia entre regiones tan diferentes como las Midlands inglesas estudiadas por Allen, la Frisia analizada por Knibbe, el Rouen de Le Goff y Sutherland y el Alentejo de Fonseca y Reis, donde se percibe, con diferencias de grado e intensidad, un deterioro de la TFP en las dos últimas décadas del siglo XVIII y la primera del XIX, seguido de un impulso ascendente tras las guerras napoleónicas, que en el caso inglés alcanzó al 3,4 por cien anual entre 1814 y 1838Footnote 21.
El cuadro 5 incluye también las tasas de crecimiento anual de estas variables para cinco subperiodos definidos por otros tantos ciclos que se detectan en el recorrido de la serie TFP. Hay que destacar que se toman como punto de partida y llegada de cada etapa los valores mínimos de estos ciclos (1817, 1844, 1863 y 1882), desechando las cimas (1834, 1850, 1874). De este modo se evita sobrevalorar el crecimiento de la productividad, al tomar como referencia los sucesivos suelos por debajo de los cuales ya no vuelve a descender la curva. Así, en lugar de destacar el intenso crecimiento de la serie TFP entre 1817 y 1834 (dos por cien anual), nos quedamos con una tasa más modesta pero segura del 0,96 % anual entre la primera fecha y 1844. El cuadro permite además detectar qué factores respondieron mejor a los estímulos del crecimiento y cuáles mostraron mayor rigidez, entorpeciendo su avance. Entre estos últimos debemos incluir los fertilizantes, cuyo coste creció a un ritmo del 0,80 por cien anual, por encima del coste de alquiler de la tierra (0,70 por cien por año) y del equipo de tracción (0,65 por cien), y a gran distancia del factor trabajo (0,55 por cien) y de la semilla de trigo (0,39 por cien).
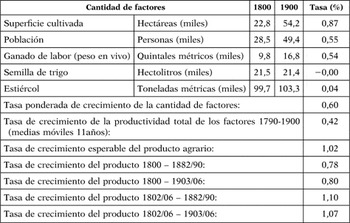
Con el fin de validar los datos obtenidos, podemos ensayar un test a partir de cifras aportadas por otras fuentes. Los resultados, que se circunscriben a la comarca de Tudela, se sintetizan en el cuadro 6. A partir de información de origen catastral se ha estimado tanto la superficie cultivada como la fuerza de tracción animal (expresada en peso en vivo) y el estiércol disponibleFootnote 22. En el caso de la fuerza de trabajo se ha tomado como indicador el tamaño de la población en 1797 y 1900, ya que determinar la cuantía de los activos agrarios masculinos y femeninos presenta dificultades insalvables y la comarca se mantuvo como un espacio poco industrializado. Por último, se ha estimado la cantidad total de semilla de trigo teniendo en cuenta los rendimientos medios por simiente en cada fecha. Se ha considerado un rendimiento tipo de 1:5 para 1800, y en consecuencia una reserva de simiente de cada cinco, uno. Sobre la cosecha de 1800 ello representaría 21,5 miles de hectolitros (para la cosecha media de 1802-06 el dato sería de 21,6 si suponemos, teniendo en cuenta las malas cosechas de esos años, un rendimiento de 1:3,5). Para final de siglo se han manejado los rendimientos medios proporcionados por las cartillas evaluatorias de 1890 (1:7,7 en regadío y 1:5,35 en secano) y de 1905 (1:10,9 en regadío y 1:5,9 en secano) que permiten calcular un monto de semilla de trigo de 16,9 miles de hectolitros para 1882-90 y de 25,9 miles de hectolitros en 1903-06. Se ha atribuido a 1900 el promedio de ambas cifras (21,4 miles hls), de modo que resulta un inesperado ahorro en este factorFootnote 23.
ESTIMACIÓN DE LAS TASAS DE CRECIMIENTO ANUAL DE LA DOTACIÓN DE FACTORES Y DE LA TASA ESPERABLE DE INCREMENTO DEL PRODUCTO PARA LA COMARCA DE TUDELA, 1800-1900

Fuentes: Estimado a partir de Lana (Reference Lana1999: 91-151)
Si asumimos los órdenes de ponderación para los factores que figuran en el cuadro 4, la tasa media de incremento de la cantidad de factores de producción asciende a un 0,60 por cien anual. Si a esta cifra añadimos el 0,42 por cien que creció la TFP entre 1790 y 1900 encontramos que el aumento del producto que debió haberse registrado se sitúa en el 1,02 por cien. Las tasas de crecimiento del producto agrícola que podemos estimar a partir de los datos del cuadro 1 se mueven entre 0,78 y 1,10 por cien. Resulta así validado a través de este test el resultado obtenido por la vía de los precios. El ejercicio confirma además el comportamiento observado en los precios de cada uno de los factores. El mayor encarecimiento relativo de los fertilizantes cuadra perfectamente con el hecho de que la cantidad de estiércol disponible por hectárea de cultivo hubiese disminuido en un -0,83 por ciento anual. El que la tracción animal disponible por hectárea hubiese disminuido en un -0,33 por cien por año conforma también con que el jornal de las yuntas se hubiese encarecido relativamente más que la mano de obra. Por último, que los precios del trigo –al mismo tiempo simiente y alimento – hubiesen aumentado en una menor proporción a pesar de las tensiones provocadas por el crecimiento demográfico y la extensión de la superficie sembrada es coherente con el ahorro de semilla empleada por unidad de superficie labrada que permite estimar el cuadro 6, nada menos que un -1,1 por cien anual.
3 ¿QUÉ NOS DICEN LOS INDICADORES DIRECTOS DE PRODUCTIVIDAD?
El resultado obtenido deja como poso algunos interrogantes: ¿Resulta creíble esta distribución temporal del crecimiento de la productividad total de los factores? ¿No estaremos padeciendo una ilusión óptica a causa de la naturaleza de los mercados en que tenía lugar la formación de los precios de mercancías y factores? En concreto, el sólido avance del indicador entre 1817 y 1844, ¿no vendrá sesgado por el hecho de que la revolución liberal que acontece entre esas fechas transforma sustancialmente unos mercados que hasta entonces no eran plenamente competitivos? Y de creer lo que sugiere el indicador, ¿Qué fuerzas hicieron crecer la productividad total de los factores? ¿Por qué la curva presenta en las décadas centrales del siglo un carácter cíclico tan marcado? ¿Qué es lo que impidió durante la segunda mitad del siglo un avance más decidido de este indicador?
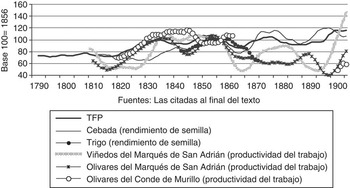
Algunas claves se encuentran en el gráfico 3, que recoge algunos indicadores directos de productividad reconstruidos a partir de la documentación contable. Inevitablemente son indicadores parciales y limitados, que aquí se expresan como números índices en media móvil de once años con la base cien en 1856, de modo que su recorrido pueda ser comparado con el de la TFP. Abarca dos conjuntos de series: en primer lugar, se ofrecen los rendimientos de cosecha por unidad de semilla en el caso de la cebada y, con un número menor de observaciones, el del trigoFootnote 24; en segundo lugar, se presentan tres series con la productividad física del trabajo en algunos viñedos y olivares de Monteagudo y Cintruénigo, obtenida del cociente entre cosecha y peonadas contratadasFootnote 25. Aunque existen diferencias importantes en todas estas curvas, se detectan también puntos en común que refuerzan la credibilidad de la serie. Durante la primera mitad del siglo XIX se percibe un doble movimiento de descenso de los indicadores en las dos primeras décadas y de fuerte impulso alcista en los veinte años siguientes. Durante la segunda mitad del siglo se marca también con nitidez una sucesión de ciclos con diferente intensidad. Cabe destacar especialmente el hecho de que los desfallecimientos cíclicos de la curva de la productividad total de los factores que se perciben en torno a 1835-1845, 1854-1864 y 1874-1884 son también identificables en los rendimientos por semilla de los cereales y en la productividad del trabajo en los viñedos y, en menor medida, en los olivares. Pero tal vez lo más relevante de este cotejo es que permite confirmar el fuerte impulso de la productividad que tuvo lugar entre 1817 y 1850, así como los mediocres resultados de la segunda mitad del siglo.Footnote 26
INDICADORES PARCIALES DE PRODUCTIVIDAD EN ALGUNAS EXPLOTACIONES AGRÍCOLAS DEL SUR DE NAVARRA, 1790-1900(medias móviles de 11 años, Base 100 = 1856)

Pero, de nuevo, ¿Cómo explicar estos resultados? Comencemos por recordar una obviedad. Los altos precios de venta del producto estimulan la inversión y el consumo, mientras que la deflación induce a recortar gastos y ahorrar. Esto se puede traducir en un empleo más generoso de factores en el primer caso, mientras que en el segundo caso se impone la necesidad de ajustar un uso eficiente de esos factores. Para las explotaciones que operan con mano de obra asalariada el factor clave en este sentido es la fuerza de trabajo. En años de buenos precios tenderían a contratar más trabajadores mientras que en condiciones de precios a la baja buscarían reducir jornales. Para las explotaciones familiares, sin embargo, el factor que ocuparía esa posición estratégica sería el capital. Los buenos años permitirían acceder a crédito y ampliar el uso de bienes de capital, mientras que los precios bajos obligarían a ajustar ese empleo. El factor tierra jugaría para estas explotaciones una función diferente y ajena a los ciclos, ya que tanto en condiciones de precios altos como de precios bajos la disponibilidad de una mayor cantidad de tierra mejoraría la eficiencia en el uso de la fuerza de trabajo familiar, al elevar la ratio trabajo/tierra. Para las grandes explotaciones, sin embargo, el factor tierra tendría un componente pro-cíclico, de modo que la inflación estimularía la ampliación de la superficie labrada, y consecuentemente la contratación de mano de obra, mientras que la deflación induciría a su abandono, bien mediante su conversión a pastizales, bien mediante su cesión a renta. En suma, el uso de los factores en las explotaciones con mano de obra asalariada sería siempre pro-cíclico, con el trabajo como clave de bóveda, mientras que en las explotaciones familiares tan sólo el uso del capital sería pro-cíclico, tendiendo a ser el de tierra y trabajo más bien anti-cíclico. Sobre este esquema básico hay que superponer el marco institucional y sus transformaciones a lo largo de este periodo. Y en esto el quid radica, como es sabido, en el factor tierra. Las constricciones que el sistema feudal establecía sobre la utilización y movilidad de este factor no son probablemente ajenas al estancamiento de la productividad que muestra la curva TFP, como tampoco lo será la ruptura de ese marco institucional para el crecimiento posteriorFootnote 27.
La deflación que siguió a las guerras napoleónicas afectó de modo diverso a grandes y pequeñas explotaciones. Las primeras se vieron estimuladas a economizar jornales en sus plantaciones o bien a traspasar el coste del ajuste a la agricultura familiar mediante arrendamientos y censos reservativos y enfitéuticos. Las segundas se vieron forzadas a ahorrar capital y a presionar políticamente para aumentar la superficie labrada con el fin de incrementar la cantidad de producto comercializado o, por el contrario, de garantizarse un refugio viable en el autoconsumo. Así es que las ganancias de productividad que refleja la curva tuvieron lugar mayormente en un contexto de avance de la agricultura familiar y de retroceso de la gran explotación con mano de obra asalariada; un esquema que volvió a repetirse en las dos últimas décadas del siglo.
Pero, ¿cuáles fueron los medios a través de los que se aumentó la productividad entre 1817 y 1850? Algunos se han detectado ya gracias a la documentación contable de grandes explotaciones. Las plantaciones de olivares, y más tarde también los viñedos, se hicieron más eficientes en el uso del factor trabajo. Y también en el de la tierra.Footnote 28 Esto no sucedió de repente, sino que fue el resultado de mejoras introducidas desde finales del siglo XVIII. Un marco de plantación más denso y nuevas variedades, como el empeltre (un olivo que requería ser injertado), explican el aumento de la producción por hectárea. Si esto no se tradujo en el uso de más fuerza de trabajo fue por la introducción de algunas prácticas de cultivo (nuevos sistemas de poda y de cava y entrecava) que permitían ahorrar jornales en las tareas más voluminosas. La respuesta de las pequeñas explotaciones es documentalmente más incierta, pero conocemos con seguridad tres hechos: el primero, la ampliación de la superficie regada, gracias a algunas obras modestas y al aprovechamiento de aguas sobradas; el segundo, la difusión de nuevos cultivos en las rotaciones del regadío, como la patata, el maíz y, más tarde, la alfalfa; el tercero, la puesta en cultivo de tierras vírgenes que proporcionaron elevados rendimientos durante unos años.Footnote 29
El avance de los rendimientos en el cereal pudo también proceder de cambios poco perceptibles y poco costosos en las prácticas de cultivo, como un laboreo más cuidadoso, el tratamiento de la semilla con soluciones alcalinas para prevenir enfermedades, la siembra a mayor profundidad o un marco de siembra menos densoFootnote 30. Esto último pudo tener particular importancia. Páginas atrás se ha señalado la paradoja de que, según nuestra estimación, la cantidad de semilla empleada en la comarca se redujo a pesar de la ampliación de la superficie sembrada. Precisamente los tratados de agronomía, sobre todo desde 1830, insistieron en la posibilidad y conveniencia de ahorrar semilla, sintetizándolo en una fórmula proverbial que facilitaba su difusión: “Quien siembra claro, recoge espeso”Footnote 31. La respuesta en rendimiento de grano a variaciones de densidad de siembra ha sido, en efecto, descrita como una curva parabólica, dado que a partir de un cierto umbral se impide macollar adecuadamente a la planta, reduciendo el número de tallos y de espigas obtenidas por metro cuadrado.Footnote 32 Esto ofrecía un amplio margen de mejora tan sólo con aproximarse al óptimo de la curva en la densidad de siembra, con la ventaja añadida de permitir aminorar los riesgos y de ahorrar el medio de producción más escaso en la agricultura del siglo XIX: el capital circulante. Tampoco podemos desechar la posibilidad de que se difundieran semillas de mayor rendimiento, a pesar de que los indicios apuntan a una estabilidad en el mapa de variedades de trigo entre 1818 y 1877. La extendida creencia en que las semillas degeneraban y en que era conveniente su sustitución periódica por granos traídos de otras localidades más o menos alejadas ofrecía una oportunidad para su sustituciónFootnote 33.
La década de 1850 supone un punto de ruptura en la evolución de la productividad. El contexto sociológico había para entonces cambiado. Los hacendados, con las nuevas oportunidades abiertas en España por la desamortización, la creciente urbanización y la inversión en ferrocarriles y banca, habían recobrado la iniciativa perdida en los años veinte, apostando de nuevo por el cultivo directo y la transformación industrial de materias primas agrícolas como la uva y la aceituna en bodegas y almazaras renovadas con destino a los mercados nacional y exterior.Footnote 34 Un cultivo más esmerado y unas inversiones más ambiciosas – auspiciadas por la expansión y mejora del mercado de créditoFootnote 35– no parecían ser una elección errónea, al menos hasta que pudo cobrarse conciencia a finales del siglo de la creciente competencia internacional. Lo cierto es que ese esfuerzo no se tradujo en una mejora sustancial y sostenida de la eficiencia productiva. En parte ello se debió a factores exógenos. Las décadas de 1850 y 1880 fueron testigos de una sucesión calamitosa de fenómenos atmosféricos y de epidemias letales sobre las cosechas (oidio y mildew en la vid, y negrilla -Capnodium elaeophilum- en el olivo) y sobre la fuerza de trabajo (el cólera morbo).Footnote 36 Pero ello no puede ocultar que parecía haberse alcanzado un techo tecnológico y organizativo del que los mejores exponentes son, en primer lugar, la recurrencia de los ciclos que podemos asociar a los rendimientos decrecientes de las tierras roturadas en sucesivas oleadas, y en segundo lugar, el fortísimo ascenso del precio de los fertilizantes (2,12 por cien anual en 1844-63) y de las yuntas (1,19 por cien en 1882-1900) (cuadro 5). Esto último demuestra hasta que punto los mercados de bienes de capital se encontraban sometidos a presión durante esos años y lo comprometido que se hallaba el mantenimiento de los niveles de productividad del suelo. La oferta industrial de fertilizantes químicos terminaría por romper ese bloqueo desde la última década del sigloFootnote 37, pero para entonces el escenario social había vuelto a cambiar. Muchos hacendados habían renunciado al cultivo directo y habían apostado de nuevo por una estrategia rentista, confiados en que los costes de producción recaerían sobre la familia del arrendatario y en que las ventajas de los precios garantizados por el arancel proteccionista continuarían favoreciéndole.
4 Conclusiones
En este texto se ha ensayado una metodología poco utilizada hasta el momento en la historia agraria española y no exenta de críticas desde diversas posiciones. Se ha apostado por aprovechar la solidez de las series de precios construidas a partir de fuentes contables de cobertura regional para ensayar una aproximación a la evolución de la productividad total de los factores durante el siglo XIX. El balance resulta satisfactorio. La curva de TFP resultante parece coherente con lo que apuntan otras informaciones e indicadores que no toman los precios como base, de modo que la metodología escogida parece adecuada dadas las circunstancias en que se ha aplicado.
Los resultados fortalecen además la idea de que el sector agrario creció durante el siglo XIX y de que una parte muy destacada de ese crecimiento tuvo lugar durante el oscuro periodo que siguió al fin de las guerras napoleónicas. La novedad reside en que ese crecimiento, además de venir acarreado por una ampliación extensiva de los factores de producción (en especial de la tierra), responsables de tres quintas partes del aumento del producto, se debió también en parte a una mejora de la eficiencia en el uso de los factores, que aportó los dos quintos restantes. Como resortes concretos que permitieron esa vía intensiva se pueden citar la expansión y cambios de prácticas en los cultivos leñosos, cuya productividad laboral se elevó después de 1815, una consolidación y modesta ampliación del regadío, incluyendo la difusión de nuevas plantas (patata, maíz, alfalfa), y el ahorro de semilla en el cultivo de cereales, que redujo riesgos y mejoró el uso del capital circulante. Ese crecimiento, con todo, no tuvo lugar a través de una secuencia sostenida, sino que padeció repetidos desfallecimientos con periodos de recuperación y aceleración de diferente intensidad. Tan destacable como la solidez del avance en la productividad entre 1790 y 1900 (0,42 por cien anual) resulta la naturaleza fuertemente cíclica del mismo a mediados del siglo XIX y el techo que pareció alcanzarse en ese momento. El comportamiento de los precios de los distintos insumos permite atribuir a la oferta de fertilizantes y de tracción animal un papel muy destacado en los mediocres resultados que muestra la curva durante la segunda mitad del siglo XIX.
Ha de quedar necesariamente como incógnita hasta qué punto el resultado obtenido en este ejercicio es extrapolable a otras zonas de la Península. La comarca presenta algunos rasgos (baja densidad de población relativa, moderadas pendientes, hidrografía favorable, vías de comunicación) que hacían factible un proceso de especialización y colonización interior que no se daban en otras partes del país. En cualquier caso, determinar la representatividad del caso analizado debería servir de estímulo para profundizar y extender el análisis a otras regiones en las que el mercado como mecanismo de asignación de recursos tuviese igualmente presencia.
Apéndice
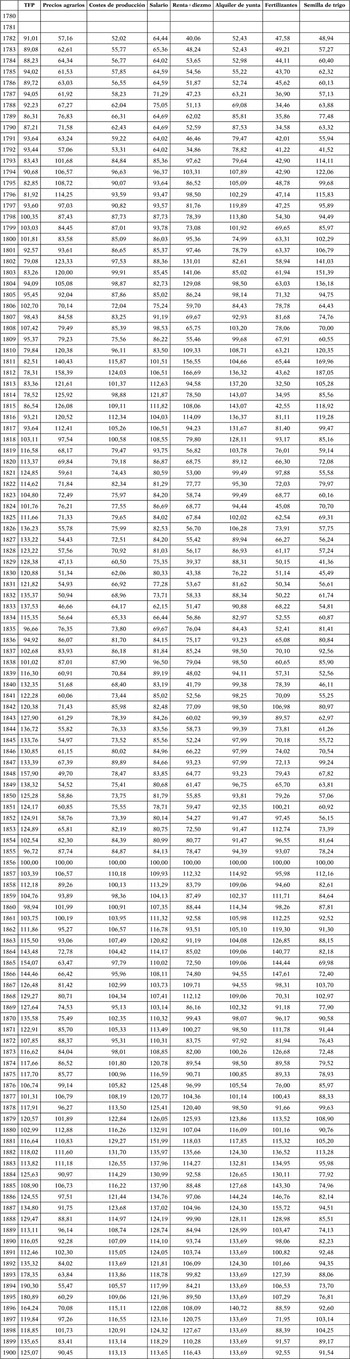
Números índices de precios agrarios, costes de producción y productividad total de los factores en la agricultura del sur de Navarra, 1782-1900 (1856 = base 100 y cambio de ponderaciones)

Fuentes: Las detalladas al final del texto.