Introduction
Key argued in Southern Politics in State and Nation that, in the absence of a formal two-party structure, Southern voters in the early 1900s supported the local favorite and elected candidates based on residency, coining the term “friends-and-neighbors” voting – or “localism” – to describe this phenomenon (Reference Key1949, 37). In a recent study, Panagopoulos et al. (Reference Panagopoulos, Leighley and Hamel2017) deployed a nonpartisan field experiment to examine whether “friends-and-neighbors” voting mobilizes citizens to vote in contemporary elections by randomly informing voters in the 2014 Democratic primary elections for state senate in Massachusetts about the candidates’ home towns and counties. The authors viewed place of residence as a social identity that becomes salient when local candidates are on the ballot and argued that localism cues operate much like party, race, and other heuristics in affecting voting behavior in part because voters maintain and value attachments to their places of residence and take these attachments into consideration when evaluating candidates and voter turnout (Panagopoulos, Leighley, and Hamel Reference Panagopoulos, Leighley and Hamel2017, 868).
Place-based social identities can be complex. Sociologists and social psychologists have argued that individuals generally comprise multiple, often nested, and situational identities (Brewer Reference Brewer1993, Reference Brewer1999; Calhoun Reference Calhoun and Calhoun1994; Lawler Reference Lawler1992; Medrano and Guttierez Reference Medrano and Gutiérrez2001; Tajfel Reference Tajfel1981, Reference Tajfel1982; Turner Reference Turner1975) that can be activated by stimuli that variably heighten the salience of one or another identity. These reactions trigger connections that cause individuals to alter references or associations with specific in- or out-groups (Lawler Reference Lawler1992; Tajfel Reference Tajfel1981, Reference Tajfel1982; Turner Reference Turner1975). In our case, voting decisions could be shaped by persuading voters to support local (in-group) candidates or by mobilizing voters to vote, presumably for local candidates, but it remains an open question whether references to candidates’ town or county ties should be more (or less) influential. The experimental results reported in Panagopoulos, Leighley, and Hamel (Reference Panagopoulos, Leighley and Hamel2017) suggest voters are mobilized at higher rates when they are informed that candidates reside in their home counties, but not necessarily in their home towns. The authors speculated that such a finding is potentially explicable by Granovetter’s (Reference Granovetter1973) claim that “weak ties,” such as those that may be found in home counties, may be more influential than “strong ties,” or those in home towns, because the former lead to widespread diffusion of information while the latter only recirculate information. Subsequent research has confirmed that weak ties more effectively diffuse novel information that would not have otherwise spread (Bakshy et al. Reference Bakshy, Rosenn, Marlow and Adamic2012; Constant, Sproull, and Kiesler Reference Constant, Sproull and Kiesler1996; Cross and Cummings Reference Cross and Cummings2004; Levin and Cross Reference Levin and Cross2004; Morrison Reference Morrison2002). While this is a plausible explanation, alternatives are also conceivable. For example, scholars disagree about whether (and under what conditions) individuals would tend to identify more so with smaller, or “lower-order” groups (e.g., towns), or with larger, “higher-order,” or “superordinate,” collectives (e.g., counties) (Lawler Reference Lawler1992; Calhoun Reference Calhoun and Calhoun1994). In fact, different identities may play different roles for individuals at different times (Calhoun Reference Calhoun and Calhoun1994). Brewer (1999, 190) argues, for example, that, in certain cases of two, nested identities, the superordinate identity satisfies the need for secure inclusion in a large collective, while the subgroup identity serves the need for distinctiveness within the larger social category (see also Medrano and Guttierez Reference Medrano and Gutiérrez2001). But under certain conditions, like heightened salience, identification with larger, “higher-order” collectives (e.g., counties) can be engendered (Lawler Reference Lawler1992). It is also possible that higher-order (county) identities are less well-developed, compared to “lower-order,” shared, local (town) associations, and that activating the former by raising their salience in voters’ minds would result in greater responsiveness. These claims support the notion that shared, geographic identity overall likely influences voting decisions, but hypotheses about whether town or county links should exert greater impact are less clear. The experimental results we report below allow us to address some of these possibilities empirically, but we concede a complete adjudication of these mechanisms is beyond the scope of our study.
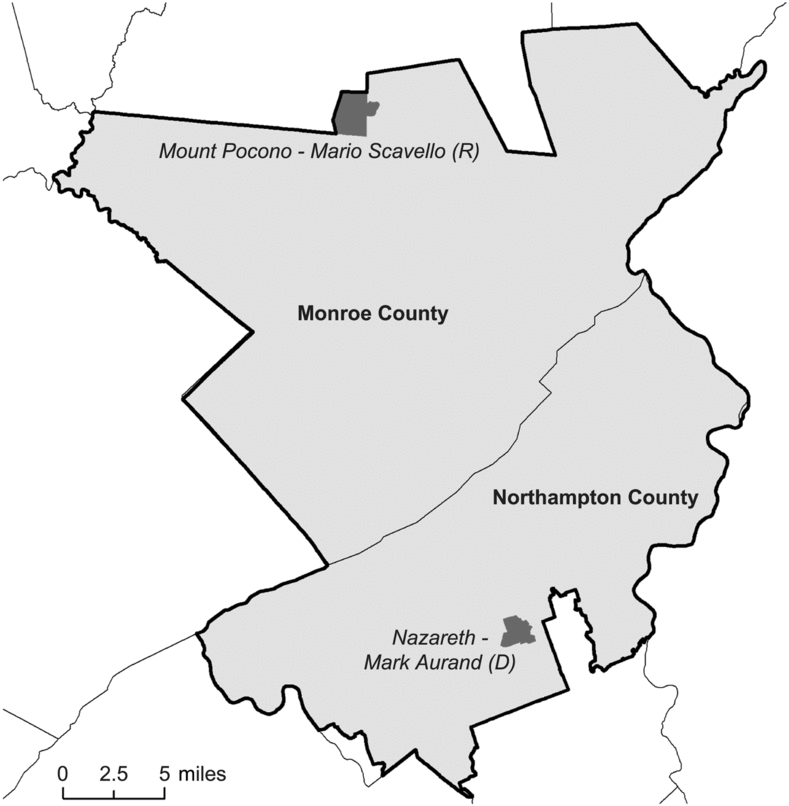
The current study builds upon Panagopoulos, Leighley, and Hamel (Reference Panagopoulos, Leighley and Hamel2017) by reporting the results of a randomized field experiment designed to test the impact of localism cues in the 2014 general elections for state senate in Pennsylvania (see Figure 1). Several modifications enable us to extend this line of inquiry to a partisan setting, which potentially boosts external validity because such communications are more typical in political campaigns, but the design also has some limitations discussed below. We note that Key’s (Reference Key1949) original argument related to primary elections, while subsequent research on “friends-and-neighbors” voting has focused almost exclusively on general elections (Aspin and Hall Reference Aspin and Hall1987; Brunk, Ramesh, and Adams Reference Brunk, Ramesh and Adams1988; Dudley and Rapoport Reference Dudley and Rapoport1989; Garand Reference Garand1988; Holbrook Reference Holbrook1991; Kjar and Laband Reference Kjar and Laband2002; Lewis-Beck and Rice Reference Lewis-Beck and Rice1983; Meredith Reference Meredithn.d.; Mixon and Tyrone Reference Mixon and Tyrone2004; Rice and Macht Reference Rice and Macht1987a, Reference Rice and Macht1987b; Tatalovich Reference Tatalovich1975). The Panagopoulos, Leighley, and Hamel (Reference Panagopoulos, Leighley and Hamel2017) experiment conducted in the Massachusetts primary elections was designed as a direct application of Key’s (Reference Key1949) original argument, but the current study was implemented in a general election to better discriminate between the role of turnout in “friends-and-neighbors” voting in primaries and general election contexts. Of course, Key’s (Reference Key1949) theory also predicts that candidates will be elected on the basis of residency when there do not exist significant policy differences between the candidates. In the context of a general election, this assumption is less likely to hold because candidates typically represent different political parties, if not occupying different positions on an ideological spectrum.
In addition, our experimental design permits us to examine whether the mobilizing effects of localism might transcend beyond traditional county lines and be an effective mechanism for mobilizing turnout in other (neighboring) counties. Specifically, we investigate whether providing localism cues to likely Democratic voters residing in the county of the opposing (Republican) candidate is associated with higher turnout. Because legislative districts typically extend beyond county lines, it is useful to consider whether localism effects can be observed beyond the home county – and in a context in which the opposing candidate should hold an advantage in terms of localism.
Experimental Design
Setting
Due to the partisan nature of our study, we partnered with the Democratic Legislative Campaign Committee (DLCC) to conduct a large-scale experiment during the November 2014 general election in Pennsylvania’s 40th State Senate district. Following the 2010 redistricting cycle and prior to the 2014 election, the district was moved from Allegheny county to Monroe and Northampton counties (Pierce Reference Pierce2013). In some ways, we view this as an advantage, since we expect voters’ prior knowledge about the candidates’ local ties was relatively limited, enabling our interventions to convey novel information to subjects. Such a possibility is consistent with work showing voter information levels are considerably lower after redistricting cycles. McKee (Reference McKee2008), for example, shows that redrawn voters – those living in a district with a new incumbent – are considerably less likely to be able to name their representative (see also Desposato and Petrocik Reference Desposato and Petrocik2003).
District Map (Pennsylvania Senate District 40).
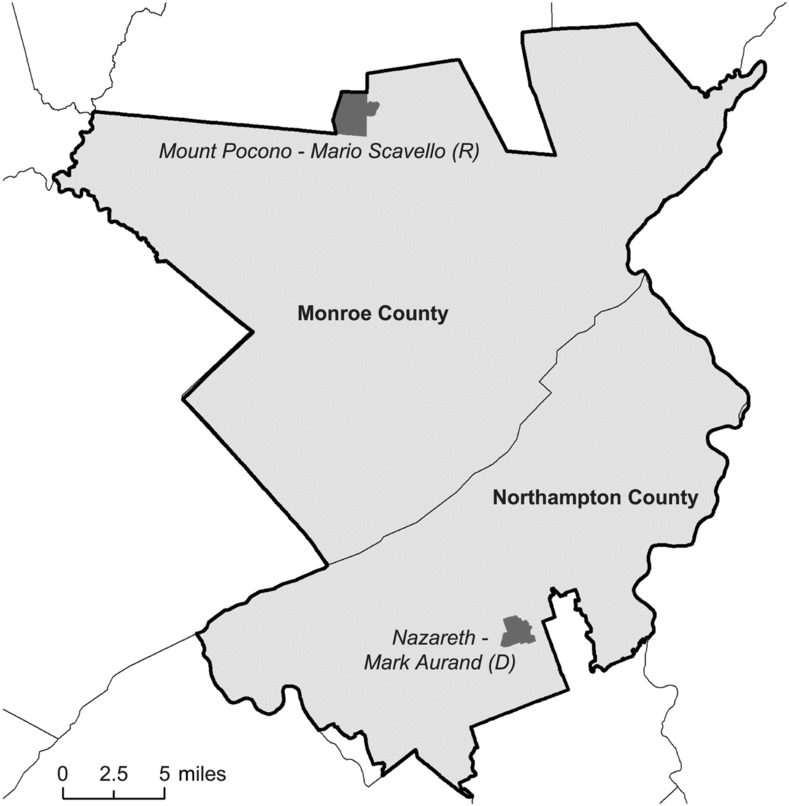
The election featured Democratic nominee Mark Aurand, a resident of the town of Nazareth, located in the county of Northampton, and Republican nominee Mario Scavello, a resident of the town of Mount Pocono, located in the county of Monroe. Aurand was a local attorney having never previously sought elective office, and Scavello was a long-time member of the Pennsylvania House of Representatives. Although this race was an open seat, technically featuring two nonincumbent candidates, we note Scavello held prior elective office, while Aurand was a political newcomer. As such, knowledge about Scavello may have been more prevalent, but details about Aurand would have likely been more informative. Political observers had identified the race to be likely to be competitive, but Scavello ultimately won handily with 59% of the vote on Election Day. Scavello captured 60% of the vote in Aurand’s home county (Northampton) and, a nearly identical, 59% of the vote in his home county (Monroe).
Treatments
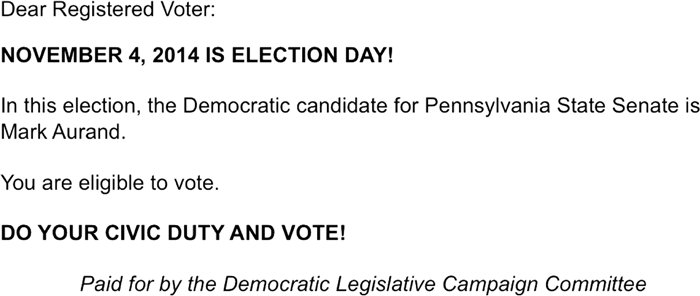
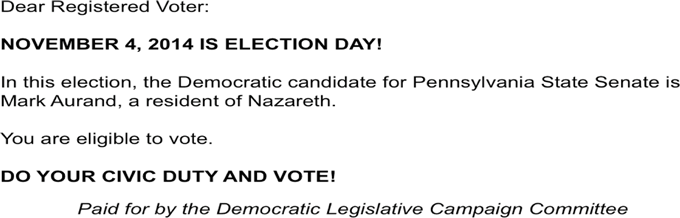
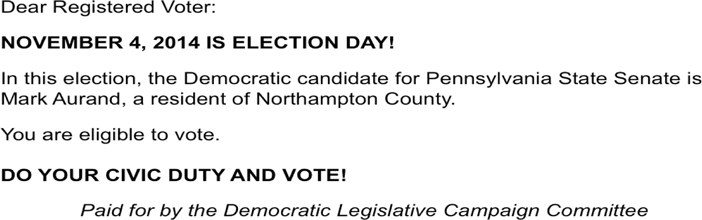
Subjects were randomly assigned to treatment groups described below that received mailings similar to those used in Panagopoulos, Leighley, and Hamel (Reference Panagopoulos, Leighley and Hamel2017). Unlike the original study, which presented information about both of the candidates in the Democratic primary contest in Massachusetts, our postcards mentioned only the Democratic candidate (Aurand) and urged voters to vote in the election. One postcard treatment added Aurand’s town of residence (Nazareth), while another featured his home county (Northampton) but did not mention the town. A third version of the postcard mentioned only the Democratic candidate’s name and was included primarily to serve as a placebo test to ensure that the treatment effects are a result of information about the candidate’s place of residence rather than receiving a more general postcard reminder. All postcards also mentioned the fact that Aurand was the Democratic candidate. No postcards were mailed to subjects assigned to control groups. Consistent with Panagopoulos, Leighley, and Hamel (Reference Panagopoulos, Leighley and Hamel2017), voters assigned to the treatment groups were sent mailings (4″ × 6″ black-and-white postcards) the week prior to the election. (See Appendix for postcard treatment details).
Sample
A total of 20,387 registered voters in the district who resided in one of two counties (Northampton or Monroe) were included in the experiment. The sample included voters identified by the DLCC as part of a “get-out-the-vote” (GOTV) universe comprised of voters who had been previously contacted by the Democratic party and identified as both likely to vote and likely to support the Democratic candidate for the state legislature.Footnote 1
Notably, the sample was comprised of individuals whose baseline voting propensity was high, a consideration that was not taken into account in Panagopoulos, Leighley, and Hamel (Reference Panagopoulos, Leighley and Hamel2017). Combined with the challenge of uncovering effects in a race where significant policy differences likely existed implies the current study likely represents a more conservative test of turnout as a mechanism. Accordingly, any evidence of effects on turnout would suggest strong support for the role of localism in turnout decisions.
The sampling frame we adopt also differs from Panagopoulos, Leighley, and Hamel (Reference Panagopoulos, Leighley and Hamel2017) in several ways that enable us to extend the line of inquiry. We randomly assigned nearly equal numbers of voters residing in single-voter households in each of two counties (blocks) in the district to experimental conditions: one county was selected to be the candidate’s county of residence (Northampton), while the other was the home county of the Republican candidate (Monroe). A total of 10,140 registered voters in Northampton county, including 2034 in Aurand’s hometown of Nazareth, and 10,247 in Monroe county were included in the experiments.
A total of 7500 subjects in Aurand’s home county of Northampton were assigned with equal probability to one of the three postcard treatment conditions described above. Because our theoretical expectations compel us to anticipate hometown effects to be most pronounced in the candidate’s home county, we relegated more subjects to the treatment conditions in this block. We did not expect to find much evidence of localism effects in Monroe, so, due to resource constraints, we assigned fewer subjects (1000 to each of the three treatment conditions) to be treated here. Still, the inclusion of subjects in the out-county allows us to investigate how localism operates in this context.
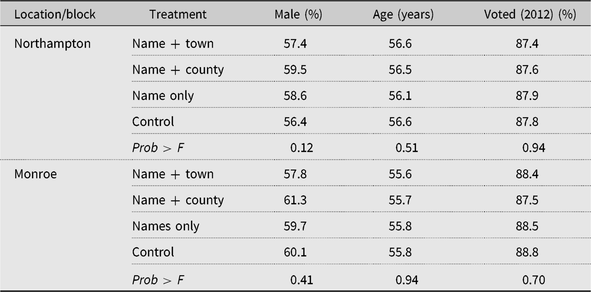
The experimental samples also included 2640 control subjects in Northampton and 7247 control subjects in Monroe. We note the treatment groups in Northampton represent more than a 10-fold increase in the number of treatment subjects relative to the Panagopoulos, Leighley, and Hamel (Reference Panagopoulos, Leighley and Hamel2017) study and a considerable boost in statistical power to detect effects with greater precision. Sample characteristics and statistical tests that confirm balance with respect to available, pretreatment attributes across experimental conditions (within blocks) are presented in Table 1.
Balance Tests
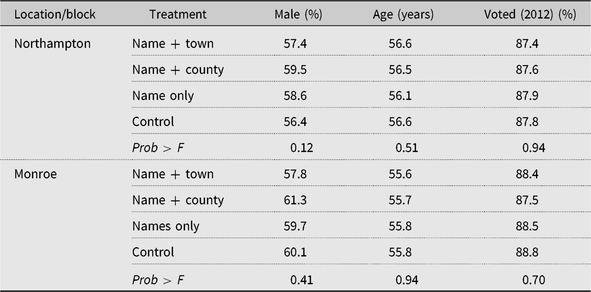
Notes: Test statistics generated using one-way ANOVA to evaluate whether mean levels differ across categories of random assignment. In all cases, the hypothesis of equal means cannot be rejected at conventional significance (p < 0.05) levels, implying balance across groups.
Despite these features, we concede the nature of the experimental sample described above has some limitations. Since the sample is comprised of likely Democratic voters, the sample lacks meaningful variation in partisan or ideological proclivity, which limits our ability to make claims about who can be mobilized to vote with a “friend-and-neighbor” on the ballot in a general election. As such, we are unable to explore whether the turnout response to the Democratic candidate’s geographic connections differs between Democratic copartisans and Republicans. We also acknowledge it is conceivable that subjects in our experiment were responsive mainly to (co)partisan rather than localism cues, since, as we describe below, all of the treatments we deployed explicitly noted Aurand’s party affiliation. As a result, our experiments are incapable of adjudicating this possibility entirely.
Results
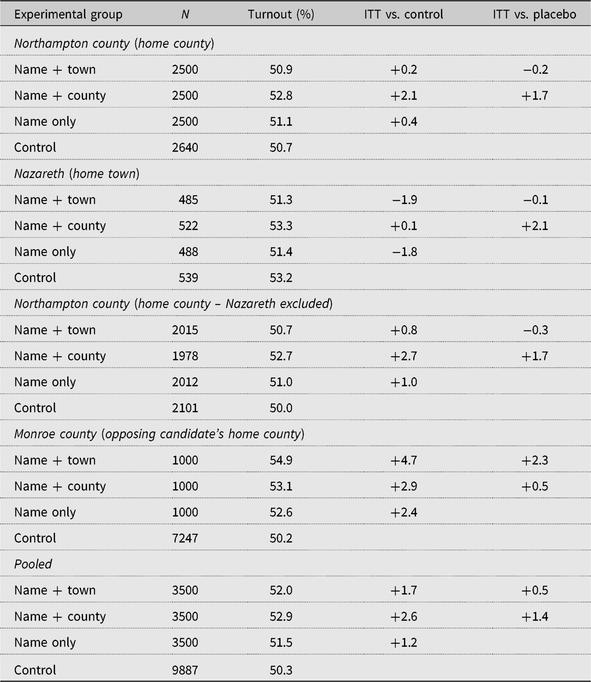
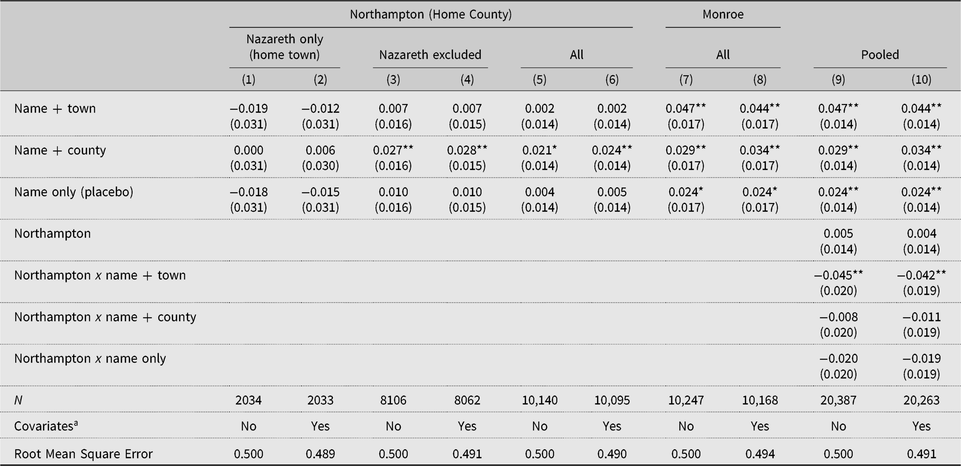
The outcome measures used in the analyses that follow are validated, individual voting records obtained from the official voter files in the corresponding election jurisdictions. The experimental results are presented in Table 2. Our discussion begins with Northampton, Aurand’s home county. In this county overall, 50.7% of voters in the control group voted in the election. The turnout rate among voters assigned to receive the placebo mailing that mentioned only the candidate’s name was 51.1%, representing a statistically-insignificant average treatment effect of 0.4 percentage points compared to the control condition. Among voters assigned to receive the version of the postcard that mentioned the candidate’s hometown along with his name, turnout was 50.9%, implying statistically insignificant intent-to-treat (ITT) effects of +0.2 percentage points compared to the control group and −0.2 percentage points compared to the placebo (name only) condition. Accordingly, we find little evidence that mentioning Aurand’s hometown of Nazareth influenced turnout among Northampton voters overall in our sample. By contrast, turnout among those Northampton voters assigned to receive a postcard indicating that Aurand resided in the same county was 2.1 percentage points higher, on average, compared to the control condition, and 1.7 percentage points higher on average compared to the placebo condition.
Basic Experimental Results
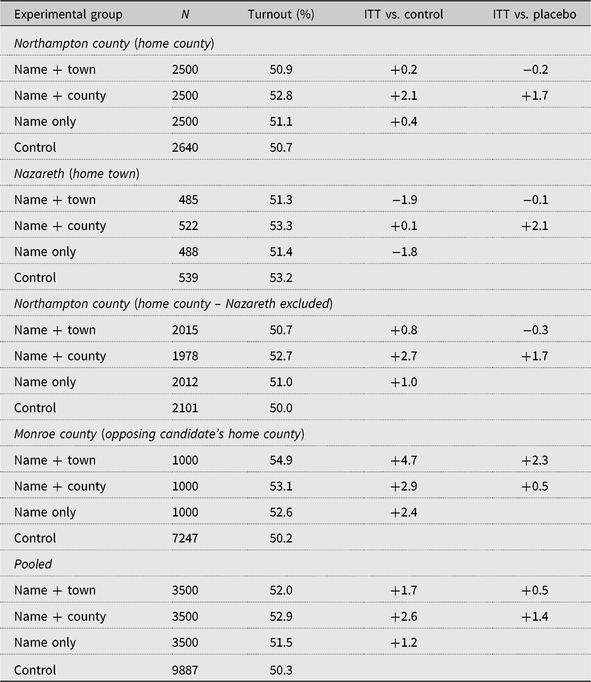
Restricting the analysis to voters in the sample who were registered to vote in Nazareth, Aurand’s hometown, reduces the statistical power of our study to detect effects, but suggests some compelling patterns. There is virtually no evidence that informing voters that Aurand lives in either the same town or the same county influences turnout in the election, relative to the control condition. In fact, turnout in the “Name Only” and “Name + Hometown” conditions was considerably lower than in the control condition, but these effects were not statistically significant at conventional levels, suggesting null effects. One potential explanation for these null results is that awareness of Aurand and his home-town status was already quite widespread, even saturated, in his home town, so our intervention’s capacity to provide meaningful, new information to subjects was limited. Notwithstanding this possibility, additional evidence is needed to support this contention.
Among subjects who reside in Northampton county but outside of Nazareth, only the treatment that mentioned Aurand’s home county significantly raised turnout (by about 3 percentage points on average) compared to the control condition, which suggests these voters were responsive to localism cues that heightened the salience of their shared, county identity. Despite the fact that Nazareth is also situated in Northampton county, an inference subjects who received the “town” version of the postcard could have adduced, the disjuncture in residential towns may have been an impediment to triggering notions of shared, county identity.
Turning next to examining the experimental results in Monroe county, we find evidence that mentioning both the candidate’s hometown and home county stimulates turnout relative to both the control and placebo conditions. In fact, the treatment version that mentioned the candidate resided in Nazareth raised turnout by 4.7 percentage points on average among voters in Monroe, relative to the control condition, an effect that is both substantively and statistically significant, and by 2.3 percentage points on average relative to the placebo condition. The results also show that postcards mentioning only the candidate’s name and party (the placebo condition) elevated voting rates by 2.4 percentage points on average, compared to subjects who were not assigned to receive mailings.
In some ways, the Monroe findings reported above run in contrast to theoretical expectations developed more fully in Panagopoulos, Leighley, and Hamel (Reference Panagopoulos, Leighley and Hamel2017). Because the Democratic candidate had no geographic tie to the county, we expected to find small or null effects in Moroe, especially in light of the fact that Scavello resided there. But the geographical information we provided related only to the Democratic candidate,Footnote 2 so it is possible we did not fully capture voters’ consideration of candidate geography in the decision to vote. An alternative explanation for the results we observe is that, absent any information that sensitized subjects to shared, geographic identity, voters in Monroe were reacting to the informational or partisan cues imbedded in the treatments rather than to localism cues. After all, as we discuss above, individuals generally represent constellations of multiple, overlapping, or nested identities (Lawler Reference Lawler1992; Medrano and Guttierez Reference Medrano and Gutiérrez2001; Tajfel Reference Tajfel1981, Reference Tajfel1982; Turner Reference Turner1975), which can be triggered variably by various stimuli to influence behavior (Lawler Reference Lawler1992). Such an interpretation is supported by the fact that all three interventions elevated turnout significantly in Monroe county, relative to the control condition, and the differences across the three treatment effects are statistically indistinguishable (p = 0.55). Alternatively, “friends-and-neighbors” voting may have been operational in Monroe. Key (Reference Key1949) argued that candidates in Southern Democratic gubernatorial elections relied on “friends-and-neighbors” vote in their home and neighboring counties. In an extensive study of general elections, Gimpel et al. (Reference Gimpel, Karnes, McTague and Pearson-Merkowitz2008) confirm this point and interpret the “friends-and-neighbors” vote share effect as a function of distance: as the distance between the candidate’s home county and other counties within the state increase, the candidate’s share of the vote will decrease. Given this, it is possible that what is true for vote shares is also true for voter turnout. Thus, our findings in Monroe county may simply reflect the possibility that voters recognize the importance of candidate local ties, but also take into account the spatial dimension or (relatively short) geographical distance between Nazareth and their respective locales. After all, the maximum distance from Aurand’s home town for voters included in our study was 42 miles; the mean distance from Nazareth among voters residing outside of Aurand’s home town in Northampton county in our sample was 10 miles, while subjects in Monroe resided about 25 miles from Nazareth on average.Footnote 3
Table 2 also presents pooled results which reveal the county treatments to generate the strongest effects overall, although we note both of the other treatments also raised turnout relative to the control group. Both the “town” and “county” treatments also raised turnout (by 0.5 and 1.4 percentage points on average, respectively) relative to the placebo condition as well. We observe, however, that referencing Aurand’s home town generally resulted in lower voting rates on average, compared with mentioning the candidates’ home county, a finding that is consistent with patterns reported in Panagopoulos, Leighley, and Hamel (Reference Panagopoulos, Leighley and Hamel2017).
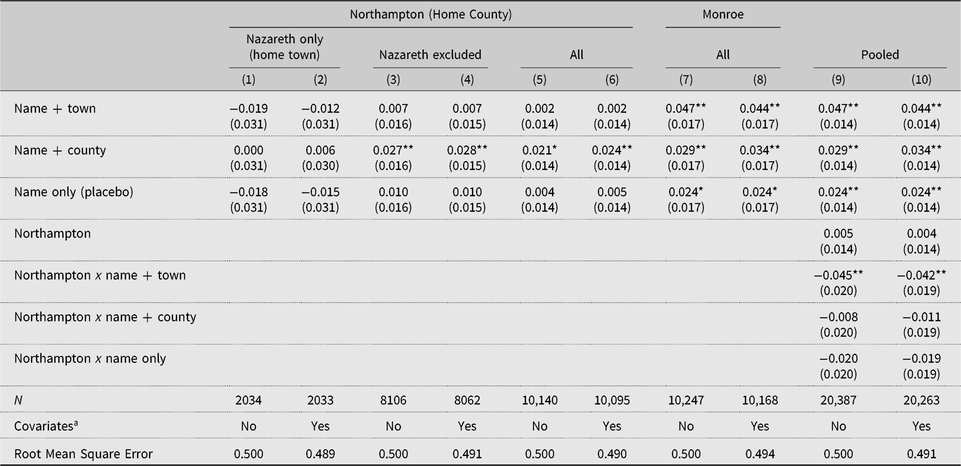
Using regression to estimate the treatment effects, both with and without the inclusion of covariates, in a manner that parallels the approach applied to the Panagopoulos, Leighley, and Hamel (Reference Panagopoulos, Leighley and Hamel2017) experiment reinforces the patterns described above (Table 3).Footnote 4 As expected, the inclusion of covariates changes the estimates only trivially and does not affect the substantive interpretation of the results. The pooled analyses indicate the effects of the “town” treatment were significantly lower in Northampton, compared to Monroe, relative to the control condition; we emphasize this finding runs counter to our expectations. The effects of the other two versions of the treatment are not statistically distinguishable across experimental sites, however, relative to the control condition.
Experimental Results (OLS Regression)
Notes: Pooled models in use inverse-probability weights to account for different probabilities of assignments to experimental conditions.
a Covariates: age, gender, voted in November 2012.
* p < 0.10.
** p < 0.05, one-tailed tests.
Conclusion
Scholars have altered and extended Key’s (Reference Key1949) argument that friends-and-neighbors provide “local” candidates an advantage, especially in low-information elections. In doing so, they have found evidence for this local effect across electoral contexts. However, there has been little scholarly consensus on what precisely drives the observed increase in local vote share. One potential explanation is that candidates are able to mobilize voters on the basis of shared, geographic identity. Panagopoulos, Leighley, and Hamel (Reference Panagopoulos, Leighley and Hamel2017) provide causal evidence of such an effect, but the study also reports nuance in impact. In the current study, we bolster the precision with which treatment effects are estimated and external validity by conducting a large-scale, field experimental test using partisan messaging in two counties in Pennsylvania during the November 2014 general election for State Senate.
Consistent with Panagopoulos, Leighley, and Hamel (Reference Panagopoulos, Leighley and Hamel2017), we find only mixed evidence that indicating candidates’ home towns, along with their names and party affiliation, on blandishments to vote causes citizens to vote at higher rates. In contrast, we detect more consistent evidence across the board that identifying candidates’ home counties (rather than home towns) enhanced participation in the elections. The effect of referencing candidates’ home counties appears to be robust, at least compared to voters who were not assigned to receive mailings in our study, across the range of experimental settings, including in neighboring communities that lie beyond the towns and counties in which the target candidate in our study resided, at least among voters favorably disposed to a candidate (in our case, the Democrat) and even when these voters reside in the home county of the opponent. Although the differences in effect sizes between the county treatments and the other interventions are generally murky and statistically imprecise, the preponderance of the evidence is at least suggestive of the fact that subjects were most responsive, perhaps for various reasons, to county-based appeals. This finding is somewhat unexpected, but, in part because it reinforces findings reported in Panagopoulos, Leighley, and Hamel (Reference Panagopoulos, Leighley and Hamel2017), we speculate further about some conceivable explanations. Shared, higher-order (county) identities, for instance, may naturally be less accessible (or familiar) to voters so that activating associations with, or references to, such identities may be more impactful that mentioning shared lower-order (town) identities (Lawler Reference Lawler1992; Medrano and Guttierez Reference Medrano and Gutiérrez2001). With respect to the finding we observe in the out-county (Monroe), where shared local identity is presumably elusive, we note that voters in the neighboring county may have been responsive to partisan rather than localism cues imbedded in our interventions. Another possibility is that voters in Monroe may have been mobilized to vote at higher rates against Aurand, the geographically incongruent candidate, in favor of the local contender (Scavello). Although further evidence is necessary to investigate this possibility, we hesitate to embrace this explanation, given the partisan predispositions in our sample. Still another, intriguing explanation is that Monroe voters, informed that Aurand resided outside of the county, may have realized he was geographically disadvantaged and voted at higher rates to counteract this liability in order to bolster the viability of their preferred candidate. Additional evidence is needed to explore this possibility more fully, but we note that such an explanation would rest on voters’ assumptions that localism shapes voting decisions, lending further credence to the claims about “friends-and-neighbors” voting we engage. Admittedly, some of these explanations are post hoc, and our study is ill-equipped to adjudicate between the potential mechanisms that give rise to the effects we observe, but we are intrigued by these possibilities and believe subsequent research to shed light on these questions is warranted.
The magnitudes of the turnout effect sizes we observe also have important substantive implications. At the lower end of the spectrum, effect sizes in the range of 2–4 percentage points are already 4–8 times as powerful as a generic mailer (Green and Gerber Reference Green and Gerber2008; Reference Green and Geber2015). If such boosts in effectiveness can be achieved simply by providing some basic information about candidates’ home towns or counties, this is of enormous consequence for both theoretical and practical reasons.
While this study parallels some of the experimental protocols established in Panagopoulos, Leighley, and Hamel (Reference Panagopoulos, Leighley and Hamel2017) and extends analysis of the effects to a general election context, other questions regarding how the observed effects could differ in alternative contexts remain unanswered. Do the results generalize to all voters, including out-partisans or Republicans? Would they operate similarly in other electoral settings? Such questions about the external validity of the findings can only be addressed through further experimentation, replication, and extension.
Appendix: Treatment Versions: Pennsylvania Partisan Replication Study
Name + Town
Name + County
Name Only