INTRODUCTION
Decapod crustaceans are important fishery resources of high socio-economic importance. In addition, their ecological importance is highly relevant due to their abundance, diversity and the different roles they occupy in the food web, that change through their life cycle and development. Most decapod crustaceans present meroplanktonic larval stages that differ from both the juveniles and adults and that constitute the dispersal phase that connects subpopulations (Cameron, Reference Cameron1986).
The research centre Marine Scotland in Aberdeen (UK) is conducting since 1997, an ecosystem monitoring programme to generate a long term time-series of plankton data and environmental variables. Part of this programme are the Stonehaven station, in the North Sea waters off north-east Scotland and the Loch Ewe station in a sea loch in the north-west of Scotland. Recently, Bresnan et al. (Reference Bresnan, Hay, Hughes, Fraser, Rasmussen, Webster, Slesser, Dunn and Heath2009) have analysed the first 10 years of Stonehaven data, studying the seasonality of the phytoplankton community and detecting an increasing trend in temperature and salinity at that site. Temperature has been ascribed as one of the main factors influencing plankton larval productivity and its importance on decapods is well recognized (Lindley, Reference Lindley1987; Anger, Reference Anger2001). In the North Sea, the abnormally mild temperatures registered during 1988–1989 were related to the earlier occurrence of several species of decapods in the plankton in Continuous Plankton Recorder (CPR) samples (Lindley et al., Reference Lindley, Williams and Hunt1993). Analyses of long term time-series from CPR data in the North Sea, where an increase of sea surface temperature (SST) has been detected (Kirby et al., Reference Kirby, Beaugrand, Lindley, Richardson, Edwards and Reid2007), have shown a strong positive relationship between SST and the abundance of decapod larvae (Kirby et al., Reference Kirby, Beaugrand and Lindley2008).
Most of the information available on decapod larvae in Scottish waters has been provided by the CPR surveys of the Sir Alastair Hardy Foundation for Ocean Science (SAHFOS), which provides the world's longest time-series on zooplankton. The CPR surveys are, however, mostly restricted to offshore and oceanic waters (Lindley, Reference Lindley1987), and no other studies on decapod larvae in Scottish coastal waters were found in the literature, despite the economic importance of decapods in Scotland.
In general, the annual cycle of zooplankton in temperate waters is characterized by an abundance peak in the late spring, extending into the summer, followed by a secondary peak in the autumn (Raymont, Reference Raymont1963; Siokou-Frangou, Reference Siokou-Frangou1996; Valdés & Moral, Reference Valdés and Moral1998). The relatively high phytoplankton biomass in spring, fuelled by high winter levels of nutrients and increasing light and water temperature, is reduced during the summer by nutrient depletion and herbivore grazing. At the end of the summer, when increased mixing makes nutrients more available again, there is often a secondary peak in primary and secondary production (Bot et al., Reference Bot, van Raaphorst, Batten, Laane, Philippart, Radach, Frohse, Schultz, van den Eynde and Colijn1996). This general zooplankton pattern has been also observed in decapod larvae in temperate waters: Rees (Reference Rees1955) in several locations in the North Sea; the Mediterranean coasts of France (Bourdillon-Casanova, Reference Bourdillon-Casanova1960) and Spain (Fusté, Reference Fusté1982) or the Portuguese coasts (dos Santos, Reference dos Santos1999).
In this study, a time-series of weekly data on total abundance of decapod larvae in coastal waters from Stonehaven and Loch Ewe has been analysed, investigating the annual abundance cycle, the differences between the locations studied and the environmental factors that affect their abundance and occurrence in the meroplankton. It was expected to obtain reliable statistical models to explain the patterns observed. These patterns were also contrasted to the general cycle of zooplankton in temperate waters and to the patterns observed for decapod larvae in other geographical areas.
MATERIALS AND METHODS
Sampling sites
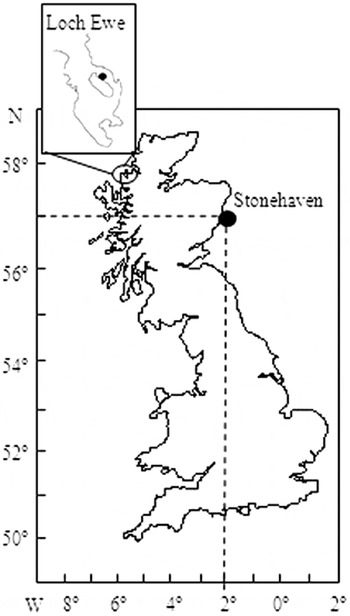
The Stonehaven site (north-east of Scotland, 56°57.8′N 02°06.2′W) is located 5 km offshore and the seabed substrate is mainly hard sand and rocky outcrops; the water depth is 48 m. Due to the shallow depth, strong tidal flow and the effect of wind the water column remains well mixed for most of the year, apart from some brief periods of thermal stratification in summer (Otto et al., Reference Otto, Zimmerman, Furnes, Mork, Saetre and Becker1990). The Loch Ewe site (north-west of Scotland, 57°50.14′N 005°36.61′W) is located in an open sea loch, near the Isle of Ewe at a sheltered location (Figure 1). The depth is about 40 m and the seabed substrate is fine sand and mud.
Map of the study areas. Inset figure in the map represents Loch Ewe. Black dots indicate sampling sites.

Sample collection
Weekly plankton samples were collected with a Bongo net of 40 cm mouth opening and 200 µm mesh size. The net was hauled vertically at ~20 m min−1 from just above the seabed, approximately 45 m depth in the case of Stonehaven and 35 m in Loch Ewe. The samples were preserved on-board in 4% borax buffered formaldehyde. On each sampling day, temperature and salinity were measured by a conductivity–temperature–depth cast, and with digital reversing thermometers on Niskin bottles, sampling two depths at 1 m near the surface, and near the bottom at 45 m in Stonehaven, and at 35 m in Loch Ewe. Since no flowmeter was initially fitted to the net, filtered volume was estimated from vertical distance towed (45 m and 35 m for Stonehaven and Loch Ewe respectively) and net mouth area (0.125 m2). Based on prior experimentation, these estimates were adjusted assuming 70% filtration efficiency for the 200 µm net.
Sample and data analysis
We analysed 386 plankton samples from Stonehaven, from 8 years of sampling (January 1999–December 2006), and 247 samples from Loch Ewe, from 4 years and 8 months sampling (April 2002–December 2006), estimating the total decapod larval abundance (individuals m−2).
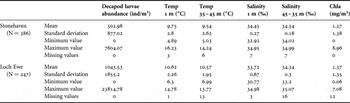
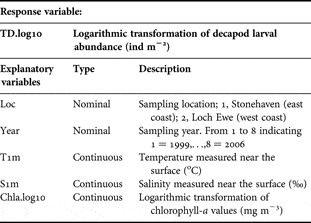
Initial analyses showed high colinearity between temperature measured near the surface and near the bottom in the two sites (Pearson correlation coefficient = 0.96). The correlation between salinity at the surface and at the bottom was also high (Pearson correlation coefficient = 0.60). Therefore, it was decided to use in the analyses only the data corresponding with the measurements taken near the surface, since these data presented fewer missing values. A summary of the data is presented in Table 1. A logarithmic transformation was applied to the decapod larval abundance and chlorophyll-a due to the large variation in the data. The variables employed in the analyses are presented in Table 2.
Summary of Stonehaven and Loch Ewe data. The mean, standard deviation, maximum and minimum values registered and missing values for the decapod larval abundance and the environmental variables used in the analyses are indicated: temperature and salinity measured at 1 m and at 35 m in Loch Ewe and at 45 m in Stonehaven and chlorophyll-a (Chla) concentration (N, number of samples analysed).

Summary of the response and explanatory variables used in the analyses, their units and the codes employed.

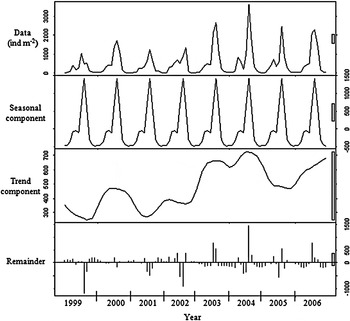
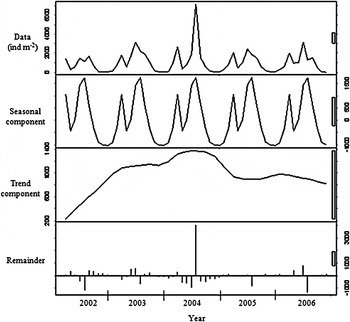
The time-series data of larval abundances from Stonehaven and Loch Ewe, using monthly averages, were decomposed into their seasonal, trend and remainder (the residuals from the seasonal plus trend fit) components (Figures 2 & 3).
Decomposition of total abundance data (ind m−2) of decapod larvae from Stonehaven. Monthly averages were used. From top to bottom: raw data; seasonal component; trend component; remainder component (residuals from the seasonal plus trend fit).

Decomposition of total abundance data (ind m−2) of decapod larvae from Loch Ewe. Monthly averages were used. From top to bottom: raw data; seasonal component; trend component; remainder component (residuals from the seasonal plus trend fit).

The heterogeneity of variance and temporal autocorrelation observed in the abundance data led to the decision to apply mixed modelling techniques. The generalized least-squares (GLS) function was applied following the protocol presented in Zuur et al. (Reference Zuur, Ieno, Walker, Saveliev and Smith2008). In order to solve the temporal dependence problem among observations, the best auto-regressive moving average (ARMA) process was found and incorporated into the model. To resolve the heterogeneity problem, the optimal residual variance structure was determined (Pinheiro & Bates, Reference Pinheiro and Bates2000; Zuur et al., Reference Zuur, Ieno, Walker, Saveliev and Smith2008). Once the most appropriate variance covariance and correlation structures were selected (those with lower Aikaike information criterion (AIC) values) and incorporated in the model (representing the random component of the mixed model), the likelihood ratio test was used for model selection to find the optimal fixed component, comparing nesting models using the maximum likelihood (ML) estimation method. The optimal model obtained was refitted with the restricted maximum likelihood (REML) estimation method and model validation was carried out.
Several analyses were performed: (1) to study the total abundance of decapod larvae from Stonehaven; (2) to study the total abundance of decapod larvae from Loch Ewe; and (3) to compare both locations. In the latter case, due to the difference in the number of observations per location, the data for Stonehaven from 1999 until April 2002 were excluded; otherwise both locations could not be compared. All the analyses were performed using R (R 2.6.0) (R Development Core Team, 2007).
RESULTS
Environmental data
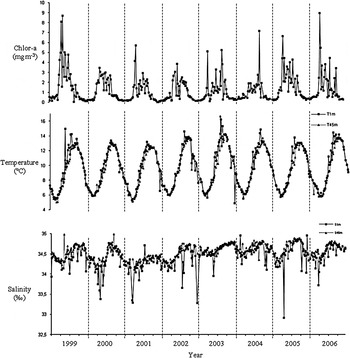
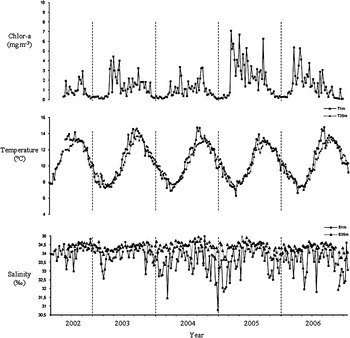
The seasonal cycles of temperature, salinity and chlorophyll-a for Stonehaven and Loch Ewe are presented in Figures 4 and 5 respectively.
From top to bottom: chlorophyll-a values (mg m−3); temperature (°C) at surface (squares) and at 35 m (dotted line with triangles); and salinity (‰) at surface (squares) and at 35 m (dotted line with triangles) in Stonehaven. Weekly measurements were taken from January 1999 until December 2006.

From top to bottom: decapod larval abundance (ind m-2); chlorophyll-a values; temperature (°C) at surface (squares) and at 35 m (dotted line with triangles); and salinity (‰) at surface (squares) and at 35 m (dotted line with triangles) in Loch Ewe. Weekly measurements were taken from April 2002 until December 2006.

Statistically significant differences in temperature and salinity were found between sites, but not between years at either location (Table 3). The average temperature for Stonehaven was one degree lower than that at Loch Ewe (9.75 and 10.62°C respectively); although the Stonehaven maximum (16.23°C, recorded in July 2003) was higher than the maximum recorded in Loch Ewe (14.78°C in August 2006) (Table 1). At the Stonehaven site the water column remains well mixed and no major short term fluctuations in temperature or salinity were found. The sea loch site at Loch Ewe is more enclosed and freshwater inputs from run off and river have more influence. Salinity fluctuations are more evident mainly at the surface.
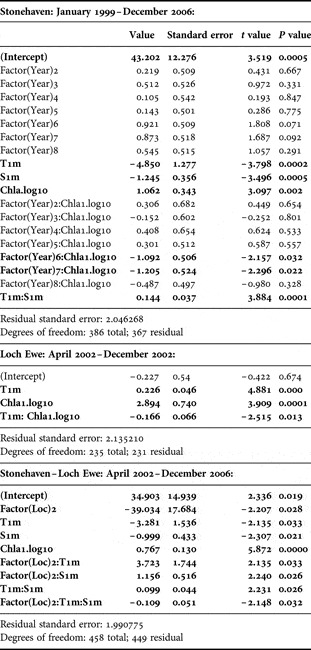
Numerical output from the optimal models obtained for: Stonehaven data; Loch Ewe data; and Stonehaven–Loch Ewe data comparison. Significant variables at the 5% level appear in bold.

Regarding the chlorophyll-a, no significant differences were found between sampling stations (Table 3), but the spring bloom in Loch Ewe occurred earlier and was more pronounced than in Stonehaven. There were no significant differences between years at Loch Ewe, but at Stonehaven, the chlorophyll-a concentration was significantly different in 2004 and in 2005 from the rest of the years (Table 3).
Total abundance analyses of decapod larvae
In the samples from Stonehaven, decapod larvae did not usually occur throughout the whole year. Usually, from December to February decapod larvae were absent from the plankton, with only occasional specimens found. In Loch Ewe, very small numbers of larvae were found during these months (maximum of 4 specimens in January 2004). Each year, in both locations, two abundance peaks appeared, the first during spring (March–May) and the second during summer–autumn (July–September). While in Stonehaven the larval abundance in the second peak was higher than in the first one; in Loch Ewe the differences in larval abundances between the two peaks were less evident, except in 2004. In Stonehaven an increasing trend in the abundance of decapod larvae was detected, mainly from 2003 onwards, which was not observed in Loch Ewe (Figures 2 & 3).
The three optimal models obtained to explain the abundance of decapod larvae in Stonehaven, in Loch Ewe and when comparing both locations, included a first order auto-regressive process (AR-1) and a variance structure composed of a combination of the exponential variances for chlorophyll-a and for temperature (Pinheiro & Bates, Reference Pinheiro and Bates2000; Zuur et al., Reference Zuur, Ieno, Walker, Saveliev and Smith2008).
STONEHAVEN: JANUARY 1999 TO DECEMBER 2006
The final optimal model found to explain the abundance of decapod larvae in Stonehaven was:

where


There were no significant differences in decapod larval abundance between years, even though the graphs (Figure 2) would suggest an increase in 2003, 2004 and 2005. The environmental variables used in the analysis: temperature, salinity and chlorophyll-a (log-transformed), were found to be related to the decapod larval abundance. In addition, interactions between temperature and salinity and between the 6th and 7th year (i.e. 2004 and 2005) and chlorophyll-a were significant at the 5% level (Table 3). The temperature–salinity interaction is most likely a seasonal effect, since higher salinities (or lower freshwater input) would be expected during summer months, when the temperatures are higher and land run off/river is low. Hence, the significant temperature–salinity interaction indicates higher abundances when high temperatures and low salinities occur. During 2004 and 2005, the chlorophyll-a values were significantly different from values in other years.
LOCH EWE: APRIL 2002 TO DECEMBER 2006
In the case of Loch Ewe data, the final optimal model was:

where


Only temperature, chlorophyll-a (log-transformed) and the interaction between temperature and chlorophyll-a were significant (Table 3). No significant differences were found in the abundance of decapod larvae among the years analysed.
STONEHAVEN AND LOCH EWE: APRIL 2002 TO DECEMBER 2006
The optimal model obtained when comparing Stonehaven and Loch Ewe data was:

where


All terms were significantly different from 0 at the 5% level, although the significance was weak except for chlorophyll-a transformed (Table 3). The abundance of decapod larvae in Loch Ewe was significantly higher than in Stonehaven. Chlorophyll-a, temperature and salinity effects were significant and were related to the observed abundance of decapod larvae. The model also confirmed that the patterns of both temperature and salinity were significantly different between locations. The temperature–salinity interaction, as found in the analysis of the Stonehaven data, provides information about season. Therefore, the three-way interaction would mean not just that the abundance was higher in Loch Ewe than in Stonehaven, but that these higher abundances in Loch Ewe happen during the summer months, or at least, when high temperatures and high salinities co-occur.
DISCUSSION
The annual abundance pattern of decapod larvae observed in the time-series analysed for Stonehaven and Loch Ewe, was characterized by the presence of two main abundance peaks, the first in spring and the second in the summer, extending into autumn. The importance of each peak, in terms of abundance, differed between locations: the spring peak was higher and the second more protracted in Loch Ewe than in Stonehaven. The models obtained to explain the pattern observed showed temperature and chlorophyll-a as main factors influencing occurrence and abundance of decapod larvae. The increasing trend of larval abundance in Stonehaven appeared to be related to the increasing temperatures recorded at that site.
The general pattern observed at both sites broadly follows the annual cycle of the whole zooplankton assemblages known for temperate waters and the patterns detected for decapod larvae in other geographical areas (Rees, Reference Rees1955; Bourdillon-Casanova, Reference Bourdillon-Casanova1960; Fusté, Reference Fusté1982; dos Santos, Reference dos Santos1999). However interannual variations are observed and the peaks of maximum abundances occur at different times of the year. In our data, the first peak in the two locations happened around April–May (slightly earlier in Loch Ewe than in Stonehaven) and the second one mainly during September. Although this is coincident with the observations made by Fusté (Reference Fusté1982) in the Mediterrenean Sea, in lower latitudes those peaks use to make an earlier appearance, e.g. in southern locations in the North Sea (Rees, Reference Rees1955) or on the Portuguese coasts (dos Santos, Reference dos Santos1999). These differences in the seasonality and occurrence of decapod larvae in the plankton are associated with the environmental characteristics of the area, with temperature being the main influencing factor. The effect of temperature on larval development in laboratory rearing experiments is known (Valdés et al., Reference Valdés, Álvarez-Ossorio and González-Gurriarán1991; Anger, Reference Anger2001) and Kirby et al. (Reference Kirby, Beaugrand and Lindley2008) has recently demonstrated the positive relationship between SST and the abundance of the larvae of three benthic taxa, decapods among them. Previously, Lindley et al. (Reference Lindley, Williams and Hunt1993) related mild temperatures to the earlier occurrence of several species of decapods in the plankton in CPR samples. As it could be expected based on those studies, the analyses performed on our data also detected the great importance of this variable. In all of our statistical models temperature was a highly significant factor affecting decapod larval abundance and occurrence.
Along with temperature, the food availability, expressed here as chlorophyll-a concentration, had a significant influence. Other studies have observed a positive relationship between the North Sea Phytoplankton Colour Index (a measure of phytoplankton chlorophyll) and the abundance of decapod (Kirby et al., Reference Kirby, Beaugrand and Lindley2008) and echinoderm larvae (Kirby et al., Reference Kirby, Beaugrand, Lindley, Richardson, Edwards and Reid2007). The seasonal cycle of chlorophyll-a in Loch Ewe showed an earlier spring increase than at Stonehaven. This and the temperatures recorded at Loch Ewe were related to the occurrence of the decapod larvae, which made their appearance in the sea loch earlier in the year than at Stonehaven.
The highest abundance of decapod larvae at Stonehaven and Loch Ewe was recorded in 2004. Although the marginal effect of year was not significant, a clear increase in the total abundance of decapod larvae during 2003, 2004 and 2005 was observed at Stonehaven (Figure 2). Temperature anomalies calculated by Bresnan et al. (Reference Bresnan, Hay, Hughes, Fraser, Rasmussen, Webster, Slesser, Dunn and Heath2009) to the same set of temperature data as we used, showed more positive values during 2002–2006 than in previous years. The apparent increase in decapod larval abundances during 2003, 2004 and 2005 could be related to the higher temperatures recorded in each previous year and the general increasing trend in temperatures at Stonehaven. Given that temperature has a major influence in larval development (Costlow & Bookhout, Reference Costlow and Bookhout1969; Anger, Reference Anger2001), high temperatures could contribute to a higher survival rate of the larvae passing to the next breeding season. In 1999, high temperatures were recorded but this was not reflected in higher abundance of larvae the next year. Nevertheless, the high temperature values in 1999 were sporadic and did not persist for more than a week. The Loch Ewe abundances of decapod larvae did not show an increase through the years, as happened at Stonehaven, but they reached extremely high abundances in 2004 compared with the other years. The temperatures during the previous year (2003), although they did not reach unusually high values, remained high for longer than was the case in the other years sampled.
As pointed out before, the higher larval abundance at Loch Ewe is related to the temperature but also to the higher environmental stability of the area. In general, in the sea loch, temperature fluctuations through the years appeared to be more stable while at Stonehaven a higher degree of variability was evident. Although the maximum temperatures recorded during the summer months in the sea surface and the sea bottom reached similar values at the two sampling stations, in the winter, the temperatures are colder at Stonehaven. Both factors (higher stability and warmer temperatures during colder months) may contribute to the higher abundance found at Loch Ewe. As in the case of echinoderm (Kirby et al., Reference Kirby, Beaugrand, Lindley, Richardson, Edwards and Reid2007), and decapod and bivalve larvae (Kirby et al., Reference Kirby, Beaugrand and Lindley2008), we also observed in our data a link between winter temperatures and decapod larval abundance in the summer.
The highly advective nature of the Stonehaven site, with a southerly residual water flow and strong tides, must have considerable influence on the decapod larval community. In Loch Ewe, the more enclosed decapod community would probably be stable and established in the area, even though many larvae will be subject to the transport and larval dispersal to and from offshore waters (Queiroga & Blanton, Reference Queiroga and Blanton2005). Although many larvae of some species will remain in the sea loch that constitutes their parental habitat, many others will be transported out of the loch, some to return later to settle. In the case of Stonehaven it can be hypothesized that the results would reflect the diversity of a wider area than the immediate sampling location and would be subject to the effects of wider scale oceanographical processes. Both monitoring sites provide complementary information on the effect of the same environmental variables on the same taxon, but representing two different ecosystems.
In this study we have analysed the annual occurrence and abundance pattern of decapod larvae in two coastal locations in Scotland. Literature and our own data show temperature and chlorophyll as main factors affecting that pattern. The increasing SST detected in the North Sea and observed in our monitoring sampling point suggests we should expect future changes, which could impact higher up the food web. Continuation of the monitoring programme established in these Scottish coastal locations and new analyses for the increasing data recorded, will show if those changes occur and will allow us to understand possible changes in coastal ecosystems.
ACKNOWLEDGEMENTS
The authors would like to thank all the staff who contributed to the maintenance of the monitoring programme and in particular John Dunn, John Fraser, Susan Robinson and Jens Rasmussen. The monitoring programme is performed as part of the Scottish Government-funded Fisheries Research Services Inshore Monitoring Programme. This study has been funded by a PhD grant to M. Pan, provided by FRS Marine Laboratory Aberdeen, now Marine Scotland-Science, Marine Laboratory Aberdeen.