

The study of personality traits and characteristics of the creative person has been without doubt one of the main aspects that has drawn the attention of researchers. An increased knowledge of these personal attributes makes it possible to elaborate programs that strive for the development of those abilities, that allow for the discovery of barriers that prevent its expression and foment the development of creative potential (Plucker & Zabelina, Reference Plucker and Zabelina2009).
Over the last two decades we have witnessed concern in trying to understand how cognitive, motivational and personality characteristics are combined in eminently creative persons (Boden, Reference Boden1996; Candeias, Reference Candeias, Morais and Bahia2008). Guilford (Reference Guilford1960, Reference Guilford1967) was one of the first to specify some personal skills, such as fluency, flexibility, originality, title abstraction, elaboration and resistance to premature closing. His ideas ultimately influenced later models, such as those developed by Torrance and Ball (Reference Torrance and Ball1990) and Wallach and Kogan (1965). Other fairly consensual traits in literature, reported by various researchers indicating some commonality between theories describing the creative person, involve self-confidence, perseverance, openness to experience, capacity to take risks, tolerance to ambiguity, humour and independence (Torrance, Reference Torrance and Torrance1962; Romo, Reference Romo, Morais and Bahia2008).
Torrance (Reference Torrance1966) carried out important work in this area, analyzing the way of thinking of prominent creative individuals in society, such as scientists, artists, writers and other groups of professionals, with the intent of evaluating the common personality traits of these individuals. Although his initial model only considered the cognitive variables of creativity (Torrance & Safter, Reference Torrance and Safter1999), his great contribution refers to the later inclusion of emotional aspects in the assessment of creativity (Wechsler, Reference Wechsler2004). His instruments are some of the most used and researched internationally (Baer, Reference Baer2011; Kim, Reference Kim2008) with a vast number of adaptations and translations carried out in various countries (Torrance, Reference Torrance2000; Pereira, Reference Pereira2001).
In light of the recognized importance of that battery, the Torrance Test of Creative Thinking (TTCT), Figural Form, based on the Brazilian adaptation (Weschler, 2004), was selected as the model for construction of the Brazilian instrument for evaluation of creativity in children, called the Test of Creativity in Children’s Drawings (TCCD). New sets of drawings were created as a stimulus for divergent production of drawings. Initially all creative characteristics in the developed instrument scored in TTCT were included. Detailed descriptions of each characteristic may be found in Torrance and Safter (Reference Torrance and Safter1999), Torrance and Ball (Reference Torrance and Ball1990) and Wechsler (Reference Wechsler2004), which will be presented later during the description of the instrument.
As an example we can refer to studies that aim to investigate the internal structure of creativity measures, as well as different measures of scoring, as emphasized by Clapham (Reference Clapham1998); Kim, Cramond, and Bandalos (Reference Kim, Cramond and Bandalos2006), Nusbaum and Silvia (Reference Nusbaum and Silvia2011) as well as Silvia (Reference Silvia2008a, Reference Silvia2008b). According to the authors, the internal structure for divergent thinking tests is not yet well understood. Another important limitation refers to the studies that seek to apply more recent psychometric methods, such as the Item Response Theory - IRT, confirmatory factor analysis and structural equation modelling, to study old questions posed by divergent thinking tests. To this end, the objective of the present research was to contribute to the field by proposing the use of Rasch-Master’s Partial Credits Model in the analysis of the scoring of divergent thinking tasks (Wright & Masters, Reference Wright and Masters1982).
The main contributions of the application of IRT refer to the possibility of its use as a tool to quantify the levels of a subject’s ability in relationship with each characteristic (or item), allowing for the identification of characteristics that are more prominent along the latent ability scale (Primi, Reference Primi2004). Such a tool further allows for a deep look into the internal structure of items, indicating which items tend to be more easily scored, demanding thus less creative ability from the subjects. The models allow for a relationship between different levels of ability (theta) and item scores to be established in order to obtain a set of expected response patterns for each theta value by means of analysis of the “construct map” or “item map” (Primi, Carvalho, Miguel, Muniz, & Nunes, Reference Primi, Carvalho, Miguel, Muniz, Nunes, Nunes., Hutz and Nunes2009; Van der Linden & Hambleton, Reference Van der Linden and Hambleton1996), which has been considered a way of studying the construct validity of the test, in other words, what the scale formed by the items means. This procedure is the essence of what is recently been called item referenced meaning (Embretson, Reference Embretson2006; Embretson & Reise, Reference Embretson and Reise2000). Classical psychometric procedures attribute meaning to the scores by means of a normative reference procedure which consists in discovering what is expected to occur, based on the results. Person’s results are interpreted by comparing them to the group results and indicating their relative position, as a percentage, by means of a standardized scale. Based on this procedure, statistical information obtained on the normative group is used to interpret the subject’s level of ability.
By applying of the IRT models another type of scale interpretation system becomes possible by referencing the test items. Since IRT establishes a relationship between the scale and the score for each item, by means of the Item Characteristic Curve (ICC), it is possible to calculate score expectations allowing recovering scores on items people on different scale levels would get right. The qualitative analysis of the item content allows for better definition of the ability scale. Analysis of the hierarchical difficulty of the items - the meaning of low, average or high scores with regards to ability that accumulates - allows for inference on how the construct is structured and is represented by the items, thus becoming a method to study the construct validity of the test. This procedure is also an alternative scale interpretation (Embretson, Reference Embretson2006; Linacre, Reference Linacre2004).
Previous TCCD studies investigated classic psychometric properties, such as convergent validity, internal factorial structure and test-retest reliability. In the present study we try to expand validity studies by means of IRT application in the creation of item maps for each one of the four factors underlying test items. In this way an interpretative scale of the subjects’ scores may be constructed based on the expected scores derived from IRT making it possible to understand more clearly the different levels of creativity that the global score implies. None of the revised divergent thinking tests applied IRT in their analysis which reinforces the importance of the method proposed here. Therefore, this paper demonstrates the item reference meaning as an additional alternative method for score interpretation to the standard norm referenced meaning procedure.
Thus, our aim was to analyse how the characteristics evaluated by TCCD are structured in terms of their complexity (considering the difficulty parameter of the items) and how we may use this information to understand the latent construct that items are supposed to form. This highlights which characteristics vary between more or less creative persons, as indicated by their test scores. In this way, the study aims to contribute to the construct validity of the instrument by analyzing the item complexity structures and what they suggest regarding the meaning of the underlying scale.
Method
Participants
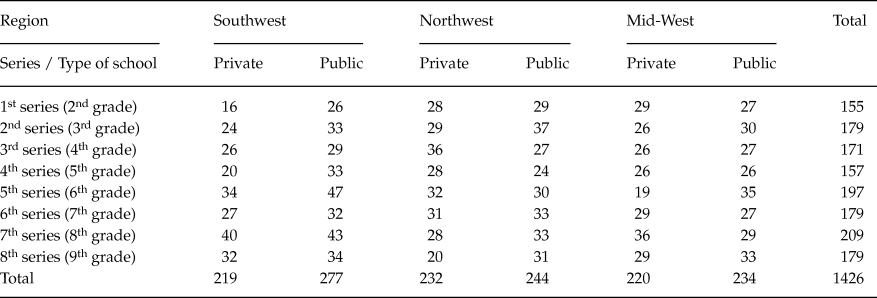
Data from a normative sample of 1,426 participants was selected for the analysis, in which 672 were female and 754 male, with ages ranging between 6 and 15 years (M = 10.78 years, SD = 2.27). The sample consisted of Brazilian students, from 2nd to 9th grades of elementary school of public (n = 709) and private (n = 717) from three regions of the country: Northwest (n = 496), Southwest (n = 476) and Centre-West (n = 454), as can be seen in the Table 1.
General Sample by regional, series and type of school sample

Given the cultural amplitude and diversity of the country in question, an attempt was made for those differences to also be included in the selected sample, by which data was collected in three Brazilian regions, avoiding thus the concentration of participants from one particular region. Further to this, in each of the chosen regions, care was taken to the type of school of the participants in order to better control the influence of socio-economic variables (seeing that in Brazil the more favoured economic classes attend private schools), as well as to allow for comparison between the students of the three regions. Such criteria is also important seeing that literature points to the influence of the socio-economic variable on individual creativity, for the access to resources may be limited or expanded due to socio-economic standing. With that objective, some public and private schools were contacted and those responding positively to the inquiries were selected, taking care that all schools involved were located in State capitals. Thus, the sample considered for the present study consisted of a total of six schools and 48 classrooms.
Instruments
The Test of Creativity in Children’s Drawings was used as a measure of creativity (Nakano, Wechsler, & Primi, Reference Nakano, Wechsler and Primi2011), consisting of three activities: draw a drawing based on one low definition stimulus (activity 1), complete 10 incomplete stimuli (activity 2) and draw the most number of drawings based on the same stimulus repeated 30 times (activity 3), based on the format adopted in Torrance’s figural instrument.
The instrument consists of 41 stimuli, which were selected through a pilot study carried out with 20 children (ages between 5 and 6) who were invited to a free drawing session. The chosen ages is justified due to the fact that, at this age, children do not self-censor themselves and this allows for the most varied ideas to be implemented, this being one of the requirements of creativity. From these drawings the most common elements were defined (based on frequency of occurrence) and from those, the shapes that would finally make up the instrument, were selected. Care was taken to avoid shapes that had already been used in previous figurative creativity evaluation instruments, such as those present in the Torrance Test (be it Shape A or Shape B) and in Rosas’ (Reference Rosas1984) proposal of construction of a test of creative aptitude, also based on Torrance’s test.
As already pointed out, the instrument was based on Torrance’s figurative test, although important and substantial alterations were made, be it with regards to the original instrument or Wechsler’s (Reference Wechsler2004) Brazilian version: (1) the stimuli making up the instrument were new, having been selected from drawings made by Brazilian children; (2) the instructions were modified to evidence the tasks and attend to the need of cultural adaptation; (3) the occurrence of each creative characteristic now scores separately in each of the three activities, contrary to the original test proposal, in which the score of each creative characteristic, although rated separately in each activity, are added in the final score in order to be considered in their entirety; (4) the system of interpretation was based on a four factor model (idea enrichment, emotional aspects, creative preparation and cognitive aspects) extracted after factor analysis with a sample of 1500 Brazilian children (Nakano & Primi, Reference Nakano and Primi2012), differently to the original model made up of two indexes (cognitive aspects / cognitive and emotional aspects).
In Brazil, the Torrance tests have been validated and used only for adolescents and adults, which means the existence of a gap relative to the creativity in children. In this way, the combination of both instruments potentially makes it possible to evaluate the construct over a wide age range, increasing the possibility of early gifted identification and long-term pre-and post-training evaluations.
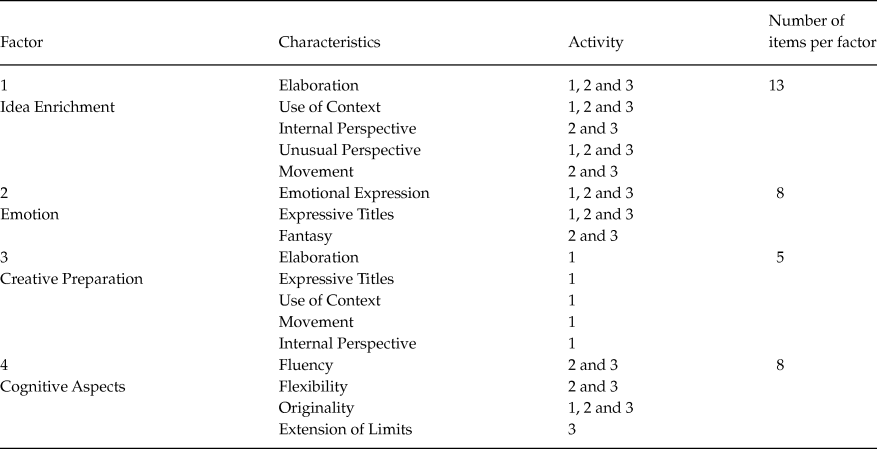
Table 2 shows the 12 characteristics evaluated in the TCCD in the second column. Each child’s drawing receives a score for each of the 12 characteristics. With the exception of Fluency and Flexibility, which are not scored in activity 1 (due to the fact that it comprises only one stimulus) and the Limit Extension Characteristic, which is only evaluated in activity 3. Based on the results of 1253 participants between the ages of 6 and 16 (M = 10.78), Nakano and Primi (Reference Nakano and Primi2012) investigated TCCD’s internal structure and found a four factor solution. The correlations between the factors were: Factor 1 vs Factor 2, r = .33; Factor 1 vs Factor 3, r = .53; Factor 1 vs factor 4, r = .37; Factor 2 vs Factor 3, r = .16; Factor 2 vs Factor 4, r = .08; Factor 3 vs Factor 4, r = .13. The first column in Table 2 shows the factors and how the characteristics were grouped.
Description of factors, characteristics and activities of the instrument

Factor 1 was named Idea Enrichment, due to its characteristics, which involve perceiving a situation in a more detailed manner, adding detail and elaboration to the response, perceiving a wider and dynamic context and different point of view. Factor 2 involves the use of creative resources that are linked to emotional perceptions which facilitate the discovery of new ideas. Factor 3 was named Creative Preparation, due to its unique feature of only one drawing having to be made. For this reason it was considered a “warm up” activity, since it was an opportunity to prepare for the activities that followed. Factor 4, Cognitive Aspects, consisting of indicators that use cognitive resources in the process of searching for different, original solutions which fall outside the established limits (Nakano & Primi, Reference Nakano and Primi2012). This factorial organization is partly similar to that reported by Torrance (Reference Torrance2000) in his revision of TTCT validity studies. Torrance and Ball (Reference Torrance and Ball1990) report on a study carried out for a doctorate thesis that found 4 factors: Emotion and Humour (similar to Factor 2 of this study), Production (similar to Factor 4), Synthesis and Perspective (similar to Factor 1). It is interesting to note that, although they found this four-factor solution, they end up proposing that they be joined into a single creative index.
The twelve characteristics were similar to the ones defined in the Brazilian version of the Torrance tests (Wechsler, Reference Wechsler2004). In accordance with the authors, the definitions and scoring method for each characteristic are presented below:
Fluency: ability to produce a great number of ideas derived from one solution or problem, without censorship of the produced responses. It is assessed by the number of pertinent responses the subject produces; in other words, those that take into consideration the objectives of the task (make use of the stimulus and not constitute an abstract drawing). One point is given for each appropriate response.
Flexibility: ability to produce various responses pertaining to different domains or classes. Each drawing is classified according to one content category - for example: animal, means of transport, household utensils, etc.).
Elaboration: the ability to produce, expand and implement ideas. It is calculated by the count of additional detail children add to the ones that convey the basic idea of the drawing.
Originality: the ability to produce ideas that are away from common sense, obvious or ordinary. It is scored with regard to the rarity of the response, as adopted by Torrance (Reference Torrance1966). A table of common responses, which appear in more than 5% of the protocols of Brazilian normative sample study, is used to score this characteristic. One point is given for each answer not listed in the common responses table.
Emotional expression: one point for each expressed emotion and feeling in drawings or with regards to titles.
Fantasy: defined as an imaginative dimension, in which the individual makes use of reality, fiction and fantasy. One point is given for each occurrence of fantasy in the drawings.
Movement: one point is given for movement that is clearly apparent in the drawings, for instance, when using gerund conjugated verbs.
Unusual perspective: defined as the ability to see things from different perspectives or points of view. One point for each drawing viewed from unusual angles.
Internal perspective: ability to view object internally, their functioning and dynamics. One point is given for each drawing in which the internal working of objects appears, or with transparencies and details that normally wouldn’t be visible.
Use of context: one point is given when context is provided for the drawing in which it is embedded.
Extension of limits: resistance to drawing immediate conclusions. It is scored by means of counting the number of stimuli that were not closed prematurely, for instance, by extending or maintaining partial squares open, in order to resist the urge to give shape to that geometric form).
Expressive titles: indicates a presence of a more abstract idea representing the essence of the drawings as opposed to a basic description. Three levels are given 0 points when the title merely describes the figure, 1 point when an adjective is added and 2 points when it contains an abstract idea.
The first four variables - fluency, flexibility, elaboration and originality - are commonly classified as cognitive characteristics and the remaining variables are emotional characteristics of creativity. The research into the psychometric qualities of the instrument found correlations of .81 and .94 (convergent validity) with the Torrance Figural Test in a sample of 120 participants of the 1st to 4th grades of elementary schools (M = 9.1 years old). Test-retest reliability coefficients of .84 to .95 were found with a 30 day interval in a sample of 30 children from 1st to 8th grades, M = 8.7 years old (Nakano & Wechsler, Reference Nakano and Wechsler2006a). No significant differences were found on test scores considering different groups according to gender and grades in the normative sample of 1426 students from 2nd to 9th grades (Nakano & Wechsler, Reference Nakano and Wechsler2006b).
Procedures and statistical modelling
The instrument in this research was applied collectively in a classroom environment and took place on a date and time previously established in conjunction with the school so as not to interfere with academic activities. Children had 45 minutes to answer the instruments (which included handing out of the question sheets).
Rasch-Masters Partial Credit model was applied to analyse the data. Generally IRT models the testing situation whereby a person answers a set of items. In the present case the higher the creative potential, the greater the probability that the subject will score higher in a given item of the test. This probability also depends on the complexity of the item. In this way the probability of scoring in a given characteristic will vary according to the level of ability of the person and the complexity of the item (Pasquali & Primi, Reference Pasquali and Primi2003; Primi, Reference Primi2004).
In Rash models items are characterized solely by their difficulty level (b) and are thus sometimes called the one parameter model. The Rasch model may be applied to dichotomous (0 and 1) and polytomous scores (0, 1, 2, 3, 4 and 5) as in this study. Rasch models for polytomous items are named Rasch-Andrich Rating Scale and Model Rasch-Masters Partial Credit Model (Wright & Masters, Reference Wright and Masters1982). Both establish a relationship between responses to items and theta (magnitude of ability), assuming that every higher value in the response scale (for example, a score of 1 to 9) implies a trend towards higher levels of ability. These models also only consider information similar to the difficulty of characterizing an item (subject to be discussed later). The general difference between the two models is that, while in rated scales it is assumed that differences between scores in the scale is constant and equal for all items and thus are applicable to likert scales, for example, in the partial credit model that condition is more lax in order to define different distances between scores, depending on the item that is being considered. For this reason the latter model was adopted, since TCCD items contain different scoring schemes and therefore the partial credit is more appropriate. As an example of scoring, fluency is limited to the stimuli that make up the instrument but, on the other hand, elaboration, whose scores are practically unlimited given the possibility of an unrestricted number of details in the drawings, could assume a very wide range of possible scores. Further, considering that one of the aims of the study was to verify the relative positioning of each score on the theta scale, it became necessary to guarantee the flexibility of the model so as to allow them to be positioned freely on the scale, based on the empirical data. The partial credit model is represented by the following equations (Embretson & Reise, Reference Embretson and Reise2000; Wright & Masters, Reference Wright and Masters1982):
 $${P_{nix}}\left( {{\theta _n}} \right) = {1 \over {1 + \sum\nolimits_{k = 1}^{{m_i}} {exp\left( {\sum\nolimits_{j = 1}^k {\left( {{\theta _n} - {b_{ij}}} \right)} } \right)} }}{\rm{ for }}x = 0$$
 $${P_{nix}}\left( {{\theta _n}} \right) = {{exp\left( {\sum\nolimits_{j = 1}^x {\left( {{\theta _n} - {b_{ij}}} \right)} } \right)} \over {1 + \sum\nolimits_{k = 1}^{{m_i}} {exp\left( {\sum\nolimits_{j = 1}^k {\left( {{\theta _n} - {b_{ij}}} \right)} } \right)} }}{\rm{ for }}x = 1,2,...,{m_{}}$$
In the formula
 ${P_{nix}}\left( {{\theta _n}} \right)$
indicates the probability of subject n obtaining a score of x on item I (item scores have a notation x = 0, .... m where m + 1 equal to the number of response categories); parameter
 ${\theta _n}$
is the measure of person n in the latent dimension theta measured by the item; Exp(x) is the symbol referring to natural exponential function e ≅ 2.72 to the power x; and parameter
 ${b_{ij}}$
is the point of transition or threshold between the scores of item i. Thus, an item with a maximum score of four points (e.g., 0, 1, 2 and 3) will have three thresholds representing the transition between points 0 and 1 (
 ${b_{i1}}$
), 1 and 2 (
 ${b_{i2}}$
) and 2 and 3 (
 ${b_{i3}}$
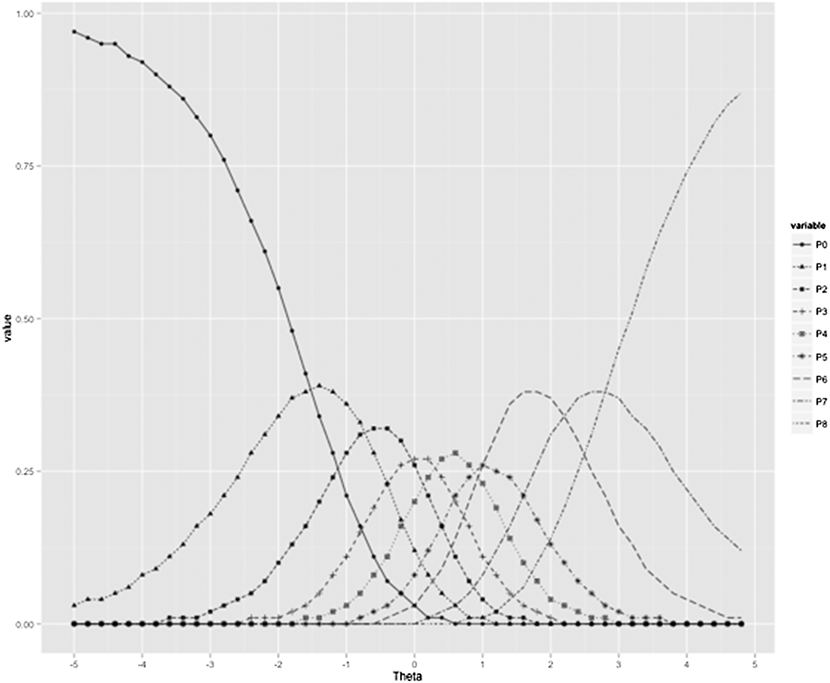
). These points represent levels in the dimension that marks the transition between a lower score (e.g., 2) and the score immediately above (3) in terms of probability of obtaining that amount of points in the considered category. In this way, at the exact point corresponding to the thresholds and the probabilities of obtaining one or another score are the same. This information may be seen in Figure 1 and illustrates the Characteristic Curve of an Item (ICC) with a score between 0 and 8. The ICC presented correspond to the estimated parameters for item Orig2 (Originality in activity 2), belonging to Factor 4. By using this example it is possible to understand the parameters that will be presented in the results section.
Example of item characteristic curves

The values for theta (level of ability of the subject) are situated on the horizontal baseline and the probability of score, on the vertical line. For each level of theta it is possible to verify the choice probabilities of each alternative for a particular item.
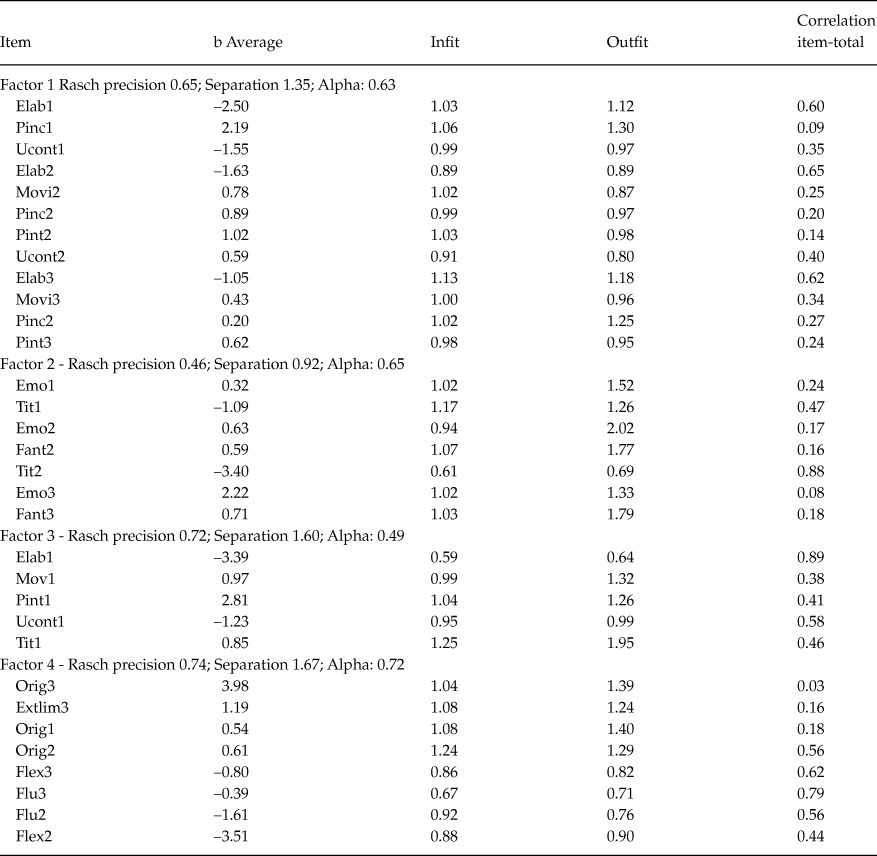
The curve allows for visualization of the thresholds (intersection between two curves, which indicates the necessary value of theta in order for the individual to receive the score corresponding to a curve on the right [higher] than the curve on the left [lower]), which makes the number of thresholds equal to n-1. In item Orig2, illustrated in Figure 1, scores range between 0 to 8 and thus eight thresholds exist (9 – 1), which are: –1.53; –0.75; –0.05; 0.29; 0.90; 0.99; 2.19 and 2.80. Theta values situated above each threshold are associated with a likelihood of higher scores and below that threshold, a likelihood of lower scores. In this way the distances between thresholds map the intervals in the latent dimension associated with the probability of obtaining a certain score, which means that the more to the right the curves are situated, the greater the difficulty of the item, since even the start of scores will be more likely to be associated with a higher level of theta. The software used in the study WINSTEPS (Linacre, Reference Linacre2009), calculates the general difficulty index of an item, which is obtained by average of the thresholds. Still with regards to Orig2, the average difficulty is 0.61, estimated from the simple averaging of the intervals of score thresholds ({–1.53+–0.75+–0.05+0.29+0.90+0.99+2.19+2.80} / 8). This parameter can be seen in Table 3, in the column “b average”, and its interpretation will be discussed in the results section. In this way difficult items, which represent extremes of the latent dimension, are represented by a higher average of thresholds.
Item parameters and fit values (infits and outfits)

Note:
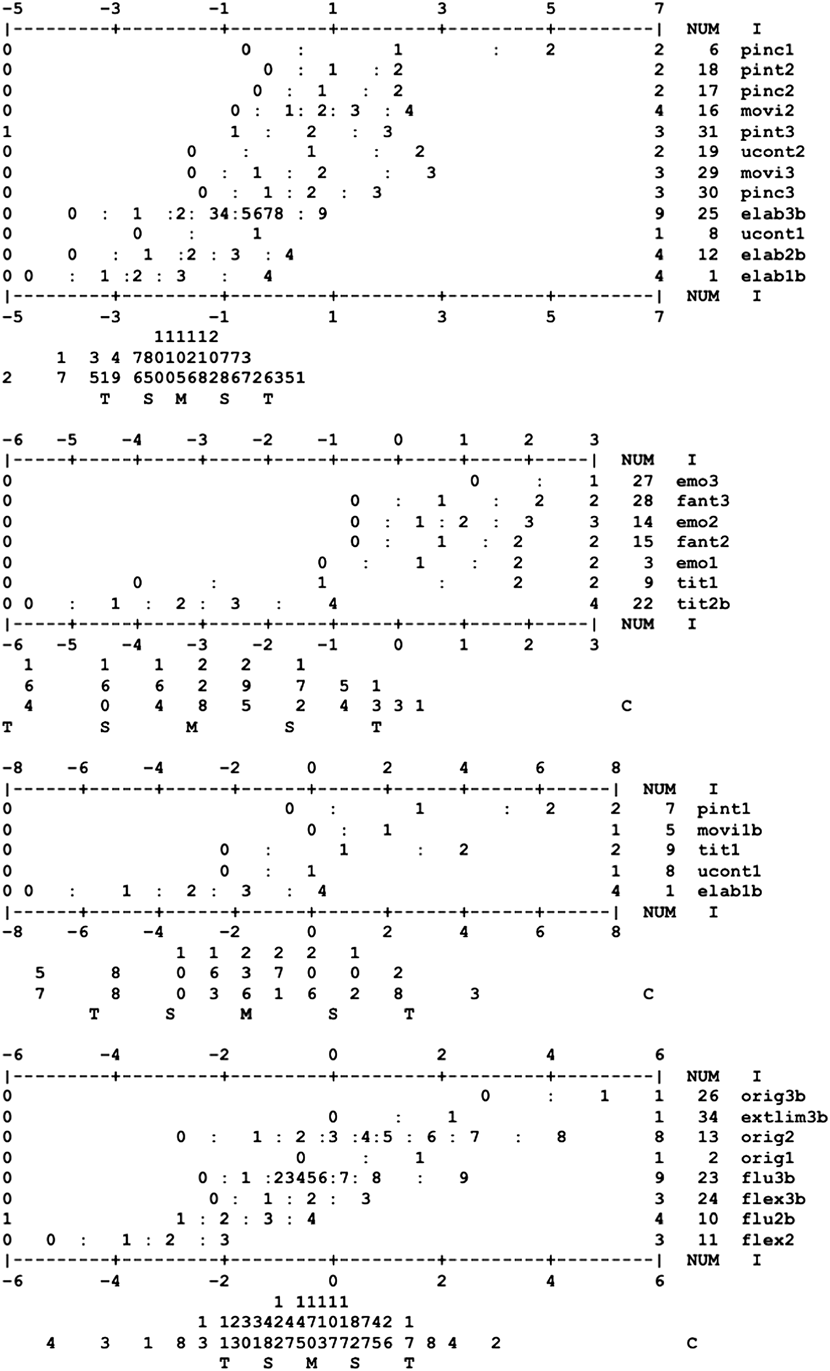
The b average value corresponds to the limits between categories. Those limits may be seen in the symbols “:” of Figure 2
Item map for the Children’s Figural Creativity Test.

. To confirm precise limit values, interested readers may request the complete analysis report from the authors.
An important application of this model is called the “construct map”, which consists in the graphical representation of item scores in relation to theta. As can be seen further ahead, this map shows, for each level of theta, the expected scores for items and thus the combination of scores associated with each of the different levels of ability of the scale. In this map it is possible to see the scores relative to the items, comparing each other relatively to the value of theta and for which the transition limits between scores are represented by the symbol “:” between two scores. The analysis of this map suggests a way of interpreting the scale with regards to the items that are expected to be scored for each level of ability. For that analysis, the concept of item consists of the scores for each of the 12 creative characteristics considered in the correction of the instrument and its occurrence in each of the three activities (considering separately the Elaboration score in activity 1 as an item, Elaboration in activity 2 as another item and Elaboration in activity 3 as a third item, obtaining 12 x 3 = 36). Meanwhile only 34 items have been considered, given that the characteristics Fluency and Flexibility are not scored in activity 1 - due to the fact that these only constitute one stimulus - as well as Internal Perspective, Movement and Fantasy in activity 1 - due to the results of the item factor analysis - and the Extension of Limits characteristic - which is only evaluated in activity 3. It is important to note that three items contribute towards the score in two factors (which are Elaboration, Expressive Titles and the Use of Context, which all belong to activity 1) and have for this reason been considered twice in the final item estimate since we run separate calibrations for each factor. In this way, the total number of items considered may be viewed in Table 2. The analysis carried out in WINSTEPS calibrated item parameters and produced item maps the show the relationship between each of the creative characteristics and theta making it possible to appreciate which characteristics identifies higher creativity.
An important consideration refers to the fact that there is no limit as to the maximum score for each item leading to a large amplitude of possible scores to be modelled depending on the item. For instance, the scores in elaboration ranged from 3 to 139 points calculated from the added detail to the drawings. Therefore an initial stage before calibration in WINSTEPS was carried out to recode original scores into a final ordinal scale with a maximum of nine points. This recoding considered percentile ranges to create an approximately constant distribution throughout the generated scores. After recoding, each item had scores ranging from three to a maximum of nine points, which would represent increases in the raw scores. In these circumstances, the value of theta indicates the creative ability that is being measured and thresholds the limits of score points, that is, the necessary theta values for transition between ranges (0 and 1, 1 and 2, and so forth until 8 and 9 are reached). A great focus of interest of this paper is the analysis of the relative placement of those limits in the construct maps, in order to understand the hierarchy of complexity of the items and how they make up successively higher levels of creative ability.
After recoding a calibration was carried out in WINSTEPS by means of the Joint Maximum Likelihood Estimation method. For analysis of the model fit, the infit and outfit fit indexes were considered. These indexes consist of standardized root-mean square residual values between the observed scores and the modelled scores. They are chi-squares divided by the respective degrees of freedom. Residuals are calculated in the following way (Wright & Masters, Reference Wright and Masters1982; Linacre, Reference Linacre2009):
 $$Outfi{t_i} = {{\sum\limits_{n = 1}^N {{{{r_{ni}}^2} \over {{V_{ni}}}}} } \over N}$$
 $$Infi{t_i} = {{\sum\limits_{n = 1}^N {{r_{ni}}^2} } \over {\sum\limits_{n - 1}^N {{V_{ni}}} }}$$
 ${r_{ni}}$
is the subject’s n residual score for item i given by
 ${r_{ni}} = {x_{ni}} - {E_{ni}}$
. In this equation, considering that there are m response categories, the probable (expected) score
 ${E_{ni}}$
of subject n in item i is given by
 ${E_{ni}} = \sum\limits_{m = 0}^x {m.{P_{nix}}\left( {{\theta _n}} \right)}$
. This last equation multiplies each possible response category by its expected probability, given by the model
 ${P_{nix}}\left( {{\theta _n}} \right)$
in order to result in the expected score for subject n in item i. The expected score variance is given by
 ${V_{ni}} = \sum\limits_{m = 0}^x {{{(m - {E_{ni}})}^2}.{P_{nix}}\left( {{\theta _n}} \right)}$
.
With regards to interpretation, literature recommendations were followed, which consider values above 1.3 (especially for infit) and item-total correlations near to zero, as indication of bad fit to the model (Smith, Reference Smith1996; Wright & Linacre, Reference Wright and Linacre1994). In the present study, for each factor, the Rasch reliability and separation index were calculated. The first index is calculated by the formula (total theta variance - real error variance) / total theta variance. The real error variance component is calculated taking into account the modelled variances when predicting responses of the subject and also misfit to the model. In turn, the separation index is another way of representing reliability and is defined by ratio between the “true” standard theta deviation and the standard error, representing the signal-to-noise ratio (Linacre, Reference Linacre1997, Reference Linacre2009). With the aim of estimating reliability, the classic Cronbach’s alpha internal consistency coefficients were also calculated.
And finally, it is also important to note that one of the basic IRT postulates is essential unidimensionality, in other words, the supposition that the items are measuring a main dimension and that the secondary dimensions have a negligible influence (Hambleton, & Swaminatham, Reference Hambleton and Swaminatham1985). For this reason the study of item dimensionality was one of the first steps taken before carrying out the present study, reported by Nakano and Primi (Reference Nakano and Primi2012) and Nakano et al. (Reference Nakano, Wechsler and Primi2011), where it was verified that the items organize themselves into four factors. Thus, statistical modelling was carried out for the four dimensions separately.
Results
The objective of the first part of the analysis was to verify the calibration and model fit of the items. This verification of to what extent people and items fit the model is made by means of the so-called fit indexes that allow for the detection of items and people that do not fit the model by analysis of residuals- the difference between what was predicted by the model and what was actually observed (Bond & Fox, Reference Bond and Fox2001; Smith, Reference Smith, Smith and Smith2004). These residuals are calculated for each item, pointing to a pattern of non-expected responses. If the response patterns of someone to the items are consistent, it is expected that someone with a creative ability (theta) greater than the difficulty level of the item, obtain higher scores. If the subject gives a wrong response and obtains lower scores, we will have obtained an unexpected score. On the other hand, if someone has a lower creative ability (theta) than the difficulty of the item, it will be expected for him/her to obtain lower scores. If, however, the subject gives a wrong response and obtains very high scores, we will also have obtained an unexpected score. This is due to the Rasch model being based on two principles: (1) the higher the creative ability of the subject, the higher the probability for scoring higher in the items and (2) easier items are more susceptible to being responded to / scored correctly than more difficult items.
In this type of analysis the more commonly used statistical fits are called Infit and Outfit. Infit verifies discrepancies that occur in items whose difficulties are close to the estimated ability of the subject. The more frequent errors and unexpected scores, the higher this index will be. This index ponders residual values taking into consideration the information existing in the item, seeing that items with difficulty levels close to the creative ability of the subject have more information. Outfit, on the other hand, is a fit sensitive means to measure unexpected patterns of response, but only when the difference between theta and item difficulty is great, in other words, someone with a very high theta who cannot respond correctly to a low difficulty item, or vice-versa. In this manner, outfit accentuates the importance of extreme residuals, in other words, someone with high ability responding incorrectly to easy items and someone with low ability responding correctly to difficult items. Benchmarks of infit and outfit values above 1.3 is an indication of a misfit (Bond & Fox, Reference Bond and Fox2001) and values under 0.80 indicate that the item is much more discriminating than expected.
As can be seen, infit statistical analysis with regards to Factor 1 (Idea Enrichment) scored an average of 1.00 (SD = .06) and outfit 1.02 (SD = .15), showing that the response patterns to the items closely match what was predicted. In more detail, we can see that the infit values lay between 0.89 and 1.13 and the outfit values between 0.80 and 1.30, which lie within the suggested range of 0.80 and 1.30, normally considered as the criteria for a good fit. Thus it was concluded that the fit and outfit variation, in the items that make up Factor 1, presented itself as predicted, indicating a response pattern consistent with the model.
With regards to Factor 2 (Emotionality), the average infit value was 0.98 (SD = .16) and outfit 1.48 (SD = 1.30), indicating that the closest residuals (infit) are adequate, although response patterns were found on a higher level than expected (outfit). In a more detailed analysis, it was observed that the infit values were situated between 0.61 and 1.17 and that the outfit values between 0.69 and 2.02, showing that not all characteristics fitted into the 1.30 limit, which is considered a good fit. Five of the items (Emotional Expression in activities 1, 2 and 3 and Fantasy in activities 2 and 3) presented an outfit value above the desired value. It can be verified that items with a higher outfit have a higher b average. To score 1 in these items a theta value of 0.5 or greater would be necessary, while the sample average shows a theta value of –3.5 (Refer to Discussion further on). These indexes indicate high unexpected scores, within these characteristics, for persons with low thetas. This also explains the low internal consistency coefficient. On the other hand, the infit values all fall within the predicted values. In this way, these results caution towards greater attention to interpretation of the scale generated by Factor 2, seeing that it may be possible to encounter scores that are not in accordance with the item map, as can be seen next.
Analysis of infit and outfit statistics for Factor 3 (Creative Preparation) showed that the greater part of the characteristics that compose it, fell below the maximum indicated value, 1.30. The averages of 0.96 (SD = .21) for infit and 1.23 (SD = .43) for outfit show that the model is balanced, with the exception of the characteristics of Expressive Titles and Movement, both in Factor 1, with outfit values above what was expected, 1.95 and 1.32, respectively. Once again, the items with high outfit values were the most difficult to be scored.
Finally, analysis of Factor 4 (Cognitive Aspects) resulted an average of 0.99 (SD = .05) for infit and 1.08 (SD = .24) as regards outfit, values which were considered ideal. When verifying separately each characteristic that makes up the factor, we found that most of them falls within the limits that were considered ideal and the exceptions occur in the Fluency characteristics of activity 3, whose infit values fell somewhat lower of what was expected (0.77), with the same thing happening with regards to the Fluency outfit values in activity 2 (0.68). The only value situated above the values predicted occurs in activity 3, in Originality, for which the outfit value was 1.40.
In Table 3 are the Rasch reliability, separation and Cronbach’s Alpha values, where we can see that, in general, the values encountered can be classified as low to moderate (0.46 to 0.74). However, it should be considered that, in general, the difficulty level of the items is situated above the creative abilities of the subjects.
While threshold averages are centred on a mean of zero, the average creative ability of the subjects making up the sample is well below that (F1= –1.71; F2 = –3.15; F3 = –1.62; F4 = –0.36), by which it should be noted that this situation is fairly common in creativity testing, items / responses that are considered creative represent rare expressions, which leads to asymmetrical distribution (Silvia, Wigert, Reiter-Palmon, & Kaufman, Reference Silvia, Wigert, Reiter-Palmon and Kaufman2012). This influences the internal consistency coefficients, reducing them, due to the fact that they reflect the reproducibility of the measures for that particular sample (Linacre, Reference Linacre1997). However, it is important to note that this should not be mistakenly identified as ultimate indication of low reliability since test-retest reliability coefficients, reported in the technical manual, varied between .90 and .95 (Nakano et al., Reference Nakano, Wechsler and Primi2011). Given the fact that creativity tests usually contain items that attempt to identify the higher end of the creative abilities scale, we encounter a situation where reliability, according to the internal consistency method, will naturally be relatively lower. By trusting only this coefficient as an estimate for the measure of error, the reliability of the test would be underestimated, seeing that the stability coefficients pointed to much higher levels of precision than that of the internal consistency coefficient.
A second analysis of the items, based on the Partial Credit Model, was carried out to visualize the relationship between the latent score of creative ability (theta) and the scores on each item. The analysis of the “construct map” or “item map” (Wright & Linacre, Reference Wright and Linacre1994) calculates patterns of expected responses, which are related to the theta values. It allows foe the interpretation of progressive levels of latent traits with reference to score profiles on each item. This is the essence of what is currently called item referenced interpretation (Embretson & Reise, Reference Embretson and Reise2000). The horizontal lines of the item maps refer to the mean theta scale with points indicating (M), one standard deviation (S) and two standard deviations (T). It also shows the number of subjects in several levels of scale that should be read vertically.
On the right side of the map are the items, more specifically in this case the creative characteristics making up the first factor, organized in order of difficulty with the easier items at the bottom and the more difficult at the upper. According to Bond and Fox (Reference Bond and Fox2001), the distance between each item in relation to the base horizontal line represents the relative difficulty for that item so, the closer the item is to the line the easier it will be to score on that item and the further away, the more difficult. In order to help with the interpretation of these maps, a vertical line was added to the figure representing the average. Along the horizontal base line we can find the theta values and in the body of the map item scores making it possible to see the amount of creative ability necessary to score each point in each characteristic (location where the theta values related to predicted values of 1). In this way, the further to the right a characteristic is located, the higher its difficulty.
Thus, when analysing the Factor 1 item map (Enrichment of Ideas) we can see that 105 subjects fall within the average and that Elaboration of activity 1 reveals itself to be the easier characteristic to score - score 1 starts at theta –3 - consequently persons with low creative abilities easily scored in this characteristic. On the other hand, the characteristic Unusual Perspective, in activity 1, is the hardest in which to score seeing that its scoring starts at theta 2 and requires a great deal more creative ability from the subject for him/her to score in it.
In this way we can see that the amount of ability necessary to score in each characteristic varies and as such this item map allows for identification of the characteristics that better identify subjects with higher creative scores in the instrument. It is important to note that, according to one of the principles of the model, the subjects who obtain high scores in characteristics that present a greater level of difficulty (located on the upper part of the map) will also probably score in those characteristics that require lower theta values, that is, those characteristics located on the lower part of the map. All the remaining maps should be interpreted in the same way.
The analysis of the construct map shows that in Factor 1 (Enrichment of Ideas), we can see that person of average or low ability will probably obtain scores between 2 and 4 for elaboration (in activities 1, 2 and 3). This item refers to the amount of detail, beyond the minimum required, that is added to the drawing in order to express an idea. This finding confirms the data obtained by Clapham (Reference Clapham1998) when he verified in his study that elaboration was the worst predictor of creativity. Between average and one standard deviation above average, the score basically reflects an increase in score for elaboration. Above one standard deviation, a region that indicates high ability in addition to the high scores in elaboration, the subjects will also have a tendency to score in the following indicators: use of context - showing details that provide context for the drawing in order to facilitate communication of the creative idea; movement 2 and 3 usually associated with a rich imagination and unusual perspective 1, 2 and 3 showing a tendency to represent an object or transmit an idea from an unusual perspective, as well as internal perspective 2 and 3, which denotes a tendency to represent concepts by means of elements which are not usually visible (Torrance & Ball, Reference Torrance and Ball1980). To summarize, the analysis of the distribution of latent ability for the students of this sample in this factor (whose averages and standard deviations were M = 1.71, SD = .76) shows that 75% of the students obtained theta scores equal to or lower than –1.1, which indicates they only scored in elaboration (between 2 and 4 points). The 80th percentile corresponds to a theta = –0.87 where we can observe scores for movement, internal and unusual perspectives and use of context. Such indicators show a higher level of creativity that was only obtained by a small percentage of students in the sample.
The analysis of the construct map for Factor 2 (emotionality) indicates that persons with average latent ability generally score between 1 and 2 in the item expressive titles, indicating an ability to abstract one component from the drawing and express emotion and feelings verbally. Scores situated between the average and two standard deviations show an increase in the number of expressive titles. Only above two standard deviations do we start observing scores on other indicators for these factors, which involve the production of drawings including characteristics such as fantasy, expression of emotions and feelings. The average for students in the sample with regards to this factor was relatively low (M = –3.14, SD = 1.43) and 75% scored less than –2.34. Thus we can see that very few students obtain a score that denotes the representation of fantasy and expression of emotions in the drawings.
It is interesting to note that the high outfit values for the items of higher difficulty indicate that, eventually, students with lower scores will score 1 in emotion or fantasy, which would be unexpected according to the model. That fact indicates that such indicators eventually do not have an increasing monotone quantitative relation, as do all other items in this factor. In this way, we can observe that the variations in Factor 2 are given mainly due to differences in the amount of points obtained from the expressive titles indicators and the high end of the scale is defined by the presence of emotion and fantasy in the drawings.
Analysis of the construct map for Factor 3 (creative preparation) showed that persons with average latent ability are likely to obtain scores of 2 or 3 for elaboration. This indicates that an average level is associated with the production of essential details to convey an idea. Between the average and one standard deviation it is noted that the drawings start to show an increase in score for elaboration, as well as for use of context and expressive titles. Only above two standard deviations do internal perspective and movement start to be scored. This hierarchy of indicators, as regards the association with latent ability, is similar to that found in Factors 1 and 2. Estimated latent theta scores for this factor are on average –1.62 and have a standard deviation of 2.05. It was noted that 75% of the sample obtained scores below 0.06, indicating drawings with essential details. A score a little above average reflects the inclusion of context and a title to express an idea and high scores (above 2 standard deviations) indicate the inclusion of ideas with unusual perspectives and greater expressive content (movement). Only 10% of the sample (corresponding to the 90th percentile associated with theta = 1.05), scored at this level.
Finally, the construct map analysis for Factor 4 (cognitive aspects), indicates that the latent ability is characterized by high scores for fluency and flexibility in Activity 2 (above 3 and 4 points) and average scores for fluency (4 and 5 points), lower for flexibility in Activity 3 (2 points) and for originality in Activity 2 (2 points). These results are coherent with the facets of the construct that are operationalized on these tasks since Activity 2 consists of different stimuli in order to elicit a greater variety of associations. The aspect which is meant to be analysed in this task is the resistance to the tendency to respond according to simpler, first associations and persist in trying to produce new, more elaborate and original ideas. Activity 3, however, consists of equal stimuli and elicit the capacity of returning to the initial stimulus and understand it in different ways (Torrance & Ball, Reference Torrance and Ball1980). Naturally this task tends to elicit a relatively lower amount of different ideas. Thus, higher averages in fluency and flexibility in Activity 2 are justified. Between average and one standard deviation, the latent variable is characterized by an increase in the mentioned variables. From two standard deviations onwards there is scoring for originality in Activity 1 and a greater number of original ideas in Activity 2 (score of 6 or higher). We also start to observe extension of limits. According to Clapham (Reference Clapham1998) this characteristic refers to the process of resistance to premature closure and to the capacity to redefine stimulus or second order change (Torrance & Ball, Reference Torrance and Ball1980), presenting a high predictive value of creativity.
Estimated latent variable scores for this factor are on average –0.36 and have a standard deviation of 0.84. The 75th percentile corresponds to a value of 0.11 indicating higher values for fluency and flexibility but average for originality. The analysis demonstrated still that 75% of the sample obtained scores below 0.06. Only above the 90th percentile (theta = 0.50) is it more likely to see higher scores for originality and extension of limits. On rare occasion, some students produced original answers activity 3.
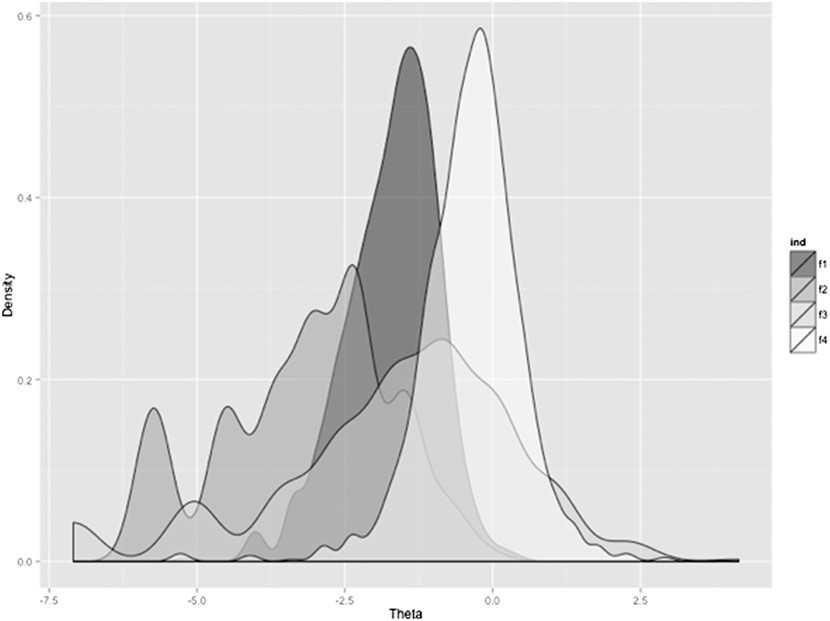
Figure 3 shows the score distribution of the student in the sample for the four predicted factors (N = 1426). The value of theta = 0 corresponds to the average item thresholds in each factor. Distributions tend to concentrate on the left, reflecting a theta average below zero. The further from zero the distributions, the more difficult it is to score on the items of that factor, as can be seen with factors 1 and 2 in relation to 3 and 4. Although the four factors reflect more consistent item groupings, empirically derived classification for the items and distinct conceptual aspects of creativity, the correlations between them are moderate to high. Factor 1 vs Factor 2, r = .51; Factor 1 vs Factor 3, r = .59; Factor 1 vs factor 4, r = .56; Factor 2 vs Factor 3, r = .32; Factor 2 vs Factor 4, r = .68; Factor 3 vs Factor 4, r = .17. In fact, such values point to the possibility of extracting a general factor when analysing those correlations. This indicates a hierarchical structure with a general factor at the top of the hierarchy that encompasses the four more specific aspects.
Theta score distribution between the four factors.

Discussion
As previously mentioned, most tests of divergent production attribute scores to a set of characteristics and later add them in order to generate global scores whose variations will indicate individual differences of creative potential (Almeida, Prieto, Ferrando, Oliveira, & Ferrándiz, Reference Almeida, Prieto, Ferrando, Oliveira and Ferrándiz2008; Torrance, Reference Torrance1966; Wechsler, Reference Wechsler2004). However, there is little discussion regarding the meaning of the number generated in the global score when faced with the diversity of the items that were added, as well as not considering the factorial models as a base for score creation (Clapham, Reference Clapham1998; Kim, Reference Kim2006; Nakano & Primi, Reference Nakano and Primi2012; Nakano et al., Reference Nakano, Wechsler and Primi2011; Torrance & Ball, Reference Torrance and Ball1990; Zeng, Proctor, & Salvendi, Reference Zeng, Proctor and Salvendy2011). For these reasons, the aim of the present study was to analyse how the items in a figurative test define the construct by applying methods of analysis that allow for the production of more substantial interpretations of the individual differences implied in the latent dimensions that are formed on a test. This paper illustrates the use of the Item Response Theory, namely, item referenced interpretation with the application of Rasch-Masters Partial Credit Model (Embretson, Reference Embretson2006; Embretson & Reise, Reference Embretson and Reise2000; Primi, Reference Primi2004; Primi et al., Reference Primi, Carvalho, Miguel, Muniz, Nunes, Nunes., Hutz and Nunes2009; Wolfe & Smith Jr., 2007).
In this case, what does this test offer that is new to creativity testing? What are the implications to the validity of the test? The use of the Partial Credit Model allowed for the establishment of score patterns for the items that are associated at various levels of the latent scale of the four factors. A contribution is made towards understanding the meaning of the various levels of the global variable obtained by sum of the characteristics. It was possible to note that an average student produces responses with average fluency and flexibility indexes and elaboration scores that are a little higher, producing drawings with a little more detail than necessary. Only for high creativity levels, students positioned above the 80th percentile, do we observe characteristics that are more closely related to creative thinking: production of a context for communication of an idea, new perspectives of looking at an object, expression of movement, original ideas, flexibility in repetitive situations, reclassification of stimuli, use of emotion and fantasy. Construct maps show that it is possible to create a hierarchy of items that suggest increasingly high levels of creativity of the subject (a) elaboration, fluency and flexibility in normal situations, (b) use of context, movement, internal perspective, unusual perspective and flexibility in more complex situations involving return to repeated stimuli, (c) expression of emotions and fantasy, high productivity for fluency and flexibility, reclassification of information and a greater number of original answers.
Thus, the results obtained add to the previous results and allow for the advancement of knowledge with regards to construct validity of the tests and creativity tests of the same type as analysed in this study (Wolfe & Smith Jr., 2007). It is interesting to note some points that were understood as evidence of validity: (a) there is a big difference between the performance of the studied sample and the level required to score on criterion referenced variables as Torrance and Ball (Reference Torrance and Ball1990) named them. This finding is consistent with the fact that it is rare to identify people with high creativity in normal samples, (b) the hierarchy of items revealed itself to be coherent with the theoretical expectations of those indicators, such as the fact that it was easier to score on flexibility in Activity 2 than in Activity 3, which coincide with Torrance’s arguments (1966, 2000) when he describes Activity 3 as requiring the ability to return to the same stimulus repeatedly and perceive it in a different way in order to have an original idea. Such a process would require a greater flexibility on the part of the subject, (c) in Factor 3, which grouped distinct characteristics but all were related to Activity 1, the hierarchy of complexity of the items was similar to the one found in Factors 1 and 2.
An issue that arises refers to the misfit noted in some of the test items and the low values of internal consistency indexes. Does this prove that the instrument has poor reliability or that items should be eliminated because they don’t measure the construct as expected? From a point of view of the validity argument these observations, especially in Factor 2, may point out that part of the items - emotional expression and fantasy - may not make up a quantitative dimension together with the other items in the factor. But this is an issue for further studies. But these results alone cannot be considered as a definitive conclusion in favour of a low reliability for the whole test because: (a) internal consistency is only one of the methods to estimate reliability where the stability coefficients together with test-retest data indicate much higher levels, which have already been reported, (b) if we take into consideration the hierarchical structure, admitting the existence of a global factor, and rerun the analysis with all the items, the internal consistency of the global scale return is found to be 0.80 and only in one item presents an outfit index above 1.30, (c) the misfit indexes occurred in the outfit statistics and not the infit, a situation that does not strongly advise the removal of the items (Linacre, Reference Linacre2009), (d) the elimination of items cannot be carried out taking into account only a criteria of internal consistency (homogeneity) but should also consider criterion validity. Thus, considering the discrepancy between the results obtained by modelling with the partial credit model in Factor 2 and the past evidence that made use of other statistical methods, we alert to the need of a more detailed study to evaluate the results of the partial credit model for this set of items. For this reason, we suggest care should be taken while interpreting the results of that factor.
Even though the evaluation of the personality characteristics associated with creativity are usually used for creativity tests and divergent thinking (Almeida et al., Reference Almeida, Prieto, Ferrando, Oliveira and Ferrándiz2008; De La Torre, Reference De La Torre1991; Guilford, Reference Guilford1956; Kim, Reference Kim2006; Rosas, Reference Rosas1984; Torrance, Reference Torrance1966; Torrance & Safter, Reference Torrance and Safter1999), its placement in a continuum of latent creative ability was only possible due to the application of the method used in this study. This attests to the practical importance of the use of IRT, especially for the partial credit model, in the interpretation of the construct in divergent thinking tests.
Instead of just interpreting standardized measures using no referenced interpretation that anchors the interpretation of the scale based on relative position of persons and statistical information to a distribution, by using the adopted model a direct relationship was made with regards to measure and the performance of the subjects in the test items. Further, the hierarchical analysis of the item placement relative to the latent scale allows for the formulation of more substantial interpretations of the construct, supplying even more information regarding the scale and allowing for the study of construct validity, in an attempt to resolve some of the issues that have arisen in literature regarding the assessment of creativity.
Thus, this study points to a definition of relative importance of score criteria used in creativity tests by indicating how they organize themselves hierarchically (in terms of difficulty or intensity of the construct). This information may be used in future studies looking for evidence of validity for divergent thinking tests, for instance, studies on how well characteristics would be in their capacity to discriminate criterion groups of people identified as creative. It can also be used in the construction of a simplified correction model, or still for the development of a reduced version of the instrument.