I. INTRODUCTION
Reconfigurable microstrip antennas have received considerable attention in the recent years [Reference Behdad and Sarabandi1–Reference Parihar, Basu and Koul5] for their properties of adapting with change in the environmental and system requirements. Switching speed of such antennas has not received much attention, but a few applications have been reported where this is important [Reference Logothetis and Poor6, Reference Vian and Popovic7]. To obtain reconfigurable polarization, several printed structures have been investigated. In [Reference Kim, Pan, Nikolaou, Papapolymerou, Tentzeris and Kim8], a circular microstrip patch antenna with U-shaped slot on top is proposed to achieve reconfigurable polarization. Triangular truncated square patch connected with triangular small patches through PIN diodes is reported in [Reference Sung, Jang and Kim9]. In [Reference Chung, Nam, Yun and Choi10], U-slot patch with truncated corners is presented which achieves linear polarization (LP), right hand circular polarization (RHCP), and left hand circular polarization (LHCP). Two orthogonal slots with PIN diodes are incorporated into the patch in [Reference Yang and Rahmat-Samii11] to radiate with switchable dual circular polarization. In [Reference Fries, Grani and Vahldieck12], microstrip fed slot ring antenna allowing polarization switching was reported.
In this paper, switching characteristics of a reconfigurable polarization antenna are investigated in time domain. The antenna under consideration utilizes a conventional square microstrip patch antenna with all four corners truncated circularly. It is very similar to the antenna presented in [Reference Sung, Jang and Kim9], but the circular cuts (as opposed to the straight cuts in [Reference Sung, Jang and Kim9]) at corners minimize operating frequency shift from one state to another. Electromagnetic characteristics of the present antenna (return loss and axial ratio) were reported in [Reference Parihar, Basu and Koul13]. Radiation and time-domain characteristics (received powers, radiation patterns, gain, and transient response) are reported here. Time-domain measurements and simulations incorporating actual diodes and bias lines were carried out and demonstrated some novel features of the proposed antenna.
To achieve reconfigurable polarization, all four corners are connected to small circular sector patches through four PIN diodes (Fig. 1) that enable switching between three different polarization states. Time-domain simulations were carried out using the 3D electromagnetic simulator “CST Microwave Studio” [14] and the circuit simulator “Agilent ADS” [15].
Geometry of the proposed antenna including bias circuit.

II. SWITCHABLE POLARIZATION ANTENNA
The antenna under consideration has been described in detail in [Reference Parihar, Basu and Koul13] and Fig. 1 with detailed dimensions is repeated here only to recall the basic geometry of the switchable polarization antenna. The proposed antenna is printed on 0.508 mm (h) thick flexible substrate having ɛr = 3.2. These dimensions resulted in a measured centre frequency of 5.05 GHz at all three polarization states. Polarization reconfigurability in this antenna is obtained by controlling the bias currents in the four PIN diodes. To activate the PIN diodes, bias current of at least 5 mA/diode is required. With a common bias line for four diodes, three bias states (positive or forward bias with VDC > 0.7 V, negative bias with VDC < −0.7 V and 0-bias with VDC = 0 V) can be achieved. Under 0-bias, all diodes are switched off and four circular sector patches are disconnected from the circular truncated patch. With this configuration the antenna exhibits LP. When VDC > 0.7 V, diodes D1 and D2 will operate in forward-biased state and D3, D4 in the reverse-biased condition; consequently antenna will radiate RHCP. For VDC < −0.7 V, diodes D1, D2 will operate in reverse-biased state and D3, D4 will operate in forward-biased state, resulting in LHCP.
To confirm that this antenna actually operates in the 3 states (LP, RHCP, and LHCP), as described in [Reference Parihar, Basu and Koul13], it was irradiated from broadside using a horn transmitting −6 dBm located 2.1 m away. Incident polarization (“x” or “y” as designated in Fig. 1) was different for the six cases. The received powers for these six cases are shown in Fig. 2 and confirm that the three states are indeed realized. This result is actually the most important from a practical point of view. Of course equal powers in x- and y-polarized states does not guarantee circular polarization (it can be slant polarization too) but, as mentioned in [Reference Parihar, Basu and Koul13], simulations confirm that circular polarization is indeed realized here.
Measured power of antenna under three polarization states.

Radiation patterns are described next. Figures 3–5 show the simulated as well as measured radiation patterns at 5.05 GHz, for three cases. For all measured results, the Antenna under test (AUT) was used as receiver and was illuminated with a plane wave (x- or y- polarized; refer to Fig. 1). These are all “H-plane” (if this was a simple patch) results. The measured y-polarization appears substantially more than the simulated level (which may be caused by the on-board resister and measurement inadequacies) but is actually quite low: 25 dB below the peak x-polarized power. Measured radiation pattern characteristics of antenna for RHCP and LHCP are shown in Figs 4 and 5. Here, the difference between x-polarization and y-polarization is <3 dB for RHCP and LHCP, which shows that antenna radiates with circular polarization upto ±30° around broadside.
Measured and simulated radiation characteristics of the antenna (zero bias applied to all diodes for obtaining LP).

Measured and simulated radiation characteristics of the antenna (diodes D1 and D2 forward biased and diodes D3 and D4 reverse biased for RHCP).

Measured and simulated radiation characteristics of the antenna (diodes D3 and D4 forward biased and diodes D1 and D2 reverse biased for LHCP).

Measured and simulated gain of proposed antenna in LP state is shown in Fig. 6. The measured gain of fabricated antenna is 5.9 dB at 5.05 GHz which is in very close agreement with simulated gain (6.7 dBi).
Measured and simulated gain of the proposed antenna for LP state.

To better understand that the antenna is circularly/linearly polarized, the AUT is illuminated by linear polarized patch antenna at four different rotations (feed-line along x, y, y′ = (x + y) and x′ = (x − y) as shown in Fig. 7). The measured received powers for each of three polarization states of the AUT with four different polarizations of the transmitter are shown in Figs 8–10. The received power is plotted against the relevant “angle”. The “angle” in all these plots is the spherical co-ordinate θ, with φ = 90° for negative θ, and φ = 270° indicating positive θ. These plots confirm that axial ratio ~20 dB for linear-polarized state, and ~3 dB for both the circularly polarized states, around broadside. Figure 8 shows the LP state of receiver antenna. Here, the difference between lp_x and lp_y powers is >22.5 dB which indicates LP of proposed antenna. Figures 9 and 10, show the receiver power for RHCP and LHCP. Ideally, for proper circular polarization irrespective of the incident angles, the received powers should be same. The actual difference <3 dB which indicates that antenna is circularly polarized. All measurements have been carried out in anechoic chamber.
Different orientations of transmitting antenna for circular polarization measurements.

Measured power at different polarization angles for LP state of proposed antenna.

Measured power at different polarization angles for RHCP state of proposed antenna.

Measured power at different polarization angles for LHCP state of proposed antenna.

Sense of polarization was not determined explicitly, but it is well-established for the patch antenna with a cut at the corner, and was also seen from simulations in this case.
The shift in the resonance frequency for straight cut [Reference Sung, Jang and Kim9] and circular cut when antenna changes its polarization state from LP to LHCP is given in Fig. 11. It is shown here that, with straight cuts in antenna the shift in resonance frequency is 40 MHz compared to circular cuts where the shift in frequency is only 19 MHz for LP to LHCP transition.
Shift in the operating frequency (simulated) with polarization states, for circular cut (this work) and straight cut following [9] with size scaling to match frequency.

III. TRANSIENT ANALYSIS OF SWITCHABLE POLARIZATION ANTENNA
A) Time-domain simulation
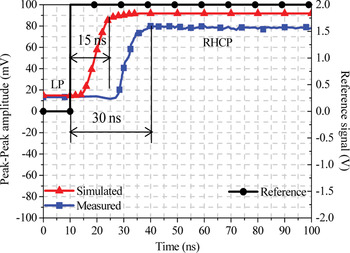
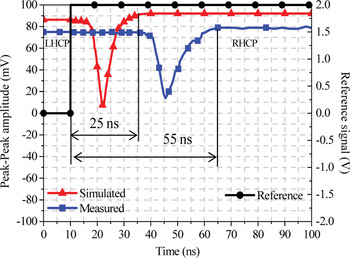
Transient simulation to estimate polarization switching times can be carried out using a combination of CST and ADS. For this, first the antenna is modeled in CST using discrete ports and waveguide ports. As shown in Fig. 12, the model in CST is a combination of three antennas; one is a reconfigurable antenna and the other two are simple patches, but are oriented in x- and y-direction. Due to a restriction on the number of mesh cells in the simulator, only 10 cm spacing between antennas was kept. Since far-field in this case is 16 cm away, this simulation will not yield accurate values for radiation pattern or gain, but should yield reasonable values for timings. Nine “discrete ports” or “internal ports” (ports 4–12) are used to define four diodes and one dc bias point. For each diode two internal ports are defined. In addition, three radio frequency (RF) excitation ports are defined as waveguide ports. Impedance of all ports in the model is 50 Ω. After simulating the structure in CST, the 12 × 12 S-matrix is extracted for circuit simulation in ADS as shown in Fig. 13. In the ADS circuit, port 1 is connected to a 5.05 GHz (centre frequency of the reconfigurable antenna) RF source. Diodes are biased using a control signal applied at port 8. Port 2 and port 3 are used to receive the X and Y components of the radiated signal. Owing to space constraints, only the waveforms at ports 2 and 3 are shown in Figs 14–16. The simulation predicts that the antenna is able to switch rapidly (within 15 ns) from LP to RHCP and takes around 25 ns to switch from LHCP to RHCP.
Model to extract the S-parameters of switchable polarized antenna.

ADS model for transient analysis.

X component of output signal (red) at port 2 when bias changes from zero to high level. Input pulse signal (black) is shown for reference.

Y component of output signal (red) at port 3 when bias changes from zero to high level. Input pulse signal (black) is shown for reference.

Y component of output signal (red) at port 3 when bias changes from low to high level. Input pulse signal (black) is shown for reference.

Right Y-axis shows the input pulse signal as time reference. For all these results the implicit assumption is that the polarization when two diodes are ON is indeed close to circular, or strictly speaking elliptical with major axis along X and minor axis along Y.
So equality of x-polarized and y-polarized signals is taken to be synonymous with circular polarization (and not slant polarization, say). This has been confirmed from CST simulations, and some more details have been presented in [Reference Parihar, Basu and Koul13].
B) Time-domain experimental results
The setup for measurement of switching characteristics of the fabricated antenna is shown in Fig. 17. The control signal was generated by a pulse generator (Agilent 81133A) which had limited current driving capability, necessitating the amplifying circuit shown in Fig. 13. Zero-high or low-high signals were taken from the circuit as shown in Fig. 13. The received signal was observed using an Agilent infiniium DSO-X 92504 25 GHz digital storage oscilloscope (DSO).
Measurement setup to measure the switching time.

The diode used was beam-lead HPND-4038, with SPICE parameters: I s = 1nA, C jo = 90 fF, V j = 8 V, and R s = 2 Ω used for simulation. Unfortunately, a better model was not available. The diode current levels were controlled using a series 100 Ω resistor mounted on the antenna board. The voltage waveforms at the input to this resistor are shown in Fig. 18. These indicate that the switching time is ~30 ns. Better estimates are available from the DSO. Using the same notation as in Fig. 12, the received signals with receiver antenna oriented for x- and y-polarization are shown in Figs 19–21. The inverted output of the Agilent pulse generator is shown (in black) along with the microwave signal for time reference – this is further inverted by the pulse amplifying circuit, so high and low levels of this do actually correspond to the antenna control signal.
Switching waveforms (bias voltage just before diode + current-control resistor): (a) for LP to RHCP, (b) from LHCP to RHCP.

X component of the signal (blue) when bias changes from zero to high level. Inverted pulse generator output is shown in black for reference.

Y component of the signal (blue) when bias changes from zero to high level. Inverted pulse generator output is shown in black for reference.

Y component of the signal (blue) when bias changes from low to high level. Inverted pulse generator output is shown in black for reference.

The strength of the x-polarized part of the transmitted field falls only slightly as shown in Fig. 19. The y-polarized component for a control signal transition from zero to high level (LP to RHCP) is shown in Fig. 20. It can be seen that the antenna changes its polarization state from LP to RHCP within 30 ns. For LHCP to RHCP change, the y-polarized signal now takes ~55 ns to settle to the proper level as shown in Fig. 21. This may be because diode turn-off is involved, which is a slower process, but this reasoning cannot be confirmed at this stage.
In the intervening period, when all diodes are off, LP is briefly observed. As far as we are aware, these effects in reconfigurable antennas are reported for the first time – the fact that the turn-off may take as much as 55 ns (the diode data sheet specifies 2 ns as the switching time, even though the use of an optimized driver is implied) should be kept in mind during design of systems which use such antennas.
Comparison of measured results with simulation is shown in Figs 22 and 23. Here, peak-to-peak values of the waveforms are plotted as a function of time, and measured voltages (Figs 20 and 21) are multiplied by a factor of 7.5. It is because in measurement the distance between two antennas is 75 cm compared to 10 cm in simulation (Fig. 12). The input power level (2.5 dBm) is kept same in both cases. It is clear that the received signal amplitude is well predicted by simulation, but the difference in delays is significant.


It was checked that the difference in simulated and measured delay was not caused by different path-lengths: the path-length from signal generator to DSO (timing reference) was roughly the same as from pulse generator to pulse-amplifier to transmitting antenna to receiving antenna to DSO. It may be possible to explain this with a better diode model.
IV. CONCLUSION
A microstrip-fed square patch with circular truncated corners for polarization reconfigurability has been characterized in time-domain. Transient measurements indicated that polarization switching from linear to circular can be achieved in 30 ns and one circular polarization to the other can be achieved in 55 ns, using a simple 1-BJT diode driver circuit. For systems which require ultra-fast switching, this delay has to be taken care of.
 Manoj S. Parihar did B.E. in Electronics and Communication Engineering and M. Tech. in Microwave Engineering from the Rajiv Gandhi Proudyogiki Vishwavidyalaya (RGPV), Bhopal in 2001 and 2004, respectively. He joined the “Centre for Applied Research in Electronics, Indian Institute of Technology Delhi” as full time Ph.D. student with research assistantship. His research interests include: Reconfigurable Antennas, Microwave Integrated Circuits, Microwave & Millimeter Wave device characterization and radio frequency microelectromechanical system (RF MEMS).
 Ananjan Basu (born Aug 12, 1969) did B.Tech. in Electrical Engineering and M.Tech. in Communication and Radar Engineering from I.I.T. Delhi in 1991 and 1993, respectively, and Ph.D. in Electrical Engineering from the University of California, Los Angeles in 1998. He has been employed at the Centre for Applied Research in Electronics, I.I.T. Delhi as Assistant Professor from 2000 to 2005 and as Associate Professor since 2005. His specialization is in Microwave and Millimeter-wave component design and characterization.
 Shiban K. Koul received the B.E. degree in Electrical Engineering from the Regional Engineering College, Srinagar, India, in 1977, and the M.Tech. and Ph.D. degrees in Microwave Engineering from the Indian Institute of Technology Delhi, India. He is a Professor with the Centre for Applied Research in Electronics, Indian Institute of Technology Delhi where he is involved in teaching and research activities. His research interests include: RF MEMS, Device modeling, Millimeter wave IC design and reconfigurable microwave circuits including antennas. He is the Chairman of M/S Astra Microwave Pvt. Ltd., a major private company involved in the Development of RF and Microwave systems in India. He is author/co-author of 192 research papers and seven state-of-the art books. He has successfully completed 25 major sponsored projects, 50 consultancy projects and 30 Technology Development Projects. He holds seven patents and four copyrights. Professor Koul is a distinguished IEEE Microwave Theory and Techniques Lecturer for the year 2012–2014.