Introduction
The simultaneous downscaling of silicon-based transistors and their integration on high-performance radio-frequency (RF) Silicon-on-Insulator (SOI) substrates have enabled the development of competitive System-on-Chips (SoCs) with integrated front-end modules working at microwave and millimeter-wave (mm-wave) frequencies. Among those SOI substrates, the trap-rich (TR) substrate answers the demands in terms of very low propagation loss and harmonic distortion at microwave frequencies, thanks to its high effective resistivity.
The effective resistivity was first introduced as a figure of merit (FoM) to characterize the RF losses of a substrate, based on a coplanar waveguide (CPW) line analysis, independently from its conductor losses [Reference Lederer and Raskin1]. Then, it has been used to characterize the impact of the substrate on the crosstalk between two structures [Reference Ben Ali, Roda Neve, Gharsallah and Raskin2], the quality factor of inductors [Reference Liu, Zhu, Allibert, Radu, Zhu and Lu3], the harmonic distortion in passive structures [Reference Roda Neve and Raskin4], and in RF switch modules [Reference Kazemi Esfeh, Rack, Makovejev, Allibert and Raskin5].
In general, a transmission line is represented as a two-wire line (signal and ground, cf. Fig. 1(a)), described by two complex parameters, i.e. its characteristic impedance (Z c) and its propagation constant (γ). A piece of transmission line of infinitesimal length (dz) can be modeled as a lumped-element circuit, as shown in Fig. 1(b), described by R, L, G, and C. They are defined as
Two-wire (signal and ground) transmission line model (a). Lumped-element equivalent circuit (b).

R is the series resistance per unit length, for the signal and ground conductors, in Ω/m.
L is the series inductance per unit length, for the signal and ground conductors, in H/m
G is the shunt conductance per unit length, in S/m.
C is the shunt capacitance per unit length, in F/m.
The well-known expressions to move from one representation (γ, Z c) to the other (RLGC) are [Reference Pozar6, Reference Marks and Williams7]


The RLGC line elements representation is more convenient to our case as it gives more physical insight. Indeed, the G and C terms describe the admittance of the transmission line cross-section, which is of particular interest for substrate characterization.
Figure 2(a) represents a general non-homogeneous structure located below the CPW metal line. In integrated circuits, the substrate is usually made up of a dielectric layer (oftentimes silicon dioxide) below which the semiconductor bulk material (usually silicon) is located. Furthermore, the semiconductor region is in general characterized by a space-dependent resistivity (ρ(x, y)). To characterize the overall performance of this material stack with regards to the performance of overlying RF and mm-wave passives, it is convenient to equate this material stack to an equivalent effective substrate (Fig. 2(b)) of uniform effective relative permittivity (ε r,eff) and uniform effective resistivity (ρ eff).
Cross-section of a CPW line on top of a general multilayer structure (a) and of an effective uniform substrate (b), along with the dimensions of the measured CPW lines.

In this equivalent effective structure, the line shunt capacitance C is the sum of a top contribution (C top), including the metallization thickness, and a bottom contribution (C bot) from the effective substrate. They are expressed as the product of the medium permittivity and a geometry factor (F top, F bot) that depends on the CPW cross-section dimensions, such that


where ε r,top is the relative permittivity of the top medium and Y bot is the equivalent admittance of the bottom structure. The geometry factor accounts for the field distribution among the top and bottom parts and is computed by accurate closed-forms analytical expressions formulated in [Reference Heinrich8]. Assuming no losses in the top medium (air in this case), the shunt conductance is given by


This expression for ρ eff is equivalent to the original definition of the effective resistivity given in [Reference Lederer and Raskin1], which is

and can be derived from (9b) by defining q and C 0, as the filling factor and the air-filled capacitance, respectively. They are related to the top and bottom geometry factor by


The effective resistivity computed from (10) accounts for all shunt RF losses (not series metallic losses) present in the non-uniform structure, originating from some real component of the shunt admittance ${\rm \Re }\lpar {Y_{bot}} \rpar$ . The term resistivity is used, because these RF losses are interpreted as conductive losses in the substrate. Keeping in mind that interpretation, the effective uniform resistivity and permittivity strongly decay with increasing frequency in the low frequency range, because the slow-wave mode is still dominant. Then, they are expected to reach a plateau and remain constant at higher frequencies. However, this is not necessarily observed in practice, mainly for substrates having a high effective resistivity. Indeed, in the substrate samples presented in this paper, a significant decrease of ρ eff with frequency is observed above 5 to 10 GHz.
As it will be explained in the following sections, two reasons for this unexpected decay of effective resistivity are identified: (i) a misestimation of the characteristic impedance (Z c) of the transmission lines and (ii) the presence of additional non-conductive losses in our samples. Section “Description of the new extraction procedure” describes a correction method for the correct evaluation of Z c as well as a new extraction procedure of the effective substrate parameters, including dielectric losses. Section “Detailed study of effective resistivity extraction on a trap-rich substrate” shows the characterization of a TR substrate applying this new methodology. Section “Sensitivity of the R-based method to input parameters” discusses the limitations of this characterization procedure. Section “Cutoff frequency” presents the cutoff frequency above which the effective dielectric losses become the dominant loss mechanism. Then, section “Validation up to 220 GHz” confirms the correctness of the new extraction procedure up to 220 GHz with CPW lines measurements on three different substrates. Finally, the origin of the large value of dielectric loss that is extracted is discussed in section “Discussion about dielectric loss”. An earlier version of this paper was presented at the 2019 14th European Microwave Integrated Circuits Conference and was published in its Proceedings [Reference Nyssens, Rack and Raskin9].
Description of the new extraction procedure
This section describes a new extraction procedure of effective substrate parameters, yielding physically meaningful substrate loss parameters at mm-wave frequencies. In section “Sensitivity analysis of the extracted characteristic impedance”, it is shown how a misestimation of the imaginary part of $Z_c\lpar {\rm \Im }\lpar Z_c\rpar \rpar$ leads to a wrong evaluation of metallic and substrate losses. A method is proposed to correct it in section “R-based method”. In section “Inclusion of dielectric losses”, the uniform effective substrate model is extended to include dielectric losses. A new procedure to extract simultaneously conductive and dielectric losses is also proposed.
Sensitivity analysis of the extracted characteristic impedance
As stated in section “Introduction”, a transmission line is fully described by two complex parameters, i.e. its characteristic impedance and its propagation constant. While the multiline Thru-Reflect-Line (mTRL) algorithm [Reference Marks10] gives the value of γ in a straightforward and accurate manner, the estimation of Z c is more complex and several methods exist to evaluate it. Aiming at extracting the substrate properties, it is necessary to express γ and Z c in terms of the RLGC line elements (cf. Fig. 1(b)).
For low-loss transmission lines (R ≪ jωL and G ≪ jωC), (1) and (2) become

and (γ = α + jβ)


These equations can be turned around in order to evaluate G and R:


Here, the second term of the products shows plainly that an (under-) over-estimation of ${\rm \Im }\lpar {Z_c} \rpar$ will have the effect of (over-) under-estimating R and (under-) over-estimating G. Indeed, as stated above, the total loss α is accurately evaluated by the mTRL approach. Hence, an error in the extracted ${\rm \Im }\lpar {Z_c} \rpar$
 induces an error in the repartition of this total loss to the series metallic R term and to the shunt substrate G term.
The extraction of Z c relies on multiple assumptions and, therefore, there exist multiple methods for its extraction. The methods suited to silicon substrates are based on a two-tier calibration. First, a calibration is done on an impedance standard substrate (ISS) calkit in order to move the reference plane to the probe tips, defined with respect to a 50 Ω reference impedance. Then, lines of different lengths and a reflect structure are measured. Each method relies on a particular modeling of the transition between the probe tips and the middle of the shortest line (thru).
CPW lines fabricated on top of a TR SOI wafer are measured from 10 MHz to 67 GHz using an Agilent 2-port PNA-X vector network analyzer and a pair of GSG Infinity probes from Cascade Microtech. The CPWs are fabricated using aluminum, and their dimensions, which were measured using a precision profiler, are described in Fig. 2(b). An open structure, a thru (102.8 μm-long) and two lines of different lengths (2102.8 and 8102.8 μm) are measured. A Short-Open-Load-Thru (SOLT) calibration is performed on an ISS calkit. Then, CPW lines of different lengths are measured and the mTRL algorithm is applied to extract the propagation constant. Figure 3 shows the characteristic impedance as well as the series metallic loss (R) and shunt substrate loss (G), using several methods of Z c extraction [Reference Dehan11–Reference Williams, Arz and Grabinski13]. For each method, the RLGC elements are obtained from (3)–(6). The glitches at 30 and 60 GHz are a consequence of the fact that the mTRL algorithm is ill-conditioned when the line length differences are a multiple of a half wavelength.
Distributed R (a) and G (b) line elements of the CPW lines, as well as the real (c) and imaginary (d) parts of its characteristic impedance versus frequency using several Z c extraction techniques: [Reference Dehan11] (red, “v”), [Reference Nyssens, Rack and Raskin12] (green, “d”), and [Reference Williams, Arz and Grabinski13] (blue, “s”). R and G are computed from (3) and (5).

At low frequencies (below 5 GHz), all the different Z c extraction techniques agree well, giving confidence in the accuracy of the extracted parameters. However, as the frequency increases, an increasingly stronger discrepancy is observed in each parameter.
Figure 3(c) shows that ${\rm \Re }\lpar {Z_c} \rpar$ is extracted with a small relative variation among the different extraction methods. In contrast, from one Z c extraction technique to another, there is a very large relative variation in the estimated value of ${\rm \Im }\lpar {Z_c} \rpar$
 (cf. Fig. 3(d)), which leads to unphysical R and G at high frequencies. An accurate evaluation of ${\rm \Im }\lpar {Z_c} \rpar$
 is crucial to get realistic values of R and G. This statement is further confirmed with a sensitivity analysis.
Using the derivation provided in Appendix A, the sensitivity of R and G is developed from (16) and (17) as


where B R and B G define the maximum boundary values of relative variations, and T G and T R are detailed in Appendix A.
Each term |δx/x|, where x is G, R, C, ${\rm \Im }\lpar {Z_c} \rpar$ , or ${\rm \Re }\lpar {Z_c} \rpar$
 , is observed from measurements based on different extraction techniques. Three extraction methods are shown in Fig. 3 that give different values of the parameters upon which the sensitivity analysis is carried out (C, ${\rm \Im }\lpar {Z_c} \rpar$
 , or ${\rm \Re }\lpar {Z_c} \rpar$
 ). The denominator, x, uses the value of the parameter extracted using [Reference Nyssens, Rack and Raskin12], while the numerator, δx, is computed as the difference between the value of the parameter extracted using [Reference Nyssens, Rack and Raskin12] and of that using [Reference Dehan11]. The term |δx/x| therefore represents the relative uncertainty of variable x, and this uncertainty is given for each term in Table 1, along with the evaluations of the boundaries B R and B G at 10, 20, and 50 GHz.

More details about the computation of these terms are given in Appendix A.
First, it is clear that the observed variations in δG/G and in δR/R are well bounded by the theoretical boundaries computed by B G and B R. Secondly, it is shown that the observed variations in C and ${\rm \Re }\lpar {Z_c} \rpar$ account for <1% variation each in the extracted R and G up to 20 GHz and at most 8% at 50 GHz. We therefore confirm as expected, that the relative uncertainty on the imaginary part of the characteristic impedance is the main contribution to the misestimation of both R and G. An accurate evaluation of ${\rm \Im }\lpar {Z_c} \rpar$
 is therefore crucial to be able to extract the substrate losses. Furthermore, the fact that δG/G (31) and δR/R (33) are close to their respective boundaries confirm that the main uncertainty comes from ${\rm \Im }\lpar {Z_c} \rpar$
 as stated above.
R-based method
A new procedure to correct the imaginary part of Z c is proposed here. First, an existing Z c extraction method is used to compute the terms L and C (from (4) and (6)), which only depend on β and the real part of Z c in the low-loss transmission line approximation. From this first extraction, that we shall label as “1”, trusted values for C 1 and L 1 are obtained. Ultimately, we are interested in extracting a trusted value of G toward substrate electrical characterization. But, as we have seen, it is difficult to evaluate ${\rm \Im }\lpar {Z_c} \rpar$ with sufficient precision for series losses R 1 and shunt losses G 1 to be well discriminated, and this is especially true for high-quality substrates (low G), and at high frequencies. We therefore propose the R-based method, by which we will suppose that R is perfectly known over the entire frequency range. In practice, R forced is set by the closed-form analytical expressions given in [Reference Heinrich8], and G corr is computed using

It is important to note that this method is no longer a pure extraction technique, as R forced is now an input to the extraction, and must be accurately known for meaningful results. In general, we found that knowing the metal dimensions along with its conductivity permits a fairly accurate estimation of R forced. Nevertheless, the value of R 1 from the initial extraction is trusted up to at least 5 GHz, as it was observed in section “Sensitivity analysis of the extracted characteristic impedance”. Therefore, if an uncertainty in the metal dimensions or conductivity still persists, a fine tuning of one of these parameters can be performed to ensure a good matching of R forced with R 1 at low frequency.
In practice, only the real part of (20) is taken just to ensure that we have a real value for G, the imaginary part of the right-hand side of (20) is negligible (at least 2 orders of magnitude lower than the real part). The method from [Reference Nyssens, Rack and Raskin12] provides a valid extraction of ${\rm \Re }\lpar {Z_c} \rpar$ , because it leads to meaningful values of L, i.e. decreasing smoothly with frequency due to the skin effect, and C, i.e. constant with frequency. It is therefore chosen for the computation of L and C in the present resistance-based method.
The correction applied to ${\rm \Im }\lpar {Z_c} \rpar$ is significant. Figure 4 shows the imaginary part of Z c as well as the series metallic loss (R) and shunt substrate loss (G) using solely [Reference Nyssens, Rack and Raskin12] (first extraction method, in green) and applying the R-based method to correct ${\rm \Im }\lpar {Z_c} \rpar$
 (in brown). Once the substrate-related loss parameter (G corr) is well extracted, it still has to be associated to physical loss mechanisms. This is done in the next part.
Distributed R (a) and G (b) line elements of the CPW lines, as well as the imaginary (c) part of its characteristic impedance versus frequency: (i) using only [Reference Nyssens, Rack and Raskin12] (“d”, green), computed from (3) and (5), and (ii) by applying the R-based method (“x”, brown), i.e. with (20).

Inclusion of dielectric losses
The substrate loss term G has been corrected; however, the loss-mechanisms behind it still need to be identified. Figure 4(b) shows that G corr increases with increasing frequency. This behavior is uncharacteristic of a purely conductive substrate and warrants the investigation into frequency-dependent losses, the first of which to be discussed are dielectric losses.
If the model presented in Fig. 2(b) is extended to include dielectric losses, then the shunt admittance of the transmission line can be written as follows:

and G and C become


where complex effective relative permittivities are defined for the top and bottom materials: $\epsilon _{r\comma eff} = \epsilon _{r\comma eff}^{\rm ^{\prime}} -j\epsilon _{r\comma eff}^{\rm \prime\prime }$ and $\epsilon _{r\comma top} = \epsilon _{r\comma top}^{\rm ^{\prime}} &eqbreak;-j\epsilon _{r\comma top}^{\rm \prime\prime }$
 .
Due to the frequency linear term of (22), if dielectric loss is non-negligible and (10) is used to evaluate the effective resistivity, then it would yield a ρ eff that is decreasing with frequency. In the present study, the material on top of the CPW metal lines is assumed to be air, corresponding to $\epsilon _{r\;\comma top}^{\rm \prime\prime } = 0$ . The discussion could easily be extended to a general material for which $\epsilon _{r\;\comma top}^{\rm \prime\prime } \ne 0$
 . To include conductive and dielectric loss mechanisms, the effective loss tangent is defined as

with

where (25) is the definition of the effective dielectric loss tangent. Then, two frequency-independent fitting parameters $\tilde{\rho }_{eff}$ and $\tan \tilde{\delta }_{d_{eff}}\;$
 are extracted by the least-squares method applied to (24) over an intermediate frequency range. Once those two parameters are extracted, one can assess their consistency by computing two equivalent frequency-dependent material parameter FoMs, i.e.


Detailed study of effective resistivity extraction on a trap-rich substrate
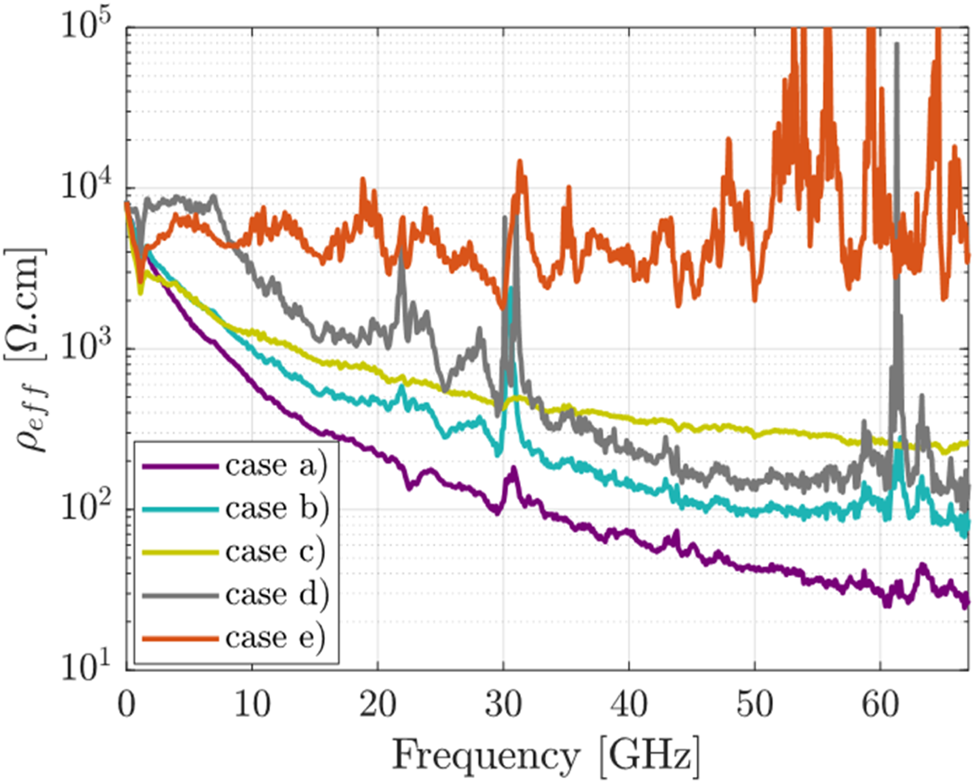
This section shows the effective resistivity extracted in different ways. Section “Description of the new extraction procedure” showed that the substrate shunt loss G is very sensitive to the accurate evaluation of the imaginary part of Z c. A method to correct it was proposed. Finally, the definition of the effective resistivity is extended to separate the contribution of dielectric and conductive losses to the total substrate losses. The present section's purpose is to illustrate the relevance of each step from the previous sections on the correct extraction of the effective substrate loss parameters. To that end, the effective resistivity and/or dielectric loss tangent are extracted in many different ways detailed in the following. Note that the propagation constant is the same in all the cases and is extracted from the mTRL algorithm.
(a) The method from [Reference Dehan11] is used to extract Z c. From γ and Z c, the term G is computed with (5). Equation (10) is used to evaluate the effective resistivity.
(b) The method from [Reference Nyssens, Rack and Raskin12] is used to extract Z c. From γ and Z c, the term G is computed with (5). Equation (10) is used to evaluate the effective resistivity.
(c) The method from [Reference Nyssens, Rack and Raskin12] is used to extract Z c. The R-based method is applied to correct ${\rm \Im }\lpar {Z_c} \rpar$
 and (20) is used to compute G. Then, the effective resistivity is evaluated from (10).
(d) The method from [Reference Nyssens, Rack and Raskin12] is used to extract Z c. From γ and Z c, the term G is computed with (5). Fitting values of $\tilde{\rho }_{eff}$
and $\tan \tilde{\delta }_{d_{eff}}$ are extracted from the fitting of (24). Then, the effective resistivity is evaluated from (26).(e) The method from [Reference Nyssens, Rack and Raskin12] is used to extract Z c. The R-based method is applied to correct ${\rm \Im }\lpar {Z_c} \rpar$
and (20) is used to compute G. Fitting values of $\tilde{\rho }_{eff}$ and $\tan \tilde{\delta }_{d_{eff}}$ are extracted from the fitting of (24). Then, the effective resistivity is evaluated from (26).


Before commenting on the results, let us note that we expect frequency dependency in the ρ eff for cases (a), (b), and (c), because (10) includes all losses that contribute to ${\rm \Re }\lpar {Y_{bot}} \rpar$ into the term ρ eff.
We expect a flatter ρ eff for cases (d) and (e), as (26) is used, that basically removes linear frequency-dependent losses from the term ρ eff, and associates them instead to a term $\tan \tilde{\delta }_{d_{eff}}$ .
Figure 5 shows the extracted effective resistivity in each case from 10 MHz to 67 GHz.

The first case (a) (purple) represents an extraction of the effective resistivity with a commonly used extraction method of Z c. It is seen that ρ eff decreases significantly from 8 kΩ.cm to 700 Ω.cm up to 10 GHz.
It never reaches a plateau, even though the slow-wave mode is suppressed above a few tens of MHz.
The second case (b) (light blue) uses a more advanced technique to extract Z c.
Case (c) (yellow) applies the same Z c extraction technique as case (b), but then the R-based method from section “Description of the new extraction procedure” is applied for a better separation of series (metallic) losses R and shunt substrate losses G at high frequencies (above 10 GHz). Please note that the effective resistivities for cases (b) and (c) are close to each other up to 9 GHz, because G 1 (used in case (b) to extract ρ eff and G corr (used in case c) to extract ρ eff are very close, as was shown and mentioned in Fig. 4(b).
For all the three first cases (a) to (c), the evaluated effective resistivity, using (10), decays for increasing frequencies, which indicates that conductive loss in the substrate is not sufficient to model the term G.
Case (d) (grey) uses an advanced technique to extract Z c, but does not apply the R-based correction method. Therefore, G is well evaluated up to only 9 GHz (cf. Fig. 4(b)). By including dielectric loss in the extraction using (26), an overall flat (except for the glitch at 1 GHz) effective resistivity is obtained up to 7 GHz. However, the misestimation of ${\rm \Im }\lpar {Z_c} \rpar$ prevents an accurate extraction of substrate loss parameters in the mm-wave spectrum above this frequency.
Case (e) (brown) applies the whole procedure explained in section “Description of the new extraction procedure”. First, the R-based method corrects the G parameter. Then, ρ eff is obtained from G corr by including dielectric loss in the extraction using (26). In this case, it is shown that ρ eff is flat across the whole measured frequency range, at a mean of around 5 kΩ.cm, lending physical meaning to this extraction. Indeed it was necessary to remove the dielectric loss contribution (extracted from the curve fitting of (24), yielding $\tan \tilde{\delta }_{d_{eff}} = 9.86 \times 10^{{-}3}$ ) to the total substrate loss. It should be noted that the fluctuations in ρ eff are expected, as we are dealing with a highly resistive low-loss substrate, and the G parameter is low.
This case study highlights the need to (i) accurately estimate the imaginary part of the characteristic impedance and (ii) to extend the substrate loss extraction model by the inclusion of dielectric loss, in order to extract meaningful substrate properties. In order to achieve this for low-loss substrates up to mm-wave frequencies, it was required that the metallic loss be perfectly known so that the R-based method can be applied. The next section discusses the sensitivity of the extraction technique to the assumed knowledge of R.
Sensitivity of the R-based method to input parameters
This new R-based method is no longer a pure extraction method, as it relies on the exact knowledge of the R term of the transmission lines. Because of this, it is pertinent to perform a short sensitivity analysis on the input parameters used to calculate R. The expression in [Reference Heinrich8] used to compute R takes the CPW dimensions and the metal conductivity as input variables. Table 2 summarizes the extracted $\tilde{\rho }_{eff}$ and $\tan \tilde{\delta }_{d_{eff}}$
 for two different inputs. The first set of input represents the CPW dimensions from the layout design and the metal conductivity expected from the fabrication process. The CPW dimensions of the second set correspond to measurements of the physical lines with a profiler. The metal conductivity (σ metal) of 3.25 × 10⁷ S/m is chosen to ensure a good match with the R extracted from other Z c extraction methods up to 5 GHz. Indeed, as observed in the previous section, Fig. 3(a) shows that in the lower part of the frequency range, all extraction methods agree on the value and trend (skin effect) of the R(f) curve. The CPW lines were fabricated in our laboratory using aluminum that has a nominal conductivity of 3.82 × 10⁷ S/m [Reference Hayt and Buck14], but that has been measured to be as low as 2.80 × 10⁷ S/m during our process monitoring. Furthermore, the resolution of the photolithography and wet metal etching steps is of the order of a few microns. This explains the difference between the expected and actual CPW dimensions.
Extracted effective parameters and CPW dimensions used as input parameters for the R-based method described in section “Description of the new extraction procedure”

W is the central signal line conductor width, S is the spacing between the conductor line and the ground lines, and t is the metal thickness.
Figure 6 shows R(f), ρ eff(f), and $\tan \delta _{d_{eff}}\lpar f \rpar$ for those inputs. It is important to highlight that even a small variation in the estimation of R(f) leads to significant changes in ρ eff(f), hence the need for the accurate knowledge of R(f). As described above, the effective resistivity, which is directly correlated to the substrate losses, is extracted from the measured insertion loss of a CPW line after withdrawing the conductive losses along the metallic line. When the insertion losses of the line is dominated by the metallic losses, the effective resistivity is very high and quite sensitive to any measurement noise which leads to a pretty noisy corrected ρ eff(f) as observed in Figs 5 and 6(b) in solid brown lines. It is difficult to obtain a smoother curve via measurements, because a variation of the effective resistivity from 5 to 20 kΩ.cm represents a difference of only 5 × 10⁻³ dB/mm in α.
Series metallic loss R(f) (a) versus frequency. ρ eff(f) (b) computed from (26) and $\tan \delta _{d_{eff}}\lpar f \rpar$ (c) computed from (27) versus frequency. Comparison of the new extraction procedure with two sets of input: #1 (“+”, black) and #2 (“x”, brown). The R(f) computed from (3) using method [Reference Nyssens, Rack and Raskin12] to extract Z c is repeated here (“d”, green) to illustrate the good fitting with the other curves at low frequency.

A small variation or uncertainty in the process can lead to significant differences in the extracted $\tilde{\rho }_{eff}$ and $\tan \tilde{\delta }_{d_{eff}}$
 . Nevertheless, though the dimensions from #1 give a good low-frequency fitting of R(f), we see that the overall extraction gives frequency-dependent terms for both ρ eff and $\tan \delta _{d_{eff}}$
 . This suggests that the input R forced(f) for #1, based on σ metal, and CPW dimensions, is erroneous. So, in practice, if there is an uncertainty on σ metal and/or the CPW dimensions, various extraction iterations using different pairs of values [σ metal, dimensions] (close to the expected values) that fit R forced(f) to R 1(f) in the low-frequency range may be carried out, until frequency-independent ρ eff and $\tan \delta _{d_{eff}}$
 are obtained.
This method provides an accurate extraction of the substrate parameters over a wide frequency range. However, it relies on too strong assumptions to be used as a general method. First, the physical dimensions of the lines must be fairly accurately known. Second, the expressions used for R assume a single non-meshed metal layer, without dummy fills, or layer stacking with via arrays. Indeed, the presence of dummy fills is acknowledged to increase R by several percent with frequency [Reference Tsuchiya and Onodera15]. An alternative method potentially applicable in a more general case could be the estimation of R with very precise 3-D electromagnetic (EM) simulations, similarly to what was done in [Reference Galatro and Spirito16]. In that case, a careful layout is needed to simplify the simulation complexity.
Cutoff frequency
It is possible to define a cutoff frequency (f c) that separates the region where the conductive losses in the substrate dominate over the dielectric losses:

The cutoff frequency depends on the value of the effective resistivity and dielectric losses. For instance, if $\tilde{\rho }_{eff} = 4.78$ , $\tan \tilde{\delta }_d = 0.00986$
 , and $\epsilon _{r\comma eff}^{\rm ^{\prime}} = 11.7$
 , then f c = 3.26. Common EM simulators (e.g. ADS Momentum, HFSS) do not allow to define the loss tangent along with the DC resistivity for the same material. Figure 7 shows ρ eff(f) computed from (10) based on ADS Momentum simulations of a CPW line mounted on different types of substrate. Although using (10) to evaluate ρ eff(f) is not physically meaningful as discussed in the previous sections, it is used in this section and the further sections, because it includes all substrate-related losses and therefore information about the substrate loss parameters. The term G(f) or tanδ eff(f), with (24), could have been equivalently used, but the ρ eff(f) is chosen, because it is more often used to describe the RF quality of silicon substrates.
Effective resistivity computed with (10) from CPW lines measurements (dashed line) and ADS Momentum simulations (dotted lines) on several substrates: only dielectric loss (red), only conductive loss (green), both (blue).

The dashed brown line corresponds to measurements extracted with the R-based method to correct ${\rm \Im }\lpar {Z_c} \rpar$ based on the second set of inputs, i.e. using the measured CPW dimensions. The red and green dotted lines correspond to simulations of a substrate with only dielectric and conductive losses, respectively. The dotted blue line represents a substrate consisting of two materials, each one of them including one type of substrate loss. As one could expect, specifying only dielectric losses instead of the substrate resistivity is much more accurate above 4 GHz. For highly resistive substrates with relatively large dielectric losses, it is more accurate to model the substrate by its dielectric losses rather than its conductive losses. Moreover, by considering only dielectric losses in our case, the total losses are underestimated by <0.007 dB over the whole frequency band, compared with the case when both losses are accounted for. Instead, the substrate without dielectric losses underestimates by 0.1 dB the total losses at 50 GHz and this discrepancy increases with frequency. Although our sample does not necessarily represent substrates used in commercial CMOS SOI technologies, care should be taken in circuit design to verify that dielectric losses are not dominating over conductive losses in low-loss substrates.
Validation up to 220 GHz
This section validates the new extraction procedure by comparing the extrapolated model developed in the 0.01–67 GHz range with measurements up to 220 GHz. The first part shows measurements of CPW lines on the same TR substrate that has been used so far. The second part applies the same extraction procedure and comparison to measurements of CPW lines on two different high resistivity (HR) silicon substrates.
Extended frequency range
The CPW lines are measured in a second setup from 140 to 220 GHz using an Agilent 4-port PNA-X vector network analyzer and a pair of GSG Infinity probes from Cascade Microtech. A Line-Reflect-Reflect-Match (LRRM) calibration is performed on an ISS calkit and the mTRL algorithm is applied to extract the propagation constant.
Figures 8(a) and 8(b) show the real and imaginary parts of the characteristic impedance extracted with the method from [Reference Nyssens, Rack and Raskin12] (green) and the R-based method to correct ${\rm \Im }\lpar {Z_c} \rpar$ (brown). The measurements in the 140–220 GHz range are noisier, which is expected, and may also be due to the excitation of higher-order CPW mode. Please observe the very strong correction obtained in ${\rm \Im }\lpar {Z_c} \rpar$
 above 140 GHz thanks to the R-based method. Figure 8 confirms that the new method works well at least as far as 220 GHz. The ρ eff(f) computed with (10) is also extracted from the R-based method and is in very good agreement with the lumped-element equivalent circuit from Fig. 1(b) in dotted line (cf. Fig. 8(c)). This equivalent circuit uses [Reference Heinrich8] to compute R and L from the CPW line dimensions, (22) and (23) to compute G and C with the constant substrate parameters ($\epsilon _{r\comma eff}^{\rm ^{\prime}} \comma \;\tilde{\rho }_{eff}$
 , and $\tan \tilde{\delta }_{d_{eff}}$
 ) extracted from the 0.01–67 GHz measurements and extrapolates G with (22) up to 220 GHz, with excellent agreement.
Real (a) and imaginary (b) parts of the characteristic impedance and effective resistivity computed from (10) versus frequency, from CPW lines measurements of the trap-rich silicon substrate. In green, Z c extracted using the method from [Reference Nyssens, Rack and Raskin12]. In brown, measurements extraction corrected with the R-based method. In dotted black line, reconstructed and extrapolated lumped-element equivalent circuit.

High resistivity samples
Two other wafers were manufactured in our facilities. They consist of a 500 μm-thick bulk HR substrate of 5 kΩ.cm nominal resistivity with a 200 nm-thick dielectric layer on top. On one of the wafers, an SiO2 oxide was thermally grown (the sample is called here HRSiO2), and on the other, an Al2O3 layer is deposited by atomic layer deposition (the sample is called here HRAl2O3). Finally, the same CPW lines as the TR sample are patterned on top of the dielectric. All wafers are measured in the two (low and high frequency) setups.
Figures 9 and 10 present the extracted characteristic impedance and effective resistivity using the method from [Reference Nyssens, Rack and Raskin12] and the one described in section “Description of the new extraction procedure” that applies the R-based method. The measured 140–220 GHz effective resistivity is again in very good agreement with the extrapolated data from the lumped-element equivalent circuit extracted from the lower frequency range (0.01–67 GHz) with the associated substrate parameters displayed in Table 3.
Real (a) and imaginary (b) parts of the characteristic impedance and effective resistivity computed from (10) versus frequency, from CPW lines measurements of the HRSiO2 silicon substrate. In green, Z c extracted using the method from [Reference Nyssens, Rack and Raskin12]. In brown, measurements extraction corrected with the R-based method. In dotted black line, reconstructed and extrapolated lumped-element equivalent circuit.

Real (a) and imaginary (b) parts of the characteristic impedance and effective resistivity computed from (10) versus frequency, from CPW lines measurements of the HRAl2O3 silicon substrate. In green, Z c extracted using the method from [Reference Nyssens, Rack and Raskin12]. In brown, measurements extraction corrected with the R-based method. In dotted black line, reconstructed and extrapolated lumped-element equivalent circuit.

Extracted effective substrate loss parameters from all wafers

The value of $\tilde{\rho }_{eff}$ of the two HR samples is much lower than the nominal resistivity of the bulk material. It is the consequence of unavoidable fixed charges in the dielectric layer that appear during the manufacturing process and induce a highly conductive sheet in the silicon at the interface of the dielectric. It is a well-known phenomenon also called parasitic surface conduction (PSC) [Reference Yunhong Wu, Gamble Armstrong, Fusco and Stewart17]. The $\tan \tilde{\delta }_{d_{eff}}$
 is larger for the HRAl2O3 sample than for the other two, both consisting of a thermal growth of SiO2. It is consistent with the fact that bulk Al2O3 dielectric has a larger loss tangent than bulk SiO2. However, the values of dielectric loss tangent extracted here from our samples HRAl2O3 and HRSiO2 are approximately two orders of magnitude larger than the values of dielectric loss tangent of bulk Al2O3 and SiO2 reported in the literature [Reference Geyer18]. This discrepancy is discussed in the next section.
Discussion about dielectric loss
The values of dielectric loss extracted in the previous section are quite large compared to the dielectric loss of bulk silicon, silicon dioxide, and aluminum oxide, which are in the order of 10−4 [Reference Geyer18]. The value of effective resistivity is consistent with the measured samples and could be predicted. The 4.7 kΩ.cm of the TR wafer is close to the 5 kΩ.cm of the nominal resistivity of the bulk material, meaning that the PSC is effectively eliminated. However, the measurements indicate the presence of additional losses. This can be understood from Fig. 11. This figure displays the total propagation losses (α), in green, extracted using the mTRL algorithm from CPW lines measurements on the TR sample. Most of the losses originate from conductive metal loss due to the skin effect. When we subtract the dielectric loss from the total losses, we obtain the red curve, which is significantly lower than the green curve. This red curve includes all losses from metallic loss to conductive loss in the substrate, within the assumptions made by the model. By mapping the measurements to the model from (22), we associated the additional losses (the difference between the green and red lines) to dielectric losses. These additional losses increase with frequency, in a monotonic fashion and linearly proportional to the frequency. Dielectric loss fits this trend; however, we must remain wary when confronted by the quite large values of $\tan \tilde{\delta }_{d_{eff}}$ , higher than expected for the materials in the substrate. Indeed, another possibility is that these additional losses (at least partially) could have another origin that is not accounted for in the current model, i.e. (i) surface roughness and (ii) surface wave radiation.
Total propagation losses in solid green lines from CPW lines measurements on the TR wafer. In solid red line, the total propagation losses from which the dielectric loss has been subtracted. The dotted lines correspond to the reconstructed RLGC lumped-element equivalent circuit in each case.

One-port reflect structure
An additional structure is measured in the low-frequency range. It is a one-port reflective structure with the layout displayed in Fig. 12. The cross-section is similar to a CPW line and we can subsequently map the measured admittance Y into a conductive and a capacitive component similarly to the G and C distributed elements of a transmission line. By doing so, and applying (10), one can compare the substrate-related losses from this reflective structure (solid blue line) with the ones coming from the CPW line (solid brown line), cf. Figure 13. The losses are also shown to increase with frequency, meaning that surface roughness is not the cause of the additional observed losses, as there is no propagation in this structure.
Top view (left in grey) of the one-port reflective structure and its cross-section (right).

Effective resistivity computed with (10) from the one-port reflective structure (solid blue line) and CPW measurements (solid brown line) of the TR wafer, along with ADS Momentum simulations of the reflect (dotted lines) for different substrate definitions: only dielectric loss (red), only conductive loss (blue), both (green).

Furthermore, ADS Momentum simulations are performed with this one-port structure in a similar fashion to section “Cutoff frequency”. Different substrate definitions are compared (dotted lines) in Fig. 13. The one that includes both conductive and dielectric losses in the substrate fits more accurately to the measurements. Moreover, additional simulations where the boundary condition is changed from a semi-infinite silicon substrate to a floating finite metallic plane (emulating the chuck in on-wafer RF measurement conditions) are carried out. The first boundary condition is free of the parallel-plate mode, which is the first higher order mode stimulated in CPW lines with a metallic back plane, whereas the second boundary condition includes such modes. The difference in both cases is so small that it is not shown here.
Finally, the ISS was also measured with the same calibration from 0.01 to 67 GHz. The same R-based method is applied to the CPW lines measurements. Figure 14 shows the effective loss tangent computed with (24) for the studied TR (brown) silicon substrate and the ISS (blue) using the same methodology presented in this paper. It is observed that the dielectric loss cannot be extracted from the measurement of the ISS, because it is within the noise floor of the setup, contrarily to the TR wafer.
Effective loss tangent versus frequency, computed with (24) using the R-based method from measurements of CPW lines on two different substrates: the ISS (blue) and the TR silicon substrate (brown).

The application of the whole extraction method to CPW lines of the ISS calkit confirms the existence of those non-negligible additional losses highlighted above. The frequency-dependent substrate loss observed for the one-port reflect structure discards the possibility for surface roughness to be at the origin of the observed additional losses highlighted above. The increasing difference between the red and green curves of Fig. 11 starting below 50 GHz suggests that surface wave radiation is not causing these additional losses either. We can therefore confidently identify them as being dielectric losses, although they are significantly larger than what is expected from the bulk materials constituting the samples. The origin might come from the manufacturing process of the wafers that was performed in our academic facilities. However, identifying and correcting the source of the high dielectric losses is an investigation that is still ongoing.
Conclusion
A wide frequency band analysis of the ρ eff is presented. It is demonstrated that an accurate extraction of the imaginary part of the characteristic impedance is critical to the estimation of ρ eff, especially for low-loss substrates for mm-wave applications. To that end, a new method correcting ${\rm \Im }\lpar {Z_c} \rpar$ is introduced. It computes the metallic losses of a CPW line and uses it to correct the extracted substrate G term. It gives a correct extraction of the substrate parameters over a wide frequency range. However, it is not well suited as a general method, because it relies on too strong assumptions, i.e. on the exact knowledge of the series metallic losses R of the line. For highly resistive substrates, the dielectric loss may become non-negligible above a few GHz yielding the original definition of ρ eff (10) obsolete. A new formulation is proposed in (26) and (27). It separates conductive and dielectric losses in two distinct FoMs. Both are important to characterize the total losses of a substrate over a wide frequency range. For chip design on this TR substrate at mm-wave frequencies, it is therefore more accurate to model the substrate losses by only dielectric losses than only conductive losses. On the other hand, RF designs in the sub-6 GHz range may prefer a conductive substrate model, especially for lower performance substrates. The validity of the ${\rm \Im }\lpar {Z_c} \rpar \;$
 correction is confirmed up to 220 GHz. The model including dielectric and conductive losses from (22) is also validated up to 220 GHz on various substrates. The origin of the loss contribution that is not metallic, nor conductive, is discussed. With measurements of an additional one-port reflective structure and CPW lines on an ISS calkit, this loss contribution is confidently identified as dielectric losses, justifying the large value ( ≈ 10−2) of loss tangent that is extracted. The results obtained show that the method proposed in this paper can be applied to different flavors of substrates in order to extract accurately two FoMs, ρ eff and $\tan \delta _{d_{eff}}$
 , representing their total RF losses at microwave and mm-wave frequencies.
Acknowledgement
The authors thank Sylvie Lépilliet from the Institute of Electronics, Microelectronics and Nanotechnology, Lille, France, for the CPW lines measurements from 140 to 220 GHz. Lucas Nyssens is a research fellow of the Fonds de la Recherche Scientifique – FNRS.
Appendix
Appendix A: Sensitivity analysis
From the expressions (16) and (17), we would like to evaluate the sensitivity of R and G to a misestimation of the characteristic impedance. Considering a small perturbation, the variation in G is computed as

Since we are only interested in the impact of the Z c extraction technique and that an accurate estimation of γ is used, the term δα was neglected. With some manipulations, (A.1) can be expressed as

By taking the absolute value, (A.2) is bounded by

with

A similar reasoning for R yields

with

The B R and B G terms define the maximum boundary values of relative variations for R and G, respectively. To carry out the sensitivity analysis and verify the correctness of these expressions, each term |δx/x|, where x is G, R, C, ${\rm \Im }\lpar {Z_c} \rpar$ , or ${\rm \Re }\lpar {Z_c} \rpar$
 , must be evaluated. The denominator, x, is extracted from the TR measurements based on the Z c extraction method from [Reference Nyssens, Rack and Raskin12]. To avoid the strict evaluation of the uncertainty δx based on measurement repeatability and quality of the measured structures, which is not straightforward, the numerator, δx, is computed here as the difference between the value of the parameter extracted using [Reference Nyssens, Rack and Raskin12] and of that using [Reference Dehan11]. Although this way does not provide a strict uncertainty analysis, it gives a good estimation of the error made using different Z c extraction techniques.
Table 4 reports the value of each term present in (A.3) and (A.5). The computed values of the boundaries B G and B R are quite close to the observed variations in |δG/G| and |δR/R|, which validates these expressions. From this table, the dominating uncertainty comes from ${\rm \Im }\lpar {Z_c} \rpar$ , because of its value very close to zero.
Sensitivity analysis of R and G to a variation in C and Z c, based on (31) and (33)

The observation that ${\rm \;}{\rm \Im }\lpar {Z_c} \rpar$ tends to zero at high frequency for low-loss substrates can be understood if simplified analytical expressions are used for R, L, G, and C. At sufficiently high frequency, assuming a constant material permittivity, C is constant, L tends to the constant value of external inductor of an ideal conductor [Reference Heinrich8], G is given by (22), and R is approximately proportional to $\sqrt f$
 due to skin effect:

In the low-loss assumption, ${\rm \Re }\lpar {Z_c} \rpar$ is approximately constant from (13) and

Taking the limit for ω → ∞:

Using the lumped-element equivalent circuit (cf. Fig. 1(b)) extracted from the CPW dimensions and measurements as explained in section “Validation up to 220 GHz”, the right-hand side of (A.9) is evaluated at 0.33 Ω.
 Lucas Nyssens was born in Ottignies, Belgium, in 1993. He received the B.S and M.S. degrees in electrical engineering from Université catholique de Louvain, Louvain-la-Neuve, Belgium, in 2015 and 2018, respectively. He also received the M.S. degree in electronic engineering from Politecnico di Torino, Turin, Italy, in 2018. He is currently pursuing a Ph.D. degree in electrical engineering at Université catholique de Louvain. His research focuses on the characterization of passive structures and MOSFETs on SOI technology at millimeter-wave frequencies.
 Martin Rack was born in Oxford, England in 1991. He received the B.S. and M.S. degrees in electrical engineering from Université catholique de Louvain, Louvain-la-Neuve, Belgium, in 2012 and 2014, respectively. He is currently pursuing a Ph.D. degree in electrical engineering at Université catholique de Louvain. His research interests include small- and large-signal modeling of semiconductor substrates, and their characterization and optimization toward successful monolithic integration of RF devices using silicon-based technology.
 Jean-Pierre Raskin (M′97 – SM′06 – F′14) received the M.S. and Ph.D. degrees in applied sciences from Université catholique de Louvain (UCLouvain), Louvain-la-Neuve, Belgium, in 1994 and 1997, respectively. He has been a Full Professor at the Electrical Engineering Department of UCLouvain since 2000. His research interests are the modeling, wideband characterization and fabrication of advanced SOI MOSFETs as well as micro and nanofabrication of MEMS/NEMS sensors and actuators, including the extraction of intrinsic material properties at nanometer scale. He has been IEEE Fellow since 2014. He was the recipient of the Médaille BLONDEL 2015, the SOI Consortium Award 2016, the European SEMI Award 2017, and the Médaille AMPERE 2019 in recognition of his vision and pioneering work for RF SOI.