Calves are born agammaglobulinaemic, and are dependent on the timely consumption of maternal colostrum in sufficient volume and quality to confer immunity in the first few weeks of life through passive transfer (Godden et al., Reference Godden, Lombard and Woolums2019). Many studies have examined risk factors for failure of passive transfer (FPT) and concluded that the most influential of these are colostrum management risk factors (Godden et al., Reference Godden, Lombard and Woolums2019). Calves need to receive between 10–15% of their bodyweight of high quality (high IgG and low bacteria) colostrum in the first six hours of life (Patel et al., Reference Patel, Gibbons and Wathes2014). Neonatal calves with FPT (serum IgG concentration <10 g/l) have higher incidences of calf morbidity and mortality than their healthy counterparts, as well as more long-term detrimental effects on productivity (DeNise et al., Reference DeNise, Robison, Stott and Armstrong1989; Tyler et al., Reference Tyler, Parish, Besser, Van Metre, Barrington and Middleton1999; Faber et al., Reference Faber, Faber, McCauley and Ax2005).
Colostrum quality is defined in terms of immunoglobulin G (IgG) concentration (target >50 g/l), and bacterial contamination (target total bacterial count (TBC) <100 000 CFU/ml, and total coliform count (TCC) <10 000 CFU/ml) (McGuirk and Collins, Reference McGuirk and Collins2004; Godden et al., Reference Godden, Lombard and Woolums2019). Meeting these targets should ensure that calves receive the critical mass of 150–200 g of IgG required for adequate passive transfer (Chigerwe et al., Reference Chigerwe, Tyler, Schultz, Middleton, Steevens and Spain2008), although more recent research suggests that approximately 300 g of IgG is required (Godden et al., Reference Godden, Lombard and Woolums2019).
Brix refractometry can be used to measure colostrum IgG concentration and is cheaper and more expedient than laboratory-based testing. Meta analysis carried out by Buczinski and Vandeweerd, (Reference Buczinski and Vandeweerd2016) determined that at a cut point of 22%, the sensitivity of the test was 80.2% (95% CI = 71.1–87.0%) and the specificity was 82.6% (95% CI = 71.4–90.0%) when compared with direct measurement of colostrum IgG.
Increased bacterial contamination of colostrum, specifically coliform bacteria, reduces absorption efficiency of IgG (Johnson et al., Reference Johnson, Chancellor, Burn and Wathes2017). There are several mechanisms by which this is postulated to occur. Firstly, physical binding of the IgG by microbes within the gastrointestinal lumen blocks their uptake across the enterocytes. Secondly, pathogenic bacteria may attach and damage intestinal cells meaning their permeability is reduced. Thirdly, when these pathogenic bacteria damage intestinal cells there is accelerated gut closure. Fourthly, bacteria physically block absorption channels of the immunoglobulin molecules (Staley and Bush, Reference Staley and Bush1985). Bacterial contamination could also include specific disease-causing calf pathogens such as E. coli, Salmonella species, mycoplasma species or Mycobacterium avium paratuberculosis (Stewart et al., Reference Stewart, Godden, Bey, Rapnicki, Fetrow, Farnsworth, Scanlon, Arnold, Clow, Mueller and Ferrouillet2005). Risk factors for bacterial contamination of colostrum include hygiene at harvesting, storing, preserving and pasteurising (Stewart et al., Reference Stewart, Godden, Bey, Rapnicki, Fetrow, Farnsworth, Scanlon, Arnold, Clow, Mueller and Ferrouillet2005; Donahue et al., Reference Donahue, Godden, Bey, Wells, Oakes, Sreevatsan, Stabel and Fetrow2012; Johnson et al., Reference Johnson, Chancellor, Burn and Wathes2017).
Data from UK dairy farms pertaining to colostrum quality and FPT prevalence is sparse (MacFarlane et al., Reference MacFarlane, Grove-White, Royal and Smith2015; Johnson et al., Reference Johnson, Chancellor, Burn and Wathes2017). The objectives of this study were to (1) establish the FPT prevalence at calf level; (2) measure IgG concentration and bacterial contamination of colostrum samples at point of feeding to neonatal dairy calves; and (3) to identify risk factors associated with FPT and poor colostrum quality on Scottish dairy farms, with a view to making positive recommendations to producers to improve calf management. Specific hypotheses included: (1) the prevalence of FPT in the Scottish context is similar to the prevalence of FPT reported in other parts of the UK and internationally; (2) colostrum contamination with bacterial species exceeds internationally accepted thresholds for coliforms and total bacteria counts; (3) specific farm management risk factors are associated with FPT and colostrum contamination.
Materials and methods
Three hundred and ninety two, 1–7 d-old female dairy calves from 38 farms were sampled from the Stirlingshire, Lanarkshire and Dumfries and Galloway regions of Scotland between February and June 2019 (University of Glasgow ethics number 13a18). To adequately power the study, a sample size of 381 calves was required to estimate a single proportion in a large population of calves, with a desired precision of 0.01 and confidence level of 0.95, assuming a prevalence of FPT of approximately 25%. Every effort was made to also collect colostrum samples from every neonatal calf's first feed of colostrum but this was not possible in all situations. Farms were conveniently selected from the client lists of two commercial veterinary practices. At enrollment, a face-to-face farmer questionnaire on neonatal calf and colostrum management practices was completed by one of four trained veterinarians.
Calves were selected based on those available in the required age range at the time of the routine visit. A 20-gauge, 1-inch needle was used to collect a jugular blood sample in two sterile vacutainers without anticoagulant and centrifuged to separate serum, before freezing at −20°C.
Trained farm staff also collected 252 colostrum samples at point of feeding to neonatal calves. Colostrum samples were also stored at −20°C post collection. All samples were transported on ice to the University of Glasgow laboratory and stored again at −20°C until further testing. Where possible calf serum samples were ‘paired’ with first feeding colostrum samples, such that the calf sampled was fed the colostrum that was also sampled.
Immunodiffusion plates (Bovine IgG RID Kit, Triple J Farms, Kent laboratories) were used to determine serum IgG concentration following manufacturer guidelines.
Colostrum samples were thawed at room temperature and vortexed (Vortex Genie 2, Scientific Industries Inc.) prior to testing to ensure proper mixing. Brix refractometry was used to estimate colostrum IgG concentration using the methodology described by Elsohaby et al. (Reference Elsohaby, McClure, Cameron, Heider and Keefe2017). Briefly, the Brix refractometer (Cole Parmer Refractometer w ATC, 0–32%) was calibrated using distilled water and recalibrated after every 20 samples. One to two drops of the sample were placed onto the prism and the refractometer was held up to a light source to assess Brix percentage (%). The prism was cleaned prior to use (and after every sample) using 70% ethanol to remove any residue.
Colostrum TBC was measured on sheep blood agar using the methodology described by Ginn et al. (Reference Ginn, Packard and Fox1984). In summary, two dilutions were prepared for each colostrum sample (1 : 10 and 1 : 100) and 0.1 ml of each dilution was pipetted (Gilson 74395 Pipetman Single Channel Pipette) onto 5% sheep blood agar plate (E & O Laboratories Limited). Colostrum TCC was measured on Petrifilms using methodology described by Maunsell et al. (Reference Maunsell, Morin, Constable, Hurley, McCoy, Kakoma and Isaacson1998). One millilitre of each undiluted sample was added to a Petrifilm (3 M Health Care). Both agar plates and Petrifilms were incubated at room temperature for 24 h (Swallow Incubator, LTE Scientific Ltd), then bacterial colonies were counted using a colony counter (Stuart Scientific, Cole Palmer). If colonies were too numerous to count, the procedure was repeated using 1 : 1000 and 1 : 10 000 dilutions for TBC and using 1 : 10 and 1 : 100 for TCC until counts could be obtained.
Statistical methods
All data were stored on a relational database (Microsoft Access, 2016) and spreadsheets were exported to Excel (Microsoft 2016). Statistical analysis was carried out using Stata (Stata/IC 15.0, StataCorp LP). Descriptive statistics were calculated for serum IgG concentration and colostrum quality indicators.
Colostrum quality indicators were dichotomized according to three outcome variables of interest: Brix <22% or ≥22%; TBC <100 000 cfu/ml or ≥100 000 cfu/ml; and TCC <10 000 cfu/ml or ≥10 000 cfu/ml. Serum IgG concentrations were dichotomised into FPT <10 g/l or no FPT ≥10 g/l. Intraclass correlation coefficients were calculated for each outcome variable to determine clustering at the farm level. Pearson's correlation coefficients for continuous risk factor variables and Spearman's rank correlation coefficients for categorical variables were calculated.
Logistic regression models were constructed, using the dichotomised variables as the outcomes of interest; initially univariable models for each of the risk factors (from the farmer questionnaire) and each of the colostrum outcome variables and the serum IgG outcome. Risk factors with univariable significance of P ≤ 0.2 were included in further modelling. All biologically plausible interaction terms were explored (including interactions between the following: when colostrum was first collected from the dam and when it was first fed to the calf; whether colostrum was stored and the timing of first feeding; the volume of colostrum fed and the interval between feeds; the volume of colostrum and method of feeding) and confounding variables were included if model coefficients varied by >20%.
Multilevel logistic regression analysis (with farm as a random effect) was used to determine risk factors associated with colostrum quality indicators (TBC, TCC and Brix) and serum IgG concentration respectively. Risk factors were excluded from multivariable modelling using a backwards, stepwise elimination process and the likelihood ratio test was used to compare the models (P < 0.05).
For the subset of ‘paired’ colostrum and serum samples (where the sampled colostrum was fed to a specific calf which was also sampled), linear regression was used to determine colostrum quality risk factors for poor serum IgG concentration (and therefore FPT). Model construction was as described for the logistic regression models. Postestimation and model diagnostics were performed using the predict function in Stata for all multilevel logistic regression modelling. Residuals were found to lie within 2 standard deviations of the mean in all cases.
Results
Overall, 252 colostrum samples were available for analysis from 34/38 (89.47% of farms, n = 331 calves) enrolled farms, as 4 farms collected serum samples only and no colostrum samples. Of the calf serum samples, 370 were available for testing and statistical analysis. Twenty-two samples had to be excluded from the study due to incomplete information about the calf, or poor sample handling and transportation resulting in the sample being unsuitable for testing. Of the 370 serum samples obtained, 154 serum samples had a ‘paired’ colostrum sample of the particular colostrum that the calf received.
Farmer responses to the questionnaire are detailed in the Supplementary File (Table ST1).
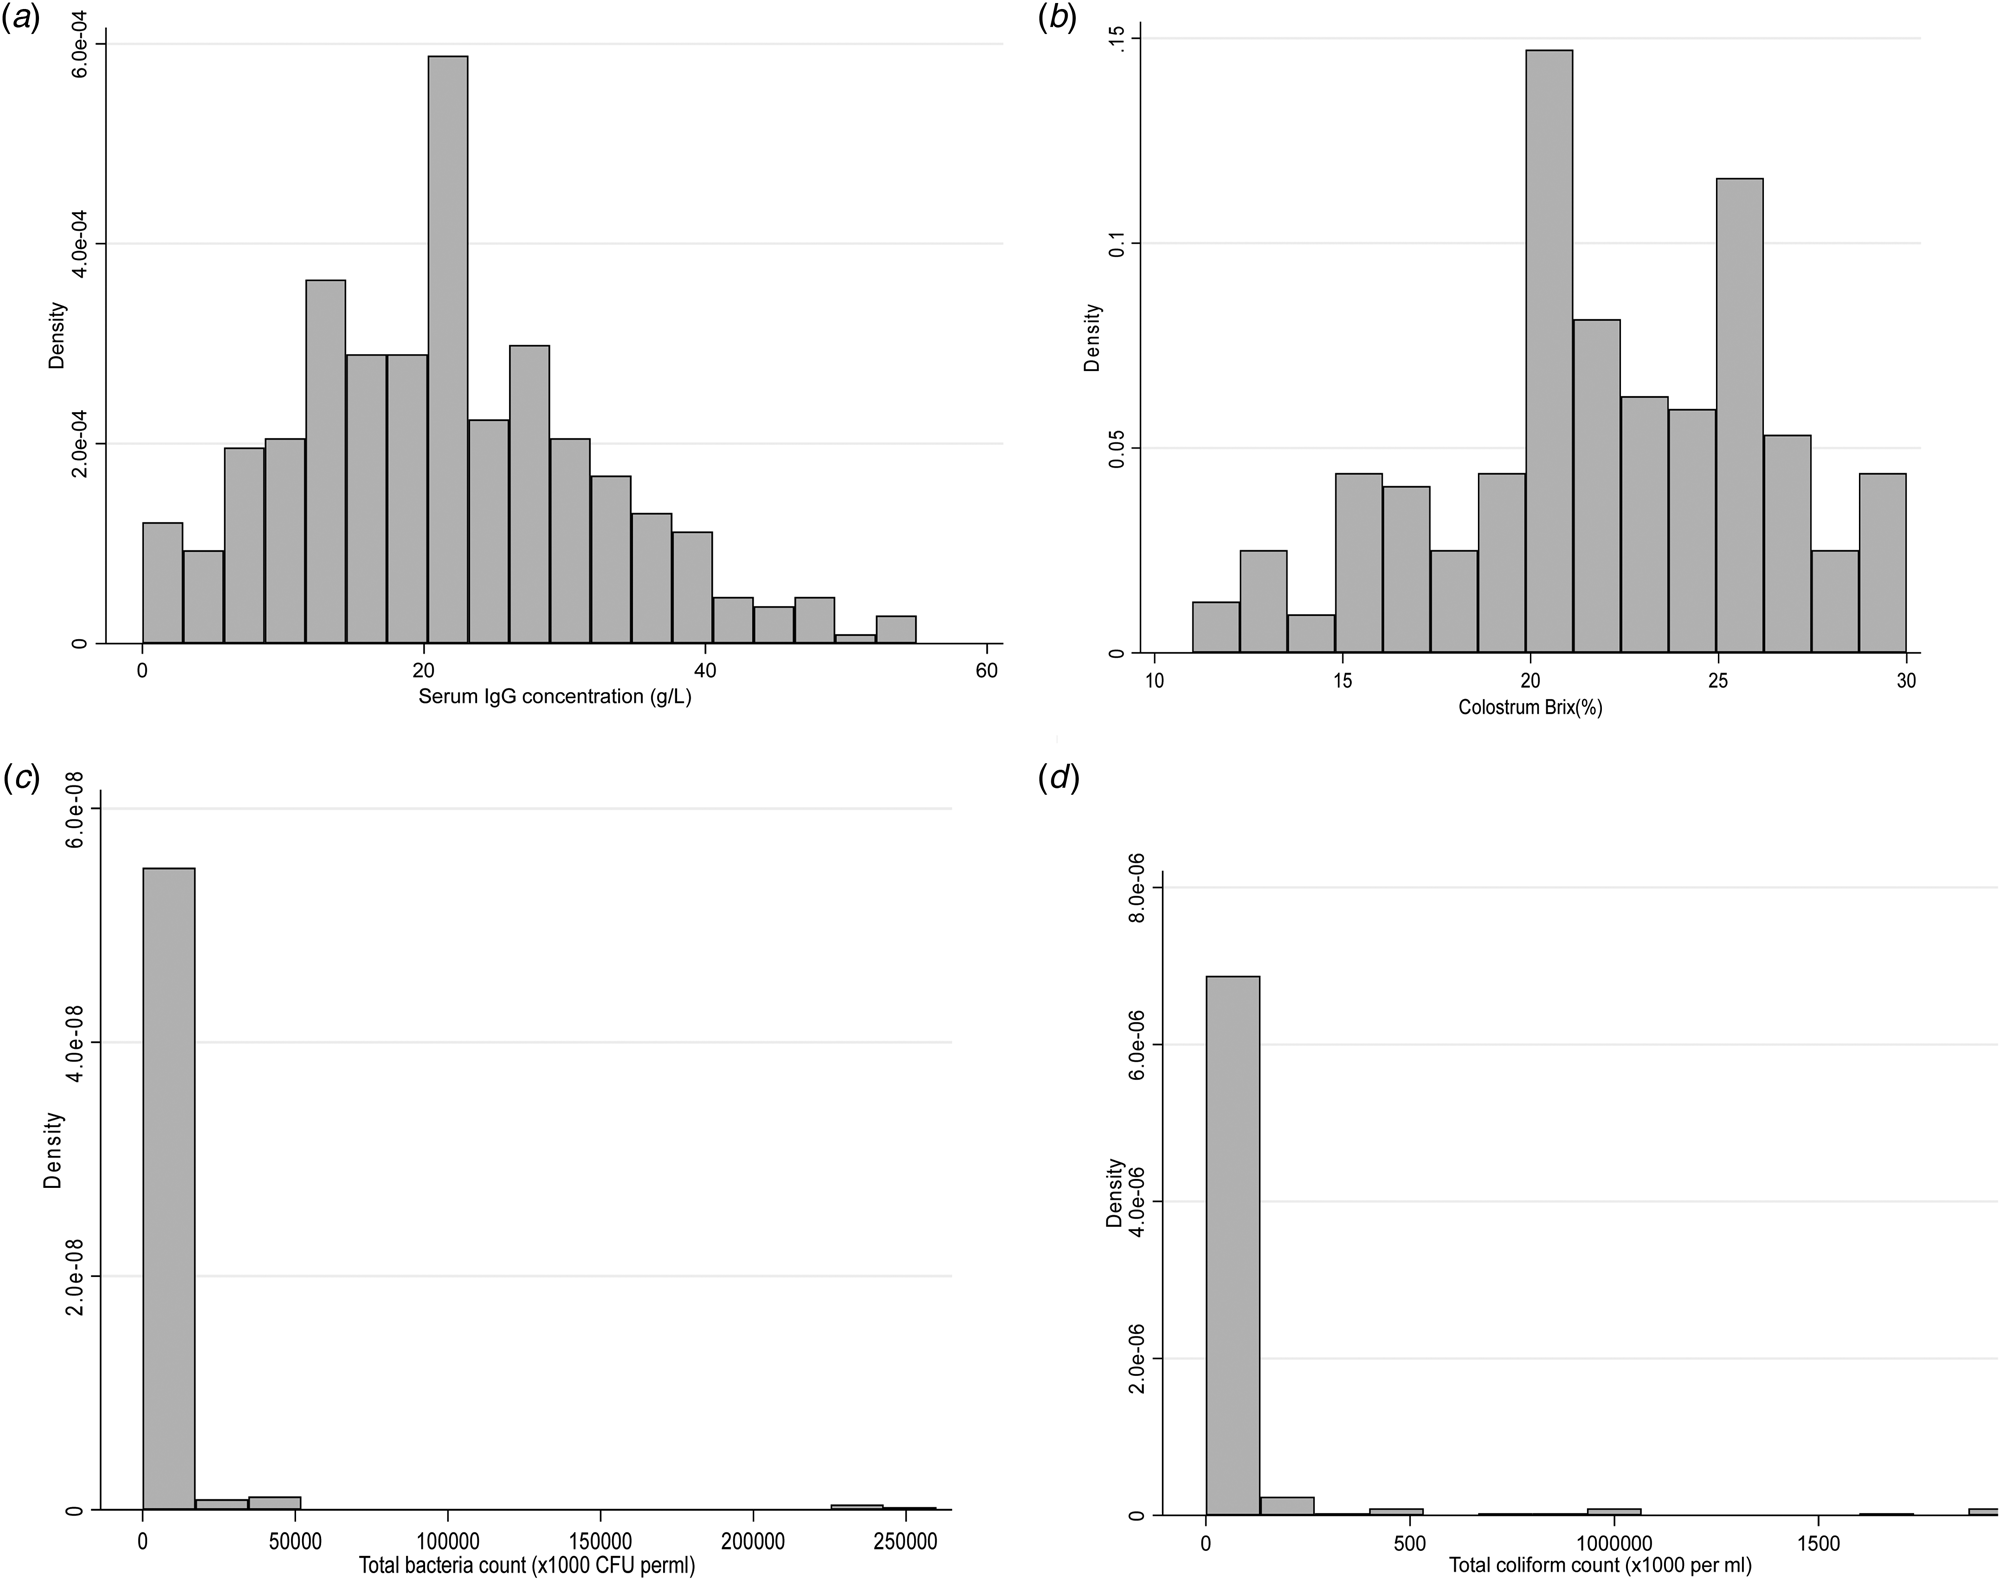
Descriptive statistics for colostrum quality indicators and serum IgG concentration are shown in Table 1, including the proportion of samples which failed to meet industry thresholds for quality. Frequency distributions of the outcomes of interest are shown in Figure 1. One hundred and eleven of 252 colostrum samples (44.05%, 95%CI = 37.88–50.22) failed to meet Brix thresholds for colostrum quality. Of these 28 and 38 samples also exceeded TBC and TCC thresholds, respectively. There was positive correlation (Spearman's rho = 0.62, bootstrap 95%CI = 0.52–0.72) between dichotomised TBC and TCC measurements (to account for the skewed nature of the data), but no observed correlation between colostrum Brix measurement and bacterial measurements (Spearman's rho = −0.01, bootstrap 95%CI = −0.2 to 0.03). Calves fed colostrum below the TBC threshold of 100 000 CFU/ml had serum IgG concentrations 3.76 g/l (95%CI = −7.19 to 0.12, P < 0.05) higher than those fed colostrum exceeding TBC thresholds.
Frequency distributions of (a) IgG concentrations (g/l) of serum samples from 1 to 7-d-old calves (n = 370) (b) Brix (%) of colostrum (n = 252) (c) Total bacteria count of colostrum (CFU/ml) (n = 252) (d) Total coliform count of colostrum (CFU/ml) (n = 252) collected from 38 Scottish dairy farms sampled between February and June 2019.

Descriptive statistics for serum (n = 370) IgG concentration (determined by RID) from 1 to 7-d-old calves and for colostrum samples (n = 252) collected from 38 Scottish dairy farms between February and June 2019

a Serum IgG <10 g/l indicates inadequate passive transfer.
b Brix thresholds of <22% indicates poor quality colostrum.
c Total bacteria counts ≥100 000 CFU/ml indicates poor quality colostrum
d Total coliform counts ≥10 000 CFU/ml indicates poor quality colostrum
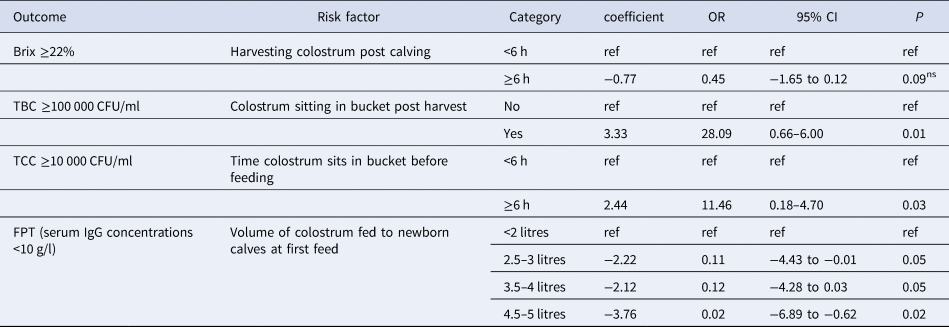
Final multilevel logistic models for risk factors associated with colostrum Brix, TBC and TCC and for risk factors associated with FPT (serum IgG) as the outcomes of interest are shown in Table 2.
Final multilevel logistic model of farm management risk factor variables (collected by questionnaire) associated with colostrum quality in first milking colostrum fed to dairy calves (n = 252) and FPT (n = 331) from 34 Scottish dairy farms sampled February–June 2019.

Footnote ns = not significant.
Discussion
This is the first Scottish study to describe the prevalence of FPT and identify possible risk factors for FPT and poor colostrum quality on commercial dairy farms. The prevalence of FPT in this study (14.05%, 95%CI = 10.69–18.31) was lower than reported in international and other UK literature, disproving the first study hypothesis. Recent North American research reported a prevalence of 15.6% FPT from 2498 serum samples from 104 farms (Urie et al., Reference Urie, Lombard, Shivley, Kopral, Adams, Earleywine, Olson and Garry2018), while New Zealand data reported a prevalence of FPT of 33% from 3819 serum samples from 107 dairy farms (Cuttance et al., Reference Cuttance, Mason, Laven, McDermott and Phyn2017). Johnson et al. (Reference Johnson, Chancellor, Burn and Wathes2017) reported an FPT prevalence of 20.7% on 11 English farms (measured by RID using a cutpoint serum IgG concentration of <10 g/l). Additionally, FPT prevalence was reported as 26% on 7 English farms (MacFarlane et al., Reference MacFarlane, Grove-White, Royal and Smith2015), however, in that study total protein (TP) refractometry was used as a proxy for serum IgG concentration and this indirect method is known to produce false positive results, consequently overestimating the prevalence of FPT (Tyler et al., Reference Tyler, Hancock, Parish, Rea, Besser, Sanders and Wilson1996; Deelen et al., Reference Deelen, Ollivett, Haines and Leslie2014). The current study reported across a wider range of farms in Scotland and therefore may have a more realistic prevalence estimate. However, the study period did not cover a whole year of production and there may be variation in time in FPT prevalence with changes in management, feeding and seasonality (Godden et al., Reference Godden, Lombard and Woolums2019).
Literature from the USA observed highly variable individual cow colostrum IgG concentration ranging from <1 to 200 mg/ml, with a mean IgG concentration of 68.8 g/l (sd = 32.8 g/l) (Morrill et al., Reference Morrill, Conrad, Lago, Campbell, Quigley and Tyler2012). MacFarlane et al. (Reference MacFarlane, Grove-White, Royal and Smith2015) observed a range of 10.3–34.7% Brix for colostrum samples in their UK study. Similarly, the current work measured mean Brix % of 22% with a range between 11.0 and 30.0%, supporting that colostrum quality is highly variable, affected by a range of cow and farm-level management factors (Godden et al., Reference Godden, Lombard and Woolums2019).
MacFarlane et al. (Reference MacFarlane, Grove-White, Royal and Smith2015) found 37% of colostrum samples failed in meet industry standards for quality, which is in broad agreement with the 44.05%, 95%CI = 37.88–50.22 of samples (n = 111/252) which failed to meet Brix % and 30.56% (95%CI = 24.83–36.28) of samples (n = 77/252) which failed bacterial contamination thresholds in the current study (supporting the second study hypothesis). Hyde et al. (Reference Hyde, Green, Hudson and Down2020) also measured colostrum contamination from 59 UK dairy farms and found that 29.6% samples had TBC results above thresholds (in broad agreement with the proportion failing to meet thresholds in the current study), however only 7.6% had coliform counts above thresholds in comparison with 19.8% in the current work. In addition, in the current study, 15.48% (95%CI = 10.98–19.97) of samples (n = 39/252) failed both quality measures (Brix and TBC). The proportion of colostrum samples exceeding TBC threshold ranged from 35.95 to 42% in North America and Australia, respectively (Fecteau et al., Reference Fecteau, Baillargeon, Higgins, Paré and Fortin2002; Morrill et al., Reference Morrill, Conrad, Lago, Campbell, Quigley and Tyler2012; Phipps et al., Reference Phipps, Beggs, Murray, Mansell, Stevenson and Pyman2016). Interestingly, Morrill et al. (Reference Morrill, Conrad, Lago, Campbell, Quigley and Tyler2012) and Phipps et al. (Reference Phipps, Beggs, Murray, Mansell, Stevenson and Pyman2016) found only low percentages of colostrum samples (0–6%) exceeding TCC thresholds in USA and Australia respectively, in contrast to relatively high coliform contamination observed in the current work (19.84%, 95%CI = 14.88–24.80 of samples exceeding coliform thresholds of 10 000CFU/ml). This could be explained by differences in sampling methodology and sampling site: direct from mammary gland, test bucket or feeder. Stewart et al. (Reference Stewart, Godden, Bey, Rapnicki, Fetrow, Farnsworth, Scanlon, Arnold, Clow, Mueller and Ferrouillet2005) observed lower bacterial counts when colostrum was sampled direct from the mammary gland compared with sampling from a collection bucket, however, Phipps et al. (Reference Phipps, Beggs, Murray, Mansell, Stevenson and Pyman2016) sampled colostrum at point of feeding from feed troughs or buckets so results are comparable to the current study. It has been suggested that freezing destroys some types of coliforms, such as E. coli, but this is contentious (Fecteau et al., Reference Fecteau, Baillargeon, Higgins, Paré and Fortin2002). All samples were frozen prior to analysis, so contamination rates may have been higher than measured since freezing of samples may have destroyed some bacteria (Alrabadi, Reference Alrabadi2015). All farmers surveyed asserted that they cleaned colostrum harvesting, storage and feeding equipment regularly, however clearly attention to detail and thorough cleaning is lacking, and more work is needed to ascertain whether Scottish farmers are using hot water and detergent and scrubbing fatty colostrum residues as these data would suggest not.
High colostrum TBC was significantly associated with lower serum IgG concentrations, in concordance with other work examining the relationship between artificially lowering colostrum bacterial contamination (particularly coliforms counts) through heat treatment and calf serum IgG concentrations (Godden et al., Reference Godden, Smolenski, Donahue, Oakes, Bey, Wells, Sreevatsan, Stabel and Fetrow2012). In the current study, TCC was correlated with TBC (r = 0.75) and the significant serum IgG association was with TBC, not TCC.
Feeding calves 4.5–5 litres of first milking colostrum at their first feed was protective against FPT (OR = 0.02, P < 0.05), indicating that it may be possible to overcome the effects of low IgG colostrum by feeding a higher volume of colostrum (beyond the 10–15% of bodyweight recommendation; Godden et al., Reference Godden, Lombard and Woolums2019).
An inverse relationship between colostrum IgG and time from calving to first colostrum harvest has been substantiated in previous literature (Morin et al., Reference Morin, Nelson, Reid, Nagy, Dahl and Constable2010; Reschke et al., Reference Reschke, Schelling, Michel, Remy-Wohlfender and Meylan2017). A reduction in IgG concentration post calving was quantified by Morin et al. (Reference Morin, Nelson, Reid, Nagy, Dahl and Constable2010) as 3.7% Brix each hour post calving. Additionally, Moore et al. (Reference Moore, Tyler, Chigerwe, Dawes and Middleton2005) showed that delaying harvest of colostrum for 6, 10, or 14 h after calving resulted in a 17%, 27%, and 33% decrease in colostral IgG concentration, respectively.
Leaving colostrum sitting in a bucket (particularly for more than 6 h) after harvest was associated with an increased risk of exceeding TBC and TCC thresholds in agreement with other North American work (Fecteau et al., Reference Fecteau, Baillargeon, Higgins, Paré and Fortin2002; Stewart et al., Reference Stewart, Godden, Bey, Rapnicki, Fetrow, Farnsworth, Scanlon, Arnold, Clow, Mueller and Ferrouillet2005). The more time that colostrum is left sitting in a bucket post-harvest, especially at ambient temperatures, the greater the opportunity for contamination with faecal and environmental bacteria and bacterial multiplication (Stewart et al., Reference Stewart, Godden, Bey, Rapnicki, Fetrow, Farnsworth, Scanlon, Arnold, Clow, Mueller and Ferrouillet2005). In order to reduce the opportunity for bacterial contamination, Morrill et al. (Reference Morrill, Conrad, Lago, Campbell, Quigley and Tyler2012) concluded that storage method had a significant impact on bacterial contamination and recommended that colostrum should be fed fresh from the dam or frozen immediately. Encouraging producers to feed colostrum immediately or to store (ideally freeze at −20 °C) as soon as possible after harvesting should reduce the risk of high TBC and TCC, thereby improving IgG absorption efficiency and reducing FPT prevalence. This should be readily achievable for most producers with only a small capital investment in a suitable freezer and freezer thermometer. Questionnaire data showed that very few Scottish farmers (n = 9/34, 26.47%) had a thermometer or monitored the temperature of their freezer (n = 5/9, 55.56%). Moreover, none of the appliances used to store colostrum at low temperatures on study farms met required refrigeration or freezing temperatures (of 4°C and −20°C) (as recommended by Stewart et al. Reference Stewart, Godden, Bey, Rapnicki, Fetrow, Farnsworth, Scanlon, Arnold, Clow, Mueller and Ferrouillet2005).
In conclusion, this study suggests that a high proportion of Scottish neonatal dairy calves are at risk of FPT through feeding of low IgG concentration and highly contaminated colostrum. Advising producers to minimise the time between parturition and colostrum harvesting (to maximise IgG concentration) and minimise time sitting in a bucket prior to feeding (to minimise bacterial contamination) could improve colostrum quality and reduce FPT prevalence on Scottish dairy farms. Farmers should be encouraged to feed 10–15% of the newborn calf's bodyweight in first feed colostrum to mitigate the risk of FPT. These data supports the third study hypothesis that specific farm management risk factors are associated with increased risk of FPT and colostrum contamination.
Supplementary material
The supplementary material for this article can be found at https://doi.org/10.1017/S0022029921000686.
Acknowledgements
This work was supported by the Hannah Research Foundation and the University of Glasgow James Herriot Fund (grant number 146135-01). The British Cattle Veterinary Association is also acknowledged for their support of the project. SRUC Veterinary Services receives funding from the Scottish Government's Veterinary Advisory Programme. Clyde Vet Group and Stewartry Vets are gratefully acknowledged for assistance with sample collection for this work. Thanks are extended to the technicians in the Veterinary Diagnostic Services internal laboratories: Mike McDonald, Manuel Fuentes and Stephen Haran who conducted some of the total protein testing.