Introduction
Agriculture faces a collection of potentially irreconcilable challenges in the 21st century: feeding a growing world population that demands a more affluent diet, providing better nutrition for the poor and more balanced nutrition for the rich, adapting to a changing climate, and reducing its impact on the environment. Food consumption and agricultural production are interdependent, and new tools are needed to understand how one influences the other. Peters et al.Reference Peters, Fick and Wilkins1 contended that complete-diet approaches should be used to assess the adequacy of food supplies and agricultural production for meeting nutritional goals. In addition, such approaches are needed to understand how human food preferences affect agriculture's environmental footprint. We present and test a framework for modeling how diet influences the requirements for agriculture's most fundamental resource, land, and how those requirements influence the number of people that agriculture can support.
Demand for affluent diets and its impact on agriculture and the environment
Global consumption of meat and other animal products increased throughout the latter half of the 20th century and will probably continue to increase into the foreseeable future. According to Delgado et al.Reference Delgado, Rosegrant, Steinfeld, Ehui and Courbois2, total global meat consumption is projected to grow 65% between 1993 and 2020 (from 184 to 303 million metric tons). This projected surge in global demand has been called the next food revolutionReference Delgado, Rosegrant, Steinfeld, Ehui and Courbois3, and carries a host of consequences both positive and negative. Increases in consumption of livestock products offer the possibility of improved nutrition in developing countries where protein and micronutrient malnutrition are still widespread, and the requisite increases in livestock production offer the possibility of increased incomes for the rural poorReference Delgado4. Unfortunately, this surge in consumption may place further strain on the resource base, cause environmental degradation, and concentrate livestock production.
Recent projections of world food supply suggest that agriculture will be able to meet the challenge of increasing consumption of animal products, at least through the first quarter of this centuryReference Rosegrant and Ringler5–Reference Johnson7. Demand, rather than supply factors, is expected to limit food consumption. However, this is not cause for complacency. It is generally believed that most grazing lands are already harvested at or above capacity and that lands available for conversion to agriculture are of marginal quality. Indeed, Delgado et al.Reference Delgado, Rosegrant, Steinfeld, Ehui and Courbois3 conclude that increased production of meat will require intensification of production. This raises several concerns, three of which are more immediate and others that may manifest over time.
First, competition for water may force agriculture to cede water to domestic and industrial uses and will constrain the expansion of irrigated agriculture unless the water use efficiency of crop production increases substantiallyReference Rosegrant and Ringler5, Reference Pinstrup-Andersen, Pandya-Lorch and Rosegrant8. Secondly, use of nitrogen fertilizers will be essential for increasing yieldsReference Alexandratos6, Reference Dyson9, but nitrogen use efficiency has plummeted and nutrient loading of aquatic ecosystems already causes eutrophication and low-oxygen conditionsReference Tillman, Cassman, Matson, Naylor and Polasky10. Thirdly, Hall et al.Reference Hall, Ehui and Delgado11 fear that policy aimed at reducing the spread of zoonotic diseases may inadvertently marginalize small-scale producers and potentially increase rural poverty.
In addition to these straightforward concerns, agriculture faces multiple limits, the impacts of which are difficult to predict. CassmanReference Cassman12 argues that declines in soil quality, though difficult to measure, will increasingly constrain production in the 21st century. Heitschmidt et al.Reference Heitschmidt, Short and Grings13 and Pimentel and PimentelReference Pimentel and Pimentel14 suggest that current energy use of livestock agriculture in the US is unsustainable. They offer no timeline over which energy will become a limiting resource; however, Duncan and YoungquistReference Duncan and Youngquist15 forecast the peak of world oil production in 2007. If accurate, mechanized agriculture will face a serious challenge in this century. Climate change should not prevent agricultural production from keeping pace with food demand for the next 25 years, but Easterling and AppsReference Easterling and Apps16 suggest that beyond a certain threshold, agriculture will be unable to adapt without an increase in food prices. They stress that the value of this threshold can only be estimated with a low degree of confidence, but that the available evidence suggests global temperature increases beyond 2.5°C may reverse the long-term trend of falling food prices. Finally, Tillman et al.Reference Tillman, Cassman, Matson, Naylor and Polasky10 claim incentives are needed to protect the ecosystem services inevitably impacted by using land for agriculture. Taken together, these concerns suggest that the global transition to a diet rich in meat and other animal products may not be possible or desirable to maintain in the long run.
Reducing the environmental impact of diet
More than 35 years ago, ReidReference Reid17 listed change in dietary patterns among several measures to avert future shortfalls in food production. Though the evidence suggests such ‘belt-tightening’ will not be necessary for providing an adequate food supply over the next 20 years, the environmental problems caused by current practices already warrant action to mitigate further degradation. Thus, just as production practices and dietary patterns should be considered key to addressing world energy problems, dietary modification should be considered as part of the strategy for reducing the overall environmental consequences of livestock production and agriculture in general. In order for such a strategy to succeed, it is essential to understand the relative resource requirements of different types of diets.
Existing research paints an incomplete and conflicting picture of the resource requirements of diet. Oltjen and BeckettReference Oltjen and Beckett18 show that dairy systems can produce returns of greater than 100% on the amount of humanly edible energy used to feed livestock, provided that the majority of the feed comes from forages and by-products. Similarly, they show that both dairy and beef can produce net returns on the amount of humanly edible protein used in such systems. BradfordReference Bradford19 claims that milk produced from irrigated alfalfa can produce more humanly edible energy per acre than using the same land for wheat. In contrast, Reijnders and SoretReference Reijnders and Soret20 estimate that cheese requires five times the land area as a lupine-based cheese substitute and meat requires 6–17 times the area of a soy-based meat substitute. Since the methods used in each of these studies are different, it is possible that all estimates are accurate, yet they lead one to reach very different conclusions about the resource requirements of animal agriculture. To place such estimates in perspective, it is necessary to consider the impact of livestock products in the context of a complete diet and a complete food system.
Within this context, we examine how two components of the human diet, meat and added fats, influence land resource requirements of the human diet and, consequently, carrying capacity. Such analysis is generally done at national or regional scales since most nations ultimately rely upon domestic production for the majority of their food needs. However, this analysis was performed within the geographic confines of a single state, New York, for the following reasons. First, the model is complex, and it was easiest to test the model over a region where uniform assumptions could be made about livestock production practices and crop productivity. Secondly, the data used for input in the model is collected at the state level. Thirdly, it provides insight into the potential contribution of local agriculture to meeting local food needs in a populous region, relevant since environmental concerns about energy use and climate change suggest that food be grown in closer proximity to its point of consumption. It is understood that the area of analysis restricts generalizations of this study to regions with similar climates and land resources to New York. Nonetheless, the research provides a useful framework that could be applied to larger regions.
Methods
A spreadsheet model was used to calculate annual per capita land resource requirements for 42 different dietary patterns varying in terms of total fat and total servings of meat. All diets contained the same number of calories and included foods from each of the major food groups, similar to the approach outlined by Peters et al.Reference Peters, Fick and Wilkins1. However, not all diets met the recommended number of servings for each of the major food groups in the Food Guide Pyramid. The comparison diets were designed to represent the range of food consumption patterns—from low-fat, lacto-vegetarian to high-fat, meat-rich omnivorous. Estimated per capita land resource requirements were then used to calculate the number of people which could be fed from New York State (NYS)'s agricultural land, based on the quality and quantity of land available. These estimates of carrying capacity are used to examine the interaction between quality of the land resource base and the diet that supports the largest population.
Design of diets
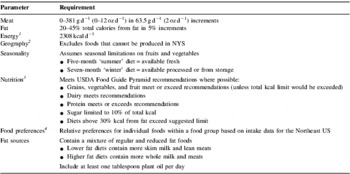
For this study, 42 different diets were constructed for comparison. The parameters underlying the comparison diets used in this analysis are summarized in Table 1 Reference Bowman, Lino, Gerrior and Basiotis21–23. The critical components that varied across the diets were the quantity of meat consumed per day and the percent of total energy coming from fat. Seven different quantities of cooked meat and eggs—ranging from 0 to 381 g d−1 (0–12 oz d−1 ) in 63.5 g d−1 (2 oz d−1) increments—and six different levels of fat—ranging from 20 to 45% of total calories in 5% increments—were represented in the 42 diets. All seven meat quantities were paired with each of the six fat levels, which generated 42 different diets.
Summary of diet treatment assumptions.

1 Average energy requirement determined based on population demographics of NYS and recommended Food Guide Pyramid servings by age and gender from Bowman et al.Reference Bowman, Lino, Gerrior and Basiotis21.
2 Includes the following crops (by food group): Grains: corn, oats, rye, and wheat; Vegetables: beets, bell peppers, cabbage, carrots, cauliflower, eggplant, escarole/endive, green peas, lettuce, onions, potatoes, snap beans, spinach, sweet corn, tomatoes, and winter squash; Fruit: apples, apple juice, blueberries, cherries, grapes, grape juice, peaches, pears, and strawberries; Pulses and nuts: black beans, kidney beans, sunflower seeds, and tofu; Meat and eggs: beef, chicken, chicken eggs, and pork; Oils: canola, soy, and sunflower; Sweeteners: beet sugar.
3 Recommendations of the USDA Food Guide Pyramid are outlined in Nutrition and Your Health: Dietary Guidelines for Americans 22.
4 Intake data for the Northeast US from the Food Commodity Intake Database23.
This choice of graduated levels of specific dietary components (meat and fat) allowed for analysis by either two-factor analysis of variance (ANOVA) or multiple linear regression. The range of each component was selected to achieve a thorough representation of the most prevalent consumption practices in the United States today. According to loss-adjusted federal food supply data24, Americans consumed an average of 163 g (5.8 oz) of meat and eggs per day (in cooked meat equivalents) in 2003 and ate 23% of total calories from ‘added fats’ (i.e. butter, oil, and other fats that dress other foods or are used in cooking). ‘Added fats’ account for 56% of the fat available in the food supply25, which means that 41% of total calories come from fat. Since the national dietary recommendations suggest no more than 30% of calories come from fat, the range represented by the comparison diets included lower amounts.
All diets included representative foods from each food group (grains, vegetables, fruit, dairy, protein-rich foods, oils, and sweeteners) and were equivalent in total caloric value. The composition of each diet was determined through a six-step process. First, 41 food commodities were selected to serve as the constituents of the diet. All commodities produced in NYS were included provided that annual yield data were available from the state agricultural statistics service. Secondly, each food was entered into a spreadsheet along with data on basic nutritional properties (carbohydrate, fat, protein and total energy content) from the Nutrient Database for Standard Reference26. Thirdly, the relative preference for individual foods within a food group was derived from the Food Commodity Intake Database23. Fourthly, core diets were developed that contained the Food Guide Pyramid (FGP)-recommended servings22 of grains, vegetables, fruits, low-fat dairy and low-fat protein sources, and contained the level of meat and eggs proscribed for each treatment. Fifthly, fat was added to each diet to bring the total fat to the targeted level. Fat was added first by substituting low-fat dairy and meats with full-fat sources, then by adding plant oils. Finally, diets were adjusted for calories. Diets below the caloric goal were bolstered by adding sweeteners (up to 10% dietary energy) and extra base plant foods (grains, vegetables and fruits). Diets above the caloric goal were trimmed by reducing the quantity of base plant foods. The composition of the diets is outlined in detail in Peters et al.Reference Peters, Wilkins and Fick27.
It is assumed that all food contained in the diets could be grown in NYS. To account for seasonality of produce availability, both ‘summer’ and ‘winter’ diets were designed. Only processed or storable fruits and vegetables were used in the winter diets.
Land requirements and carrying capacity estimates
Annual per capita land requirements were calculated based on dietary intake, crop yields and livestock feed requirements (Eqn 1). Average daily dietary intake was used to derive annual food intake for each diet.

For each diet, the per capita area of land required annually (A percap) is the sum of the area required for all plant- and livestock-derived foods. For each plant commodity (i), annual intake (Q) was multiplied by a conversion factor (L) to account for losses incurred in processing, distribution and after purchase by the consumer, as well as inedible portions included in the harvested crop weight. This loss-adjusted weight of food was then divided by the crop yield (Y) to calculate the land requirements per commodity. For each animal product (j), loss-adjusted weight was multiplied by the livestock feed requirements (R) for each ingredient (k) in the ration, and then divided by the associated component crop yield (Y) to derive land requirements. Published estimates of processing yields and post-harvest losses were obtained from US Department of Agriculture (USDA) publicationsReference Matthews and Garrison28–Reference Kantor30. Yield estimates were obtained from both the state31 and national32, 33 branches of USDA-National Agricultural Statistics Service (NASS). Livestock feed requirements were obtained from the animal science faculty at Cornell University. To account for annual variation in yields, land requirements were calculated using 5 years of crop data: 1999–2003.
Land use data from 1999 to 2003 were used to derive the quantity and quality of available agricultural land in the model. It was assumed that all harvested cropland, cropland pasture and permanent pasture should be considered available for use in the model. For the purposes of estimating carrying capacity, land was divided into three quality categories: cropland useable for all crops, cropland limited to perennial crops and pasture, and land limited to pasture. It was assumed that the current distribution of annual to perennial crops represented a reasonable use of NYS cropland. Based on current land use patterns, a total of 2031 thousand ha were considered available to the model: 712 thousand ha of cropland usable for all crops, 1063 thousand ha of cropland limited to perennial crops and pasture, and 255 thousand ha limited to permanent pasture31.
Calculation of carrying capacity of the New York land resource base was performed using the per capita land requirements for each diet in conjunction with estimates of available agricultural land in NYS (Eqn 2). Carrying capacity (C) was determined using a conditional (if/then) equation that determined which category of land was limiting to food production. This was done by comparing the per capita requirements (A) for each type of land to the amounts available (L) in NYS [cropland useable for all crops (a), total cropland (c) pasture land (p) and total agricultural land (t)]. The available land area was then divided by the per capita land requirements for the limiting resource to calculate the potential population fed.

The estimates of per capita land requirements and potential carrying capacity were analyzed using two-factor ANOVA and multiple linear regression. Two-factor ANOVA was used to determine the percentage of variation that can be explained by the two main factors in the diet: meat and fat. Multiple linear regression was then used to estimate the per unit effect of adding meat or fat to the diet.
Results
Land requirements by category of food
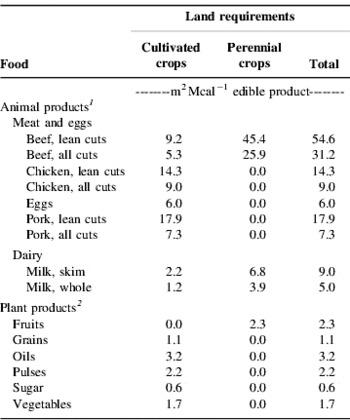
The area of land required to produce different types of food is displayed in Table 2. Total land required per unit of edible energy ranged from 0.6 m2 Mcal−1 (sugar) to 54.6 m2 Mcal−1 (lean beef). Several patterns emerge from this comparison. Protein-rich legumes and lipid-rich oilseeds required from 1.6 to 2.2 times the quantity of land per unit edible energy as the carbohydrate-rich grains. Animal products (excluding beef) required 3.3–6.3 times the amount of land as the grains. Beef stood alone in requiring 31 times the land area as the equivalent quantity of grain. However, it was also clear that the majority of the land used by ruminant animals was devoted to perennial crops. The cultivated land requirements for beef were comparable to other meats, while those of milk were the lowest among all protein sources.
Land requirements per unit edible energy for selected foods and food groups based on crop yields in NYS.

1 Assumes the following rations for each class of livestock: (beef) 0.85 ha pasture, 2.4 Mg hay, 1.7 Mg corn, 68 kg soy are required to meet maintenance requirements of cow plus raise calf to market weight; (pork) assumes hog ration is 70% corn, 23% soy, 7% mineral and animals require 3 kg ration per 1 kg of weight gain; (chicken) assumes broiler ration is 60% corn, 35% soy, 5% mineral and animals require 2.1 kg ration per 1 kg weight gain; (eggs) assumes layer ration is 60% corn, 30% soy, 10% mineral and animals are fed 100 g per day for a 55 week period (300 eggs); (dairy) assumes 540 kg grass silage, 300 kg alfalfa silage, 120 kg corn, 90 kg soy, and 50 kg by-product feed are required per 1.0 Mg fluid milk (whole herd average).
2 Values shown are weighted averages based on the crops included in the model.
Land requirements per capita
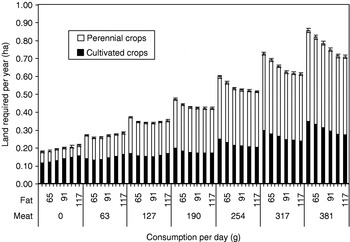
A nearly fivefold difference in per capita land requirements was observed between the diets (Fig. 1). Average annual land requirements per person ranged from 0.18 ha (0 g meat, 52 g fat) to 0.86 ha (381 g meat, 52 g fat). In general, per capita land requirements increased with increasing quantities of meat in the diet, while the influence of the quantity of fat varied depending on the quantity of meat consumed. In addition, the proportion of land in perennial crops was greater in higher meat treatments than in lower meat and vegetarian treatments.
Mean annual per capita land requirements for meeting human food needs according to diets varied in their content of meat and total fat. Assumes all food was grown in NYS (1999–2003 yields). Error bar is standard error of the mean.

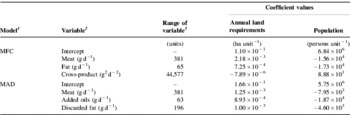
Two-factor ANOVA indicated that the quantity of meat in the diet explained the majority of the variability (97.2%) observed between the diets, while the quantity of fat (0.9%) and the interaction term (1.4%) explained only small, though statistically significant, fractions of the total variability (data not shown). However, ANOVA provided no indication of the influence each one unit change in meat or fat had on land requirements. Since both factors are quantitative, it is appropriate to study the nature of the response function using regression analysisReference Neter, Kutner, Nachtsheim and Wasserman34. Thus, multiple linear regression was used to model the relationship between the quantity of meat (M), the quantity of fat (F), and the cross-product (C). In this model (hereafter referred to as the MFC model), F was expressed in grams of fat rather than percent calories from fat, to allow more ready comparison with M. According to the analysis, both M and F were positively correlated with the annual per capita land requirements, while C was negatively correlated (Table 3). In addition, the effect of increasing the M in the diet by 1 g was three times greater than that of increasing F by 1 g. The total effect of M and F on the land requirements of diet was mitigated by C. The greater range of M relative to F, combined with the greater impact per gram, explained why meat accounted for nearly all of the variability observed in the ANOVA.
Coefficient values for two multiple linear regression models used to predict the annual per capita land requirements of producing a complete diet from NYS agricultural land and the potential population fed from that land as a function of diet.

1 Model names are acronyms of the variables included in the multiple regression models. See text for complete description of the models.
2 Variables indicate the quantity of product consumed (avoided) in a given diet. Units are shown in parentheses. See text for complete description of the variables.
3 Size of the range covered by the diets. Meat ranges from 0 to 381 g d−1, fat from 52 to 117 g d−1, cross-product from 0 to 44,577 g2 d−2, added oils from 1 to 64 g d−1, and discarded fat from 0 to 196 g d−1.
The cross-product C is essentially a linear correction for the influence of F at a given level of M. The regression equation predicted that in low meat diets, land requirements tend to increase with increasing fat, while the reverse is true in high meat diets. This simple correction accounted for much of the variation, but did not explain the mechanism behind the shift. Thus, we decided to decompose F into more than one variable.
In theory, fat present in food (e.g. meat fat) or fat inherent to the production of food (e.g. oil expressed from high-protein feed grains) comes at no additional land cost. Therefore, consuming this fat spares land that would otherwise be needed to produce additional calories. Conversely, discarding this fat necessitates that additional land be used. Fat can, therefore, be divided into three classes: fat that is inherent in the production of other foods and is consumed, inherent fat that is discarded, and additional oil crops grown to meet dietary fat goals. Since only the latter two classes should influence land use, an alternative model was developed that predicts land use based on the quantities of meat (M), added oils (A), and discarded fat (D). The resulting model (hereafter referred to as the MAD model) explained slightly more of the variability than the MFC model (r 2=0.99 versus 0.98), and captured the pattern of variation observed between treatments with different quantities of fat but the same level of meat. According to the regression coefficients (Table 3), M caused somewhat greater per unit increases in land requirements than either A or D (40 and 25%, respectively). However, the range of M was much greater than that of A or D.
Potential carrying capacity of NYS
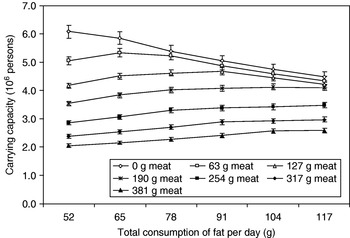
A threefold difference in potential carrying capacity for NYS was observed among the diets (Fig. 2). The population potentially fed from the NYS land base ranged from 6.08 million persons (0 g meat, 52 g fat) to 2.04 million persons (381 g meat, 52 g fat). In general, the population supported by NYS decreased with increasing fat in the no meat diet, reached a peak then declined in the 63 and 127 g meat diets, and increased with increasing fat in the 190–381 g meat diets. In general, lower meat diets supported more people than higher meat diets. However, the differences between diets with different meat levels decreased as fat increased.
Potential human population supported by the NYS agricultural land base according to 42 diets varied in their content of meat and total fat. Based on 1999–2003 crop yields. Error bar is standard error of the mean.

As with land requirements, two-factor ANOVA indicated that meat explained most of the variability (87.2%) observed in carrying capacity across the diets, while fat and the interaction term had small, statistically significant effects (0.5 and 7.3%) (data not shown). Multiple linear regression was used to model the differences in potential carrying capacity and to estimate coefficients. The same two models were used. The MAD model had a slightly better fit to the data than the MFC model (r 2=0.93 versus 0.92) and better predicted the difference between treatments with the same level of meat consumption. According to the MFC model, the decrease in potential carrying capacity was slightly greater (12%) per gram of F than it was per gram of M (Table 3). In addition, the MAD model shows that increases in A had a much greater per unit impact on potential population than either M or D (235 and 407%, respectively). However, the range observed in M was much greater than that of either A or D.
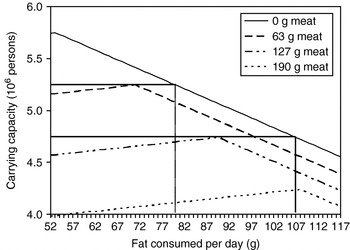
Both models suggested that though vegetarian diets generally support more people, considerable overlap exists with low meat diets. The theoretical carrying capacity of NYS agricultural land was estimated for each level of meat consumption across the entire range of fat (Fig. 3). According to this analysis, a diet containing 63 g (2 oz) of meat and 71 g (27%) fat would support the same population as a vegetarian diet containing 80 g (31%) fat. Similarly, a diet containing 127 g (4 oz) meat and 90 g (34%) fat could support a population equal to that of a vegetarian diet with 107 g (41%) fat. No overlap with the vegetarian diet occurred for the diet containing 190 g meat.
Carrying capacity of NYS agricultural land as a function of diet according to the coefficient values of the MAD (meat, added fat, discarded fat) multiple linear regression model. Lines parallel to the axes indicate where some lower-fat omnivore diets feed as many, or more, people than higher-fat vegetarian diets.

Discussion and Conclusions
The land required to produce a calorie of food in NYS demonstrates that a hierarchy exists in the resource requirements of producing food. If a continuum were to be drawn, meat would lie at the land intensive end of the spectrum followed by eggs, dairy, fruits, oilseeds, vegetables, beans, and finally grains. However, the results also indicate that ruminant meat and milk requires less land devoted to annual crop production relative to other meats and beans. Thus, we conclude that the inclusion of beef and milk in the diet can increase the number of people fed from the land base relative to a vegan diet, up to the point that land limited to pasture and perennial forages has been fully utilized.
Observed per capita land requirements for each diet make sense in light of the individual food or food group land requirements; however, the complete diet calculations highlight an important interaction. Overall, meat is the primary driver of increasing land use in the range of diets observed. The fat content of the diet only influences the quantity of land required when it necessitates that additional oil crops be grown to meet the demand for fat or that fat be avoided in favor of leaner meat, low-fat milk and extra plant carbohydrates. It is important to note that this ‘avoided’ fat is unlikely to be discarded. Rather, such surplus commodities are simply transferred to another population. Thus, the ‘discarding’ of fat may represent a cost in terms of poor nutrition rather than increased land use.
Calculation of the potential carrying capacity of NYS also demonstrates the interaction between resource base and diet. The range in per capita total land requirements suggested that the least land intensive diet would feed five times the number of people as the most land intensive diet. However, the population estimates show just a threefold difference in population. This is explained by the fact that higher meat diets use a greater proportion of the available perennial forage and pasture land. In addition, the higher populations supported by lower fat, non-vegetarian diets relative to higher fat, vegetarian diets support the claims by animal scientistsReference Oltjen and Beckett18, Reference Bradford19 that the inclusion of animal products in the diet can increase the amount of humanly edible calories available in the food supply. Indeed, more substantial differences may have been observed had a vegan diet been included among the diet scenarios. Nonetheless, it is critical to note that the area of overlap observed occurs between 63 g (2 oz) and 127 g (4 oz) of meat, far below the 163 g daily consumption of the average American.
The implications of this analysis with regard to the agricultural carrying capacity of NYS are clear. The New York land base is too small to support the resident population. While it could feed a significant portion of the population (21%, based on the 2000 Census35 and assuming a 190 g meat, 30% fat diet), it will remain a net food importer. Furthermore, in regions with similar climate and land resources, such as the Great Lakes area of the US and Canada, it appears that while meat increases land requirements, diets including meat can feed more people than some higher fat vegetarian diets. In order to determine if these patterns hold true for agriculture in general, the model would need to be applied across a wider range of environments and animal production systems. Per capita land requirements and potential carrying capacity should not be the final arbiter on what is considered the optimal diet, but an accurate understanding of how diet influences land use is essential to making wise decisions on policy that influences food security, nutrition and environmental degradation.
FraserReference Fraser36 argued that research and analysis are needed to correct the overly simplistic and contradictory perceptions that pervade the ‘debate’ on animal agriculture. Our analysis shows that kernels of truth exist in both the claim that livestock production decreases the food supply and the claim that livestock production increases it. On balance, meat increases the land requirements of diet more so than fat. However, diets which include modest levels of meat and fat consumption can feed slightly greater numbers of people than vegetarian diets that provide more generous quantities of fat. Future research on the resource requirements of diet should not consider the impact of individual foods in isolation, but in the context of a complete diet and a complete food system.
Acknowledgements
This research was supported in part by the National Research Initiative of the USDA Cooperative State Research, Education, and Extension Service, grant number 2005-55618-15640.