INTRODUCTION
With about 800 species distributed worldwide in the tropics and subtropics, Ficus (Moraceae) is one of the largest genera of woody plants (Berg Reference BERG1989, Janzen Reference JANZEN1979). Fruits of figs have been recognized as important ‘keystone’ food resources, as they provide large and sustained amounts of food to many frugivorous animals in tropical forests (Kannan & James Reference KANNAN and JAMES1999, Kinnaird et al. Reference KINNAIRD, O'BRIEN and SURYADI1996, Kissling et al. Reference KISSLING, RAHBEK and BÖHNING-GAESE2007, Lambert & Marshall Reference LAMBERT and MARSHALL1991, Leighton & Leighton Reference LEIGHTON, LEIGHTON, Sutton, Whitmore and Chadwick1983, Terborgh Reference TERBORGH and Soulé1986). The fruit characteristics of figs, a soft pulp and numerous tiny seeds, make it suitable for consumption by many birds and other animals (Janzen Reference JANZEN1979, McKey Reference MCKEY, Gilbert and Raven1975, Shanahan et al. Reference SHANAHAN, SO, COMPTON and CORLETT2001). A comprehensive review indicated that animals known to eat figs include over 10% of the world's bird species (18% of genera) and over 6% of the world's mammals (14% of genera) (Shanahan et al. Reference SHANAHAN, SO, COMPTON and CORLETT2001).
Fig species vary greatly in their morphology, such as the fruit traits (size and colour, etc.), ways of fruit display, crop size, canopy height, and other characteristics. These differences may affect the assemblage of frugivores on different figs. For example, fruits spanning a wide range of size classes, which ripen synchronously and remain green (greenish) when ripe, are often dispersed by bats, and thus recognized as ‘bat’ figs. In contrast, fruits of ‘bird’ figs have small fruit that ripen asynchronously and turn red when ripe. The fruit size of figs in the New World was found to be correlated with the body size of the bats that dispersed the seeds (Kalko et al. Reference KALKO, HERRE and HANDLEY1996). Vertical stratification of figs significantly influenced the assemblage of fig eaters in lowland tropical forests in South-East Asia (Shanahan & Compton Reference SHANAHAN and COMPTON2001). Many other works aiming at recording frugivores feeding on fig trees in tropical Asia have also demonstrated a wide range of animals consuming figs (Kinnaird & O'Brien Reference KINNAIRD, O'BRIEN, Dew and Boubli2005, Poonswad et al. Reference POONSWAD, CHUAILUA, PLONGMAI, NAKKUNTOD and Poonswad1998). However, to our knowledge, systematic studies to understand how fig fruit characteristics influence the assemblage of frugivorous animals are still lacking (except Shanahan & Compton Reference SHANAHAN and COMPTON2001).
Forest habitats may also affect avian community structure (Gil-Tena et al. Reference GIL-TENA, SAURA and BROTONS2007, Mitchell et al. Reference MITCHELL, HIERS, O'BRIEN, JACK and ENGSTROM2006). Those differences, in turn, will influence the frugivore composition in each fruiting tree that is located in different habitats. For example, the degree of human disturbance, such as fragmentation of the forest (Brawn et al. Reference BRAWN, ROBINSON and THOMPSON2001), may affect the community structure of birds and thus may be reflected by the frugivores visiting fruiting plants.
Studies of plant–animal networks, especially for mutualistic interactions, have grown extraordinarily in the last few years (see Bascompte & Jordano Reference BASCOMPTE and JORDANO2007 for a review). A specific type of asymmetrical specialization, termed nestedness, is often used to describe the interaction network (Bascompte et al. Reference BASCOMPTE, JORDANO, MELIÁN and OLESEN2003). Nested networks are characterized by: (1) generalists that all interact with each other, forming a core of interacting species; (2) specialists that commonly interact only with generalists; and (3) the absence of specialists that interact only with other specialists (Guimarães et al. Reference GUIMARÃES, RICO-GRAY, FURTADO DOS REIS and THOMPSON2006). Recent work has led to the conclusion that mutualistic networks, in comparison with other interactions such as antagonistic networks, are much more nested (Bascompte & Jordano Reference BASCOMPTE and JORDANO2007, Jordano et al. Reference JORDANO, BASCOMPTE and OLESEN2003). Several mechanisms have been proposed to explain nested patterns in species assemblages, including differences in extinction probabilities, differences in colonization abilities, nested structure of habitats or niche space and passive sampling (Cutler Reference CUTLER1994, Lomolino Reference LOMOLINO1996, Worthen Reference WORTHEN1996). Research is needed to understand how the nestedness of mutualistic networks changes in time and space, and how it changes in response to forest disturbance (Bascompte & Jordano Reference BASCOMPTE and JORDANO2007, Guimarães et al. Reference GUIMARÃES, RICO-GRAY, FURTADO DOS REIS and THOMPSON2006, Martínez-Morales Reference MARTÍNEZ-MORALES2005, Meyer & Kalko Reference MEYER and KALKO2008).
In this study, we conducted a systematic survey of the interaction between figs and frugivorous birds, one of the typical mutualistic interactions in most tropical areas. We developed the following hypotheses: (1) The morphological differences between Ficus species, such as fruit size, fruit colour, tree height, crop size and canopy size, will influence the composition of the frugivore assemblage attracted. (2) Different microhabitats may also shape frugivorous bird assemblages of fig trees. (3) The fig and frugivorous bird network may differ among the different habitats.
METHODS
Study sites
The study was conducted from May 2004 to January 2006 in Menglun, Xishuangbanna, Yunnan province, China (21°55′N, 101°15′E, 550–600 m asl). Climate in the study site is tropical monsoon, characterized by a distinct rainy season (May–October), with peak precipitation occurring in July–September, followed by a cool-dry season (November–January) and a hot-dry season (February–April).
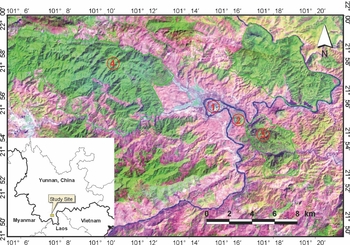
We selected four different sites representing the different microhabitats in this area. The study sites are 2–9 km apart (Figure 1). (1) Arboretum in Xishuangbanna Tropical Botanical Garden (XTBG arboretum). Different fig species have been planted in the arboretum. Fig trees in the arboretum are often in an open space and the arboretum is disturbed by tourist activities. (2) Seasonal rain forest in Xishuangbanna Tropical Botanical Garden (XTBG forest). This is a piece of fragmented forest located on the eastern part of the XTBG with an area of 100 ha. The original forest was seasonal tropical rain forest. It was severely logged during the 1970s and thereafter was strictly protected. Occasional visitors walk along trails inside the forest. (3) Limestone tropical rain forest (Limestone forest). This is an isolated piece of primary forest with an area of about 300 ha belonging to the national natural reserve. The forest type is tropical seasonal moist forest located on limestone (Zhu Reference ZHU2006). Human activities are forbidden inside the forest. (4) Menglun Natural Reserve (ML primary forest). This is a continuous forest belonging to the national natural reserve with an area of about 3000 ha. The forest type is tropical seasonal rain forest (Cao et al. Reference CAO, ZHANG, FENG, DENG and DENG1996) and is strictly protected against human activities.
Map showing the location of the four study sites and the degree of fragmentation. The pink areas represent rubber plantations and the green natural forest. Site 1: XTBG arboretum; Site 2: XTBG forest; Site 3: limestone forest; Site 4: ML primary forest.

Observation of frugivorous bird species in fig trees
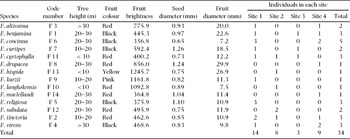
We investigated fig-eating birds in 32 fruiting fig trees belonging to 14 species located in four different habitats (Table 1). These four habitats represented a varied degree of fragmentation and human disturbance in the same area (< 100 km2) in Xishuangbanna, Yunnan province of China (Figure 1). >
Morphology of 14 Ficus species and distribution of 32 observed fig individuals at the four different sites. Nomenclature follows Zhou & Gilbert (Reference ZHOU and GILBERT2003). Fruit brightness was calculated by the area under the curve of the reflectance curve. See text for the description for each site. Site 1: XTBG arboretum; Site 2: XTBG forest; Site 3: limestone forest; Site 4: ML primary forest.

We used the focal observation technique for recording bird species that visited each selected fig tree and took an area of 2 × 2 m2 in tree canopy for quantitatively recording the visiting frequencies of birds. During observations, we recorded fig-eating bird species, number of individuals, feeding behaviour and number of fruits consumed. Fig-eating birds were observed with the aid of 8 × 50 binoculars, and identified based on the bird field guide (MacKinnon & Phillipps Reference MACKINNON and PHILLIPPS2000). Three days of observation per fig tree were conducted. For each observation day, six time periods were selected for observation: 7h00–8h30, 9h00–10h30, 11h00–12h30, 13h00–14h30, 15h00–16h30 and 17h00–18h00. We then calculated the number of bird species and number of individuals of each bird species at each fig tree. A total of 96 days and 816 h of observations were conducted for the 32 individual trees.
Survey of bird species at the four study sites
To understand the bird community in the four study sites, we conducted line transects and fixed-radius counts between March 2004 and February 2005. The surveys were conducted in three different seasons: dry and hot season (February–April), rainy season (June–October) and cool and dry season (November–January). The transects were about 1500 m long and were divided into 30 plots at intervals of 50 m. It took about 6 min for observation in each plot at a radius of 25 m. Records included the numbers and species of all birds seen. Time during the day was 6h30 to 18h30, divided into four periods: 6h30–9h30, 9h30–12h30, 12h30–15h30 and 15h30–18h30. Each study site was observed for 4 d (48 h) per season, so a total of 576 h of observation were made over three seasons. Fig-eating birds were observed with the aid of 8 × 50 binoculars, Birds in field were identified based on two bird field guides (Lekagul & Round Reference LEKAGUL and ROUND1991, MacKinnon & Phillipps Reference MACKINNON and PHILLIPPS2000).
Fig species and fruit characteristics
We took the most common fig species in our study area for this study. Ficus species were identified by reference (Zhou & Gilbert Reference ZHOU and GILBERT2003) and voucher specimens were deposited in the Herbarium of the Xishuangbanna Tropical Botanical Garden (HITBC). We collected 20–30 ripe fruits of each fig species and measured fruit size with vernier callipers (0.1 mm in accuracy). Ripe fruits were collected and both the brightness and colour of fruit were determined. The reflectance values were determined by using an Ocean Optics S2000 spectrometer (OOIIrrad2 software ver. 2.05.00 PR 12) with a Xenon strobe light source using standard techniques. We calculated the area under the reflectance curve from 400 to 700 nm as a measure of overall reflectance for the brightness (we followed Borgia & Keagy Reference BORGIA and KEAGY2006). Tree height was calculated by using a clinometer. The canopy width was measured and averaged by cross directions. Crop size was estimated as fruit production per branch × canopy volume. Fruit production per branch was calculated by counting fruits on ten 1-m branches; canopy volume was estimated as canopy height × canopy width × canopy length.
Statistical analysis
The species diversity of frugivorous birds in each site was described using Shannon's index (H'), maximum diversity (Hmax) and evenness (J), and the similarity of the bird community between each pair of sites was estimated using Sørensen's index (Cs) (Southwood Reference SOUTHWOOD1978).
A nested ANOVA was adapted to analyse if significant differences of visiting birds, indicated by the total number of bird individuals (Nb), number of bird species (Ns) and bird diversity index (H'), existed among different sites. Simple and multiple regressions were used to examine whether fruit traits (size, colour and brightness) and tree characteristics (canopy volume and crop size) were related to visiting frugivorous birds.
To understand the properties of the fig–bird network, we first followed Bascompte et al. (Reference BASCOMPTE, JORDANO, MELIÁN and OLESEN2003) for the calculation of T value. T is the matrix temperature, a measure of matrix disorder with values ranging from 0° (perfectly nested) to 100° (perfectly non-nested). The T value was calculated by using the software Nestedness Calculator (The nestedness temperature calculator: a visual basic program, including 294 presence–absence matrices. AICS Research, Inc., University Park, NM, USA). We understand the T value for each community may be influenced by species richness in the networks. To compare nestedness among different study sites, we tested this hypothesis using the following algorithm to compare pairs of networks in which L is the larger network and l is the smaller network. (1) Assuming that the probability of a plant species being removed is equal for all plant species, randomly remove plant species of L until FL = Fl; (2) record the nestedness of the rarefied L network; (3) repeat 1000 times; (4) calculate the probability P that a rarefied L shows a degree of nestedness equal to or more extreme than l.
Secondly, we used a FORTRAN program (Nestedness – a FORTRAN program for calculating ecological matrix temperatures. www.uni.torun.pl/~ulrichw) to evaluate the properties of the interaction. The program gave the results for the matrix temperature, the observed matrix temperature and the simulated temperatures according to the predefined null model and the standard deviation. The program also calculated the respective lower and upper 95% confidence limits.
RESULTS
Frugivorous bird species at four study sites
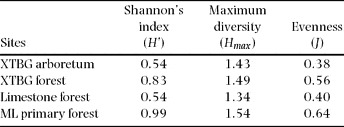
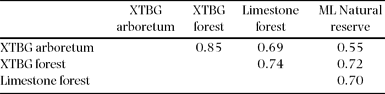
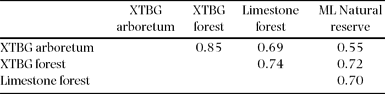
A total of 45 species of frugivorous bird was recorded at the four study sites. The ML primary forest had the highest species number (35 spp.), followed by the XTBG forest (31 spp.), the XTBG arboretum (27 spp.), and the limestone forest (22 spp.). The Shannon diversity index (H') showed a similar pattern to species number (Table 2). The XTBG arboretum and the XTBG forest sites achieved the highest similarity (Cs = 0.85) between their frugivore assemblages, while the XTBG arboretum and the ML primary forest sites had the lowest (Cs = 0.55) (Table 3).
Species diversity indices of frugivorous birds in different habitats. See text for description of the different sites.

Similarity of frugivorous bird species in four sites calculated by Sørensen's similarity index (Cs). See text for description of different sites.
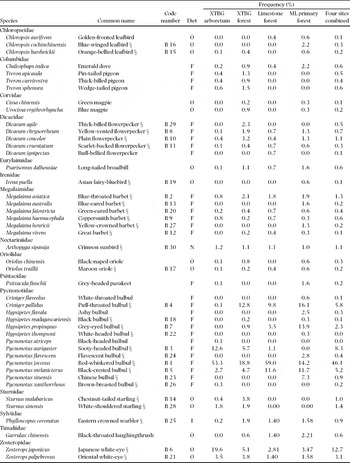
The most abundant frugivorous birds in the area were the red-whiskered bulbul (Pycnonotus jocosus) (46.1%), Japanese white-eye (Zosterops japonicus) (12.7%), sooty-headed bulbul (Pycnonotus aurigaster) (8.3%) and puff-throated bulbul (Criniger pallidus) (5.8%). However, the most abundant bird species differed amongst sites, except that red-whiskered bulbul was always common across the four sites. Puff-throated bulbul (Criniger pallidus) was abundant at both the XTBG forest (12.8%) and ML primary forest sites (16.1%); black-crested bulbul (Pycnonotus melanicterus) was rather abundant at the limestone forest site (11.6%) and Japanese white-eye (Zosterops japonicus) was dominant at the XTBG arboretum site (19.6%) (Appendix 1).
Frugivorous birds visiting fig trees
A total of 30 species belong to 10 families of fig-eating birds was recorded visiting the 32 fig trees of 14 species in the four microhabitats. Fig-eating birds were composed of bulbuls (10 spp., 33.3%), barbets (6 spp., 20.0%), flowerpeckers (4 spp., 13.3%), white-eyes (2 spp., 6.7%), starlings (2 spp., 6.7%), leafbirds (2 spp., 6.7%), bluebirds (1 sp., 3.3%) and orioles (1 sp., 3.3%), and some opportunistic frugivorous birds such as sunbirds (1 sp., 3.3%) and warblers (1 sp., 3.3%) (Appendix 1).
Among the fig species, Ficus benjamina, F. tinctoria and F. altissima had the highest diversity of visiting bird species, a total of 15 bird species for each. Some other fig species, such as F. cyrtophylla, F. subulata and F. maclellandi, had relatively few bird species visitors.
Across the four sites, red-whiskered bulbul (Pycnonotus jocosus), blue-throated barbet (Megalaima asiatica), sooty-headed bulbul (Pycnonotus aurigaster) and puff-throated bulbul (Criniger pallidus) were the bird species that visited the most different fig species. White-headed bulbul (Hypsipetes thompsoni) and brown-breasted bulbul (Pycnonotus xanthorrhous) were the bird species that visited the fewest fig species.
Frugivorous birds visiting most fig species often were the species with highest abundances in the habitat. For example, the most abundant bird species at the XTBG arboretum were red-whiskered bulbul (53%) and Japanese white-eye (19.6%). Both of these were the frugivorous species that visited the most fig trees. Similar tendencies occurred for puff-throated bulbul (16.1%), red-whiskered bulbul (14.2%) and grey-eyed bulbul (13.9%) in the ML primary forest (Appendix 1).
Habitat, season and characteristics of fig trees that influence dispersers
The total number of birds visiting each fruiting tree (Nb) was significantly correlated to the total number of species visiting (Ns) (Pearson correlation, r = 0.448, P = 0.01), but not to the Shannon Index of bird diversity (H') (r = 0.168, P = 0.359). Ns was significantly correlated to Shannon index H' (r = 0.843, P < 0.0001).
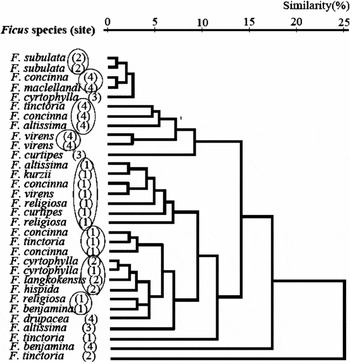
The nested ANOVA test indicated that habitat did not have a significant influence on the total number of visiting birds (F3, 22 = 1.79, P = 0.248), total bird species (F3, 22 = 0.611, P = 0.6323) and bird diversity index (F3, 22 = 0.486, P = 0.704). Cluster analysis indicated that habitat may influence the composition of bird species on a fig tree. Different fig species located at the same site received a similar assemblage of birds compared with the same fig species located at a different site (Figure 2).
Dendrogram showed the similarity of visiting bird assemblages using cluster analysis (SPSS version 11.5). Numbers of individuals of different birds were calculated. The similarity of visiting bird assemblages to fig plants at the same site generally appeared to be higher than that at different sites, as indicated by the rings around groups of sites.

Among the characteristics tested, both crop size (Pearson correlation, r = 0.443, P < 0.05) and canopy volume (r = 0.418, P < 0.05) were significantly correlated to H' value. Other characteristics did not show a significant correlation to visiting bird species.
Fig–frugivorous bird network
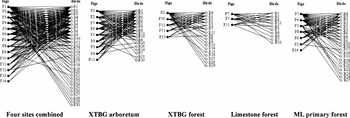
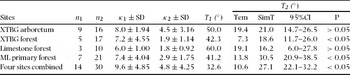
The interaction networks in the four sites and the four sites combined are presented in Figure 3. Combining the four sites together, fig and frugivorous bird interactions showed a significant nestedness (Table 4). Different sites showed a different nestedness structure. High nestedness occurred in the ML primary forest and the XTBG forest (Table 4). The limestone forest had the lowest nestedness. While controlling for network size among the four sites, the ML primary forest and the XTBG forest showed a similar degree of nestedness, but these two sites showed significantly stronger asymmetries than the other two sites. The limestone forest had the least asymmetry compared with the other sites (data not shown).
The networks among figs and fig-eating birds at four study sites. Ficus and bird species in the figure are indicated by codes explained in Table 1 and Appendix 1 respectively.

Summary of fig–bird interactions at the four sites. n1: Number of fig species involved, n2: Number of bird species involved, κ1: Median number of interactions per fig species, κ2: Median number of interactions per bird species. T1: a measure of matrix temperature calculated with Nestedness Calculator.software T2: temperature matrix measured using Nestedness program. Tem: the observed matrix temperature. SimT: the simulated temperatures according to the predefined null model. 95%CI represents the 95% confidence limits.

The overall interaction of fig–birds across the four sites estimated using the FORTRAN program had a nestedness temperature (T) of 10.6, which was significantly lower (P < 0.05) than the mean T of 1000 randomly generated matrices (T = 27.1, SD = 2.68) (Table 4). For the different sites, only the T value of the ML primary forest and XTBG forest sites were significantly lower than the randomly generated matrices, while the other two sites did not differ significantly between the T value and the mean of 1000 randomly generated matrices (Table 4).
DISCUSSION
Which species eat figs?
In this study, fig species attracted a total of 30 species of bird, comprising 66.7% of the total recorded frugivorous bird species in this area. Small passerine birds such as bulbuls were the dominant frugivores of fig trees.
Fig fruits, with soft pulp and numerous tiny seeds, are suitable for consumption by most birds and other animals, thus playing a role as important ‘keystone’ food resources to many frugivorous animals in tropical forests. Forty years ago, Janzen (Reference JANZEN1979) raised the question: ‘who eats figs?’ to which he answered ‘everybody’. Bulbuls were the prevalent birds visiting fig fruits in the marginal tropical area. Previous studies in tropical Asia also revealed that small passerines were the dominant frugivores of fig species. In India (Balasubramanian Reference BALASUBRAMANIAN1996) and the Philippines (Heindl & Curio Reference HEINDL and CURIO1999), the most frequently observed frugivores were all passerine birds. These tendencies were also confirmed in the subtropical forests of Hong Kong (Corlett Reference CORLETT1996, Reference CORLETT1998) and Yakushima Island, Japan (Noma & Yumoto Reference NOMA and YUMOTO1997).
Fruit-eating birds influenced by characteristics of fruit trees
In this study, the crop size and canopy volume had a significant effect on the species diversity (H') of frugivorous birds. Similar patterns have been reported from other studies on figs. For example, Shanahan & Compton (Reference SHANAHAN and COMPTON2001) reported that crop size had a significant effect on the number of visiting animal species. Crop size has also been reported to influence visiting frugivores for other fleshy fruited plant species (Fleming Reference FLEMING1981, Gryj & Dominguez Reference GRYJ and DOMINGUEZ1996, Howe & DeSteven Reference HOWE and DESTEVEN1979, Howe & Vande Kerckhove Reference HOWE and VANDE KERCKHOVE1979, Korine et al. Reference KORINE, KALKO and HERRE2000, Murray Reference MURRAY1987).
Fig morphology, such as fruit size and fruit colour, did not have a significant effect on the bird assemblage. Fruit size has a critical impact on the birds visiting most fruiting plants, but is less important with figs, where most birds can peck pieces from fruits too large to swallow. Our field observation also indicated that birds may alter their feed behaviours in response to different fig fruits. For example, red-whiskered bulbul with a gape width of 9.4 mm swallow small figs such as F. concinna (6.4 mm) and F. langkokensis (7.5 mm), but it pecks at large figs such as F. cyrtophylla (12.0 mm), F. curtipes (18.4 mm) and F. benjamina (22.2 mm). Most small birds, such as Japanese white-eye with a gape width of 6.0 mm, feed on most Ficus spp. by pecking, while most large birds, such as great barbet with a gape width of 27.2 mm, feed on most Ficus spp. by swallowing.
Fruit colour of figs did not show a significant effect on the visits of fig-eating birds. This may be because the fig species in this study are mainly bird-dispersed species with red (50%) or black (35.7%) figs, with only a few bat-dispersed species, such as F. hispida with a yellow colour. Thus, the effect of colour was not statistically significant. Other studies have suggested that plants may use ultraviolet signals to attract birds (Willson & Whelan Reference WILLSON and WHELAN1989), but the figs in this study did not reflect in the ultraviolet, which is indicated by the reflection measurement.
Differences in fig–bird interaction nestedness among sites
As a whole, fig–bird interactions in this study showed a nested pattern of asymmetrical specialization. Comparing with the degree of nestedness among sites, significant nestedness only occurred in the ML primary forest and the XTBG forest. The four sites comprised many different variables, and it is difficult to generate any generalized patterns. However, the results clearly indicate that the four sites differed in the nestedness of fig–bird interactions.
These results corroborate and extend the conclusions of recent studies that suggest that interactions among free-living species in species-rich communities show a nested pattern of asymmetrical specialization (Bascompte et al. Reference BASCOMPTE, JORDANO, MELIÁN and OLESEN2003). Plant species richness in the non-limestone forests was significantly higher than the neighbouring limestone forest (Zhu et al. Reference ZHU, WANG, LI and SIRIRUGSA2003). Bird species in limestone forest were also significantly fewer than in the non-limestone forest.
Several studies have explored the degree of forest fragmentation that influence the plant–animal interaction, and suggested that the size of forest fragment did shape the interacting nestedness of plants with bats and many groups of birds (Martínez-Morales Reference MARTÍNEZ-MORALES2005, Meyer & Kalko Reference MEYER and KALKO2008). Although the bird similarity between the XTBG arboretum and XTBG forest sites was relatively high (Table 3), the nestedness differed significantly. The XTBG arboretum is an open area with more human activities and this may alter the structure of the mutualistic interactions.
Determining the mechanism behind this requires a more detailed study. Several species in the XTBG arboretum were much more dominant compared with the XTBG forest and the ML primary forest sites. For example, red-whiskered bulbul (Pycnonotus jocosus) represented 53.3% of total recorded birds during the observation period in the XTBG arboretum and only made up 8.8% and 14.2% in the XTBG forest and ML primary forest, respectively (Table 2). Similarly, Japanese white-eye (Zosterops japonicus) represented 19.6% of total recorded birds in the XTBG arboretum and only 5.1% and 3.5% in the XTBG forest and ML primary forest, respectively. The ‘abundance asymmetry hypothesis’ proposed by Vázquez et al. (Reference VÁZQUEZ, MELIAN, WILLIAMS, BLUTHGEN, KRASNOV and POULIN2007) suggested that abundant species have frequent encounters with individuals of many other species, most of which are relatively rare and specialized, given the pervasive right-skewed distribution of abundance. Furthermore, because the frequency of interaction can be a good surrogate of interaction strength when there is high variation in interaction frequency (Vázquez et al. Reference VÁZQUEZ, MORRIS and JORDANO2005); the relative abundance of a species in a community would also determine its ecological effect on another species. Thus, most pairwise interactions in interaction networks are expected to be asymmetric both in terms of degree (specialists interact with generalists) and strength (rare specialists have weak effects on abundant generalists, but experience strong effects from them).
Understanding plant–animal interaction properties and the adaptations in response to environmental changes may shed light on proper strategy development of biodiversity management. In a disturbed environment, most plants may still get service for seed dispersal while the asymmetrical interaction relationship with frugivorous animals may be altered, which may affect the long-term coevolutionary process between food plants and their dispersers.
ACKNOWLEDGEMENTS
We thank Mr Zhilin Bai for his assistance in field observations, and Mr Hong Wang and Mr Shishun Zhou for their help in plant species identification. We acknowledge Professor Lan Yang for providing bird specimens for measurement, and Professor Richard Corlett and Dr Matthew R. Helmus for constructive suggestions. We thank two reviewers for their criticisms on an early version of the manuscript. The study was supported by the National Science Foundation of China (No: 30570316).
Abundance of frugivorous birds (nomenclature follows MacKinnon & Phillipps Reference MACKINNON and PHILLIPPS2000) at the four study sites. Diet: O = omnivorous, F = frugivorous, N = nectarivorous, and I = insectivorous birds. Birds' diet was determined based on MacKinnon & Phillipps (Reference MACKINNON and PHILLIPPS2000) and authors' observation. § indicates the bird species observed feeding on fig fruit in this study.