Introduction
Seahorses (genus Hippocampus) are visually guided ambush predators. They wrap their prehensile tails around stationary objects and lie in wait for prey (James & Heck, Reference James and Heck1994; Foster & Vincent, Reference Foster and Vincent2004; Choo & Liew, Reference Choo and Liew2006). Once a prey is visually detected, seahorses orient their eyes towards the prey and then reach forward to use a distinctive rapid suction mechanism to capture the prey (Bergert & Wainright, Reference Bergert and Wainright1997). This strategy depends on an acute visual system with the ability to detect small moving prey.
Seahorses are diurnal with the majority of their feeding behavior occurring during the daylight hours under photopic conditions (Kuiter, Reference Kuiter2000). Seahorse habitats vary depending on the species; although within each species, their distribution is generally localized to a particular region. Within an area, most species are bottom dwellers inhabiting shallow waters near landmasses where they live amongst the vegetation (Kuiter, Reference Kuiter2000). Seahorse species have been found in both tropical and temperate waters. The water in shallow tropical coral reefs has a broad spectrum of light including relatively large amount of ultraviolet (less than 390 nm) and the far red (600–700 nm) wavelengths (Mosk et al., Reference Mosk, Thomas, Hart, Partridge, Beazley and Shand2007). Temperate coastal habitats, also known as “green water,” transmit a narrower spectrum with a maximum wavelength around 510–550 nm (Partridge, Reference Partridge, Herring, Campbell and Whitfield1990).
Visual resolution under photopic conditions is determined by a number of factors, including the solid angle viewed by the eye, the cone photoreceptor (PR) spacing (Fernald, Reference Fernald, Atema, Fay, Popper and Tavolga1988), and the region of the retina stimulated. Related to these factors is the convergence of cones to higher order processing cells such as ganglion cells (GCs) with lower convergence values being associated with higher resolution (Campbell & Green, Reference Campbell and Green1965; Collin & Pettigrew, Reference Collin and Pettigrew1989). In many vertebrate retinas, areae of high visual resolution are located in specialized regions surrounded by areae of lower resolution. These high-acuity areae range from local regions of higher GC density as observed in area centralis to foveae centralis, which are not only characterized by a high ganglion and cone PR cell density but have a further morphological specialization of a small depression in the retina where inner retinal neurons are pushed to the side forming a pit, called a fovea (Stone, Reference Stone1965; Provis, Reference Provis1979; Curcio et al., Reference Curcio, Sloan, Packer, Hendrickson and Kalina1987, Reference Curcio, Sloan, Kalina and Hendrickson1990; Packer et al., Reference Packer, Hendrickson and Curcio1989; Garciá et al., Reference Garciá, Ruiz-Ederra, Hernández-Barbáchano and Vecino2005; Salinas-Navarro et al., Reference Salinas-Navarro, Mayor-Torroglosa, Jiménez-López, Avilés-Trigueros, Holmes, Lund, Villegas-Pérez and Vidal-Sanz2009).
There are two general foveal morphologies: shallow, with a wide base (concaviclivate) and deep, with a narrow base (convexiclivate) (Slonaker, Reference Slonaker1897; Walls, Reference Walls1942; Fite & Rosenfield-Wessels, Reference Fite and Rosenfield-Wessels1975). Primates and some bird retinas contain concaviclivate foveae [e.g., pigeons (Columba livia), northern blue jays (Cyanocitta cristata), and the ostrich (Struthio camelus)]. Certain species of raptor, lizards, and fish (including seahorse) have retinas containing convexiclivate foveae (Slonaker, Reference Slonaker1897; Walls, Reference Walls1942; Galifret, Reference Galifret1968; Fite & Lister, Reference Fite and Lister1981; Boire et al., Reference Boire, Dufour, Theoret and Ptito2001; Querubin et al., Reference Querubin, Lee, Provis and Bumsted O’Brien2009; Collin & Collin, Reference Collin and Collin1999; Mosk et al., Reference Mosk, Thomas, Hart, Partridge, Beazley and Shand2007). Convexiclivate foveae are funnel shaped with steep sides and a deep depression. A strong correlation has been reported between a convexiclivate fovea and predation, which involves the capture of moving prey (Fite & Rosenfield-Wessels, Reference Fite and Rosenfield-Wessels1975), such as in observed with seahorses. It has been proposed that the convexiclivate fovea mediates visual resolution by magnifying retinal images (Walls, Reference Walls1942), maintaining accurate fixation, and acting as a directional focus indicator (Harkness & Bennet-Clark, Reference Harkness and Bennet-Clark1978).
The purpose of this study was to morphologically characterize the fovea and to functionally evaluate visual resolution in two seahorse species that inhabit visually diverse environments. H. abdominalis resides and feeds in temperate waters, which tend to be more turbid compared with tropical waters where H. taeniopterus is found. Are their retinae specialized for their habitats? We compared the fovea and visual resolution of H. abdominalis and H. taeniopterus by mapping the topography of PRs and cells in the ganglion cell layer (GCL) in the retina, calculating the theoretical limit of vision, and then behaviorally testing visual resolution. Investigating the topographic density layout of cells in the seahorse retina and how this compares to their behavior is important for understanding how their visual system is specialized to hunt small prey in a wide range of environments.
Materials and methods
H. abdominalis (n = 14) and H. taeniopterus (n = 19) seahorses (Fig. 1A and 1B) were obtained from Seahorse Australia, Beauty Point, Tasmania. The seahorses used in the study were between 11.5 and 18 cm, a size when they were considered sexually mature. All tissues were obtained and experiments conducted under the approved ethical protocols from the Australian National University animal care committee.
A comparison of Hippocampus abdominalis (A) and H. taeniopterus (B) head morphology and eye size in situ. H. abdominalis (A) was lighter in coloration compared to the darkly pigmented H. taeniopterus (B). Note that the snout length is variable between species. Scale bar = 5 mm.

Reactive distance
The behavioral limit of visual resolution was determined by measuring the reactive distance (Wanzenbock & Schiemer, Reference Wanzenbock and Schiemer1989; Job & Bellwood, Reference Job and Bellwood1996) in mature seahorses (n = 3; H. abdominalis and n = 10; H. taeniopterus). The fish were housed in 9/15 h light/dark cycle. The behavioral experiments were conducted at the beginning and towards the end of the light cycle. Food was withheld from the fish for 24 h prior to the commencement of the experiment. Ten minutes prior to the onset of testing, an individual seahorse was transferred to an experimental saltwater tank and allowed to acclimatize. Acclimatization to the tank was judged to have occurred after a decrease in gill movements and swimming was observed. Three of the tank walls and the bottom were covered with white paper. The tank was illuminated by a warm white energy saving petite spiral fluorescent lamp [3100 l×; 240-V, 23-W (equivalent to 115-W) (Mirabella, Melbourne, Australia)] placed approximately 30 cm overhead. Video recordings were made from above and in front of the tank. Prior to the introduction of the prey (frozen mysid shrimp), preprey-capturing behavior was video recorded for 5 min. Frozen mysid shrimp of known sizes (6–12 mm) and high contrast (dark brown or red against white background) were dropped into the tank, and the feeding behavior of the seahorse was video recorded. From the video recordings, the reactive distance was determined by measuring the distance between the fish and the prey when the fish’s eye oriented and the fish began to swim towards the prey. Reactions to prey were determined accurately by a sudden change in eye orientation and swimming direction. The reactive distance was measured in 10 trials per fish and the average reactive distance calculated. In order to calculate the angle an object (the prey) subtended on the fish retina, the following formula was used: Visual angle in minutes of arc = 2·[arc tan (0.5·h/RD)], where h is prey size and RD was reactive distance (Wanzenbock & Schiemer, Reference Wanzenbock and Schiemer1989; Miller et al., Reference Miller, Crowder and Rice1993; Job & Bellwood, Reference Job and Bellwood1996).
Tissue collection
Seahorses were anesthetized with clove oil and then decapitated. The eyes were enucleated and immersion fixed in 4% paraformaldehyde in 0.1 m phosphate-buffered saline (1x PBS; pH 7.4) for 24 h to 6 months. After fixation, the cornea, lens, and vitreous were removed. For wholemounts, radial cuts were made at the retinal margin to relax the retina such that it would lie flat, and the retina pigment epithelium was bleached as previously described (Hemmi & Grunert, Reference Hemmi and Grunert1999; Bumsted O’Brien et al., Reference Bumsted O’Brien, Cheng, Jiang, Schulte, Swaroop and Hendrickson2004). After bleaching, the tissue was either immediately mounted on glass slides and coverslipped or further processed for nuclear staining or immunocytochemistry. For cryosections, the eyes were cryoprotected in 30% sucrose in PBS at 4°C overnight. The retina was then frozen at a known orientation in equal parts of 30% sucrose solution in 1x PBS and Optimal Cutting Temperature (Tissue Tek, Sakura, Japan) mounting medium. The tissue was serially sectioned at 16 μm in a cryostat (Leica, Wetzlar, Germany). Tissue was collected on gelatinized poly-l-lysine-coated Superfrost Plus (Esco, Biolab Scientific Ltd., Scoresby, Australia) microscope slides, incubated overnight at 37°C, and then stored in −20°C.
Histology and immunolabeling
Retinal sections through the fovea were stained with propidium iodide (PI; Sigma; diluted 1:500 in PBS, Castle Hill, Australia). Sections and wholemounts were immunolabeled with an antibody to rod opsin [RET-P1 (Barnstable, Reference Barnstable1980; Fekete & Barnstable, Reference Fekete and Barnstable1983); 1:200]. To block nonspecific bindings, tissue was preincubated in normal goat serum (Zymed Laboratories, South San Francisco, CA; 01-6101) diluted in 0.1% Triton X-100 in 1x PBS (1:10): sections for 1.5 h, while wholemounts were left for 2 days at 4°C. The cryosections were then incubated in the primary antibody overnight and wholemounts for 3–4 days at 4°C. After a thorough wash in 1x PBS, Alexa Fluor 488-conjugated goat antimouse (Molecular Probes Inc., Eugene, OR; A11029; 1:500) was applied for 3 h to sections and 2 days to wholemounts at room temperature and followed by 1x PBS washes to decrease background. Sections and wholemounts were coverslipped with Aqua Poly/Mount (Polysciences Inc.,Warrington, PA; 18606). Immunolabeled sections were examined using a confocal Laser Scanning Microscope (LSM 5; Carl Zeiss AG, Oberkochen, Germany).
Sampling in wholemounts and cell counts
Cell density in retinal wholemounts was determined following the method of Querubin et al. (Reference Querubin, Lee, Provis and Bumsted O’Brien2009). Briefly, for PR cell sampling, the retina was mounted PR side up on a glass slide and coverslipped with 80% glycerol. The retinal axes were marked on the glass coverslip. PR inner segments at the fovea and every 500 μm eccentric to the fovea were photographed using a Zeiss Axio Imager M1 microscope with differential interference optics. The number of PR inner segment profiles (both rods and cones) was counted in ten 10 × 10 μm sampling boxes in a 250 μm wide field. The average number of inner segment profiles per square millimeter was calculated.
To determine GC densities, retinas were stained with PI (diluted 1:500 in PBS) for 1 h at room temperature, followed by two 15 min PBS washes and mounted GCL upwards. The fovea was located by finding a small circular depression, approximately 1 mm ventrotemporal from the optic disc (OD). The retinal axes were marked on the glass coverslip. A Zeiss Axio Imager M1 with a LSM 5 Pascal unit (Carl Zeiss AG) using a 40× objective lens and a He–Ne laser (LASOS Lasertechnik GmbH, Jena, Germany) was used in conjunction with PASCAL software (Release Version 4.0; Carl Zeiss AG) to obtain a series of confocal Z-stack images. Z-stacks were taken in the fovea and at 500 μm intervals from the fovea. Each Z-stack spanned the complete thickness of the GCL. The Z-stack images were opened in Adobe Photoshop CS3 and compiled into layers. All the GC nuclei in at least fifty 10 × 10 μm sampling boxes in the Z-stack images were counted. By counting only the newly appearing cells on the overlapping layers, it was assured that no cell was omitted or counted twice. The average number of cells per square millimeter was calculated.
Sampling in sections and cell counts
Cell density measures were also performed in serial 16-μm frozen cross sections covering the entire retina (Querubin et al., Reference Querubin, Lee, Provis and Bumsted O’Brien2009). Starting at the ventral edge and ending at the dorsal edge, a series of sections approximately 320 μm apart was stained with PI solution (diluted 1:500 in PBS) for 3 min, followed by a 1 min PBS wash. Slides were coverslipped with Aqua Poly/Mount (Polysciences Inc.). In the central retina, the distance between sampled sections was decreased to approximately 160 μm to increase the amount of retina sampled. A Z-stack series of images centered on the GCL were taken at each sampling location using a confocal LSM 5. The Z-stack images were opened in Adobe Photoshop CS3 and compiled into layers. By counting only the newly appearing cells on the overlapping layers, it was assured that no cell was omitted or counted twice. Cell counts were quantified by importing the data into Image J and using the “analyze particles” plug-in. To obtain the number of cells in square millimeter, the cell counts were multiplied by a factor taking into account the thickness of the section, Z-stack height, and width of the sampling window.
Rod density calculation
Rod density was determined using the same method to calculate total PR density in wholemounts; however, instead of counting inner segment profiles, the number of RET-P1-labeled rod outer segments was counted. The average rod PR density was subtracted from the total PR cell density at each retinal location to give an estimated cone PR density.
Topographic map construction
Topographic maps of the density of cells in the GCL and density of PRs were drawn from densities derived from H. abdominalis (n = 4) and H. taeniopterus (n = 4) retinas. The length of each section was measured using a stage micrometer, drawn to scale, and the X-Y coordinates of each sampling location were plotted on the drawing in Adobe Illustrator CS3. For wholemounts, the image of flattened retina was taken using a dissecting microscope (Zeiss—SteREO Discovery V12), and the retinal shape was traced in Adobe Illustrator CS3. Using the stage micrometer, X-Y coordinates of retinal landmarks were determined, and each sampling location was plotted in the drawing. The calculated densities were added for each sampling point, and isodensity lines were drawn manually to connect regions of equivalent cell density.
Theoretical limit of seahorse visual resolution
Based on cone PR cell densities, the lens radius, and Matthiessen’s ratio, the anatomical limit of visual resolution of seahorse vision was determined (Neave, Reference Neave1984). The formula, sin α = c/f was used where α was the minimum separable angle measured in minutes of arc, c was the distance between the centers of adjacent cones, and f was the focal length of the lens. The cone density (d) was estimated in number of cells per 1 mm length of retina, and therefore, the reciprocal of d gave the cone separation in millimeter. The focal length of the lens was calculated using Matthiessen’s ratio, which states that the distance from center of the lens to the retina (posterior nodal distance, PND or the focal length of the lens) was 2.55 times the radius of the lens (r) (Matthiessen, Reference Stone1880). The theoretical limit of acuity would normally be calculated using the formula: sin α = 1/(d × 2.55r); however, tissue shrinkage was approximately 10%. In order to take this into consideration when calculating the theoretical limit of acuity, a factor of 1.11 is included in the equation: sin α = 1.11/(d × 2.55r); sin α = 0.43529/(dr).
The theoretical limit was also calculated based on the density of cells in the GCL (Collin & Pettigrew, Reference Collin and Pettigrew1989). The angle (α) subtending 1 mm on the retina was calculated by tan α = 1 mm/PND, and the spatial resolution was estimated by obtaining the number of cells subtended by 1 deg of visual arc, that is, cells per degree = cell density/PND. Since at least two GCs were needed to distinguish the light and dark boundaries forming one cycle of a grating of the highest resolvable frequency, the theoretical limit of visual resolution was calculated according to the equation: Cycles per degree (cpd) = cells per degree/2. In order to make a direct comparison between theoretical and behavioral limits of visual resolution, the unit cpd was converted to minutes of arc. First, the value in cells per degree was converted to cells per minute of arc by dividing the number by 60 because 1 deg is equal to 60 min of arc. Then, the value of cells per minute of arc was inversed, 1/cells per minute of arc, to obtain the value in minutes of arc.
Results
A comparison of H. abdominalis and H. taeniopterus showed that the eyes were similar in size, although the length of the snout varied between species (Fig. 1). Both species had an avascular retina (data not shown) with the fovea evident macroscopically as a small depression located 1 mm ventrotemporal to the optic nerve (circle; Fig. 2A and 2B). Sections through the retinal region containing the H. abdominalis and H. taeniopterus fovea showed the presence of a distinctive convexiclivate pit demarcated with steep sloping edges. In the center of the pit, the GCL, inner nuclear layer (INL), and outer nuclear layer (ONL) were thinner compared with the foveal slope and more peripheral retinal regions. The retinal layers on the foveal slope were the thickest in the retina (Fig. 2C and 2D).
The adult seahorse retina. Hippocampus abdominalis (Ha; A) and H. taeniopterus (Ht; B) flattened eyecup, in which the fovea (circle) was evident as a depression in the retinal surface temporal and slightly inferior to the OD. The fovea centralis in the H. abdominalis (C) and H. taeniopterus (D) was characterized by a convexiclivate pit, in which the retinal layers are thinned compared with the foveal slope. Rod PR outer segments labeled with a rod opsin antibody in a retinal flatmount (shown as white dots around the rod-free region outlined with a white line) were absent in the fovea, with the size of the rod-free region similar in H. abdominalis (E) and H. taeniopterus (F). Abbreviations: Dorsal (D), Temporal (T), ganglion cell layer (GCL), inner nuclear layer (INL), and outer nuclear layer (ONL). Scale bars for A–B = 1 mm, C–D = 100 μm, and E–F = 500 μm.

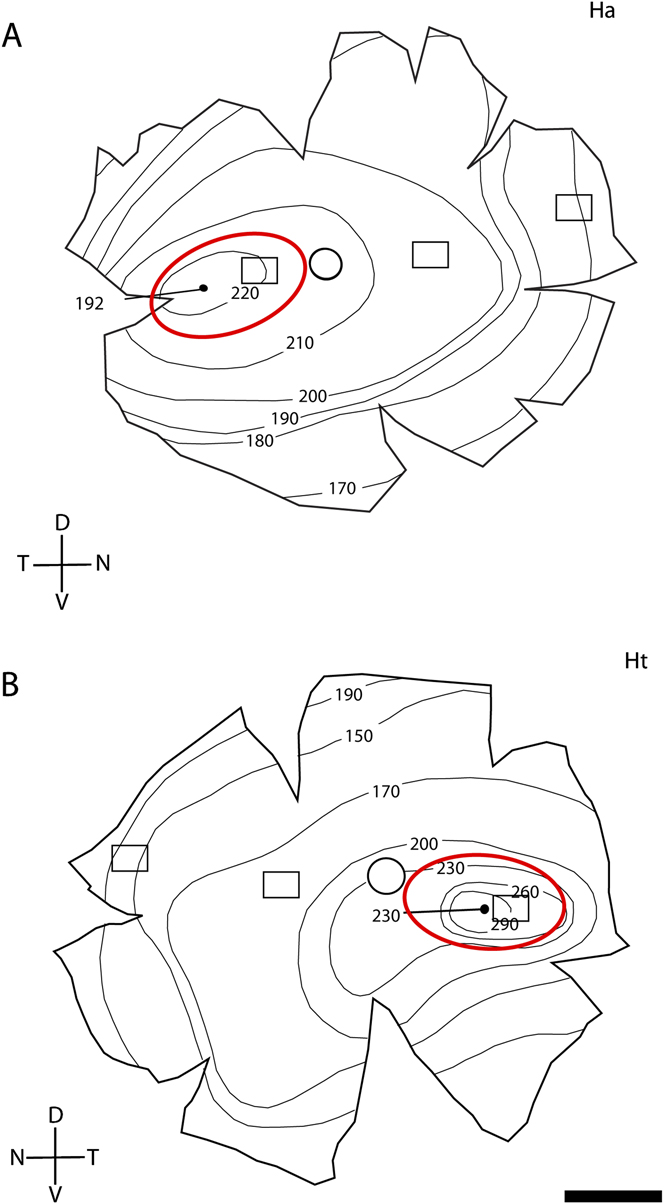
Rod PRs were observed as a segregated dense band of nuclei vitreal to the cones (data not shown). No rod nuclei or rod opsin immunoreactivity were detected in the fovea (Fig. 2C–2F). The rod-free regions in H. abdominalis and H. taeniopterus were similar in size and were approximately twice the size of the morphologically defined convexiclivate pit. The rod-free zone was roughly circular (outlined in white), with a slight skewing along the horizontal meridian (Fig. 2E and 2F; Fig. 3A and 3B).
Topographic maps of the total PR densities across the Hippocampus abdominalis (A) and H. taeniopterus (B) retinae. The numbers must be multiplied by 1000 to obtain cell density (cells/square millimeter). The fovea within rod-free zone (red circle) is indicated by a black dot. The OD is indicated by the open black circle. Boxed regions indicate the sampling area used to generate the graph of PR density in Fig. 4. Abbreviations: Dorsal (D), Ventral (V), Nasal (N), Temporal (T), H. abdominalis (Ha), and H. taeniopterus (Ht). Scale bars = 1 mm.

PR density
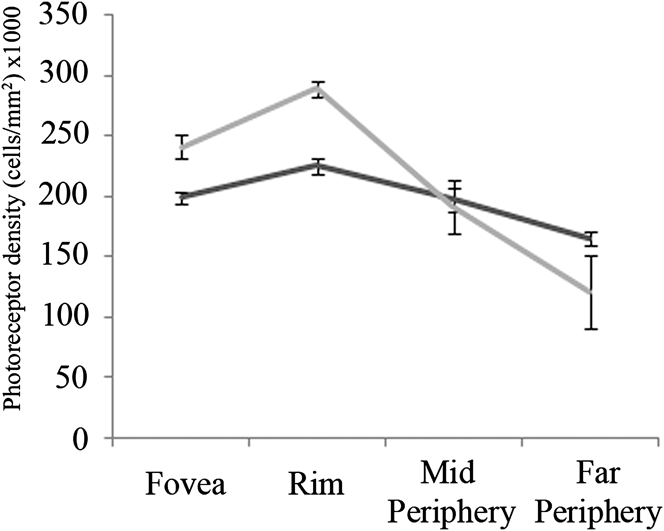
Changes in the topography of PR cell density were mapped in H. abdominalis and H. taeniopterus retina (Fig. 3A and 3B). A representative map for each species demonstrated that there was a region of elevated PR cell density around the fovea. In general, the overall pattern for the density of PRs was similar between species. PR densities reached a peak of 225,500 ± 6856 cells/mm2 in H. abdominalis and 289,250 ± 6185 cells/mm2 in H. taeniopterus on the foveal slope with a slight density decrease in the center of the pit (199,000 ± 4830 and 241,500 ± 9147 cells/mm2, respectively). Outside the fovea, cell density gradually declined to 165,409 ± 5040 and 120,500 ± 30,260 cells/mm2 in the far periphery (Fig. 3A and 3B). Near the retinal edge, PR cell density increased slightly in the H. taeniopterus retina (Fig. 3B). Despite the similarities in overall pattern, H. taeniopterus retinas showed a statistically higher density of cones on the foveal slope (Fig. 4). In the mid periphery, the PR density appeared similar in both species. In the far periphery, the density was higher in H. abdominalis.
PR cell density along the horizontal meridian from the fovea to the far periphery in Hippocampus abdominalis (n = 4; dark line) and H. taeniopterus (n = 3; gray line) retinae. The mean densities of PRs ± s.d. are plotted.

On the dorsal edge of the rod-free area in both species, rods comprised 17% of the PRs. The density of rods slowly increased towards the periphery. Nasal to the optic nerve, rods comprised 30% of the toal PR density, with further density increases to 45% in the mid periphery and 55% of the total PR density in the far periphery. When the contribution of rods was taken into account in peripheral retina and subtracted from the total PR density, the cone densities rapidly decreased compared to those observed in the central retina.
GC density
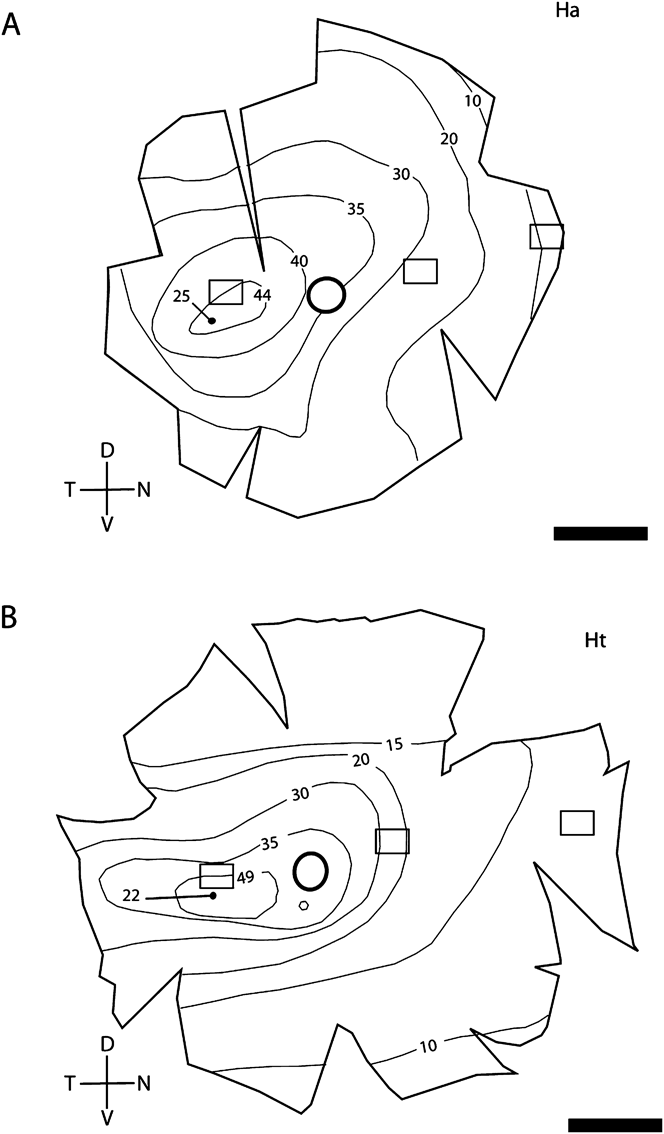
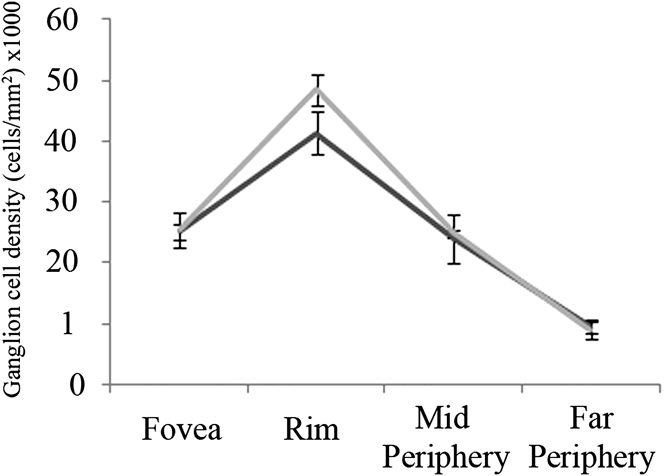
Topographic maps of the density of cells in the GCL (Fig. 5A and 5B) showed that the highest density of cells in the GCL was located along the foveal slope (41,327 ± 3457 cells/mm2, H. abdominalis and 48,500 ± 2517 cells/mm2, H. taeniopterus). Within the foveal pit, the density of cells in the GCL declined to 25,215 ± 1279 and 25,500 ± 2887 cells/mm2, respectively. Outside the fovea, the density of cells in the GCL decreased gradually to 9554 ± 973 and 9000 ± 1414 cells/mm2 in the peripheral retina of each species. Although there was some individual variation, the overall pattern of the density of cells in the GCL was similar between retinal samples and species; however, the peak density of cells in the GCL obtained at the foveal slope in the H. taeniopterus retina was significantly higher compared with that of H. abdominalis (Fig. 6).
Topographic maps showing the GC densities across the Hippocampus abdominalis (A) and H. taeniopterus (B) retinae. The numbers must be multiplied by 1000 to obtain cell density (cells/square millimeter). The fovea is indicated by a black dot and the OD by an open black circle. Boxed regions indicate the sampling area used to generate a graph of GC density shown in Fig. 6. Abbreviations: Dorsal (D), Ventral (V), Nasal (N), Temporal (T), H. abdominalis (Ha), and H. taeniopterus (Ht). Scale bars for A–B= 1 mm.

GC density along the horizontal meridian from the fovea to the far periphery in Hippocampus abdominalis (n = 4; dark line) and H. taeniopterus (n = 3; gray line) retinae. The mean densities of GCs ± s.d. are plotted.

The ratio of PRs to cells in the GCL across the retina, as a measure of convergence in the retinal circuitry, indicated that H. abdominalis had a lower convergence ratio in the fovea (7.9 PRs for every GC; 7.9:1) and along the foveal slope (5.5:1) compared with H. taeniopterus (9.5:1 and 6.0:1, respectively). The differences between species for both ratios were not statistically significant. Outside the fovea where rods start to appear, H. taeniopterus had lower convergence ratio in the mid periphery (7.7:1) and far periphery (13.4:1), compared with H. abdominalis (8.2:1 and 17.3:1, respectively). It was only with the ratio at the far periphery that the difference was considered to be statistically significant (P = 0.0112).
Theoretical limit of visual performance
For H. abdominalis, based on an average lens radius of 0.6 mm and the PR density (199,000 cells/mm2 in the fovea and 225,500 cells/mm2 on the foveal slope), the calculated theoretical limit of visual resolution in the adult seahorse H. abdominalis was 5.59 ± 0.07 min of arc in the fovea and 5.25 ± 0.08 min of arc on the foveal slope. For H. taeniopterus, the lens radius was 0.6 mm. The PR densities were 241,500 cells/mm2 in the fovea and 289,250 cells/mm2 in the foveal slope. The calculated limits of visual acuity were 5.08 ± 0.10 and 4.64 ± 0.05 min of arc, respectively. The theoretical limit of visual resolution in H. taeniopterus was significantly lower compared to that of H. abdominalis on the foveal slope (P < 0.0001). This suggested that the tropical species, H. taeniopterus had a better theoretically estimated visual resolution and was able to resolve smaller prey at the same distance compared with H. abdominalis.
Using a formula which takes into account the densities of cells on the GCL (25,215 cells/mm2 in the fovea and 41,327 cells/mm2 on the foveal slope), the spatial resolution of H. abdominalis was calculated to be 4.79 ± 0.12 cells per degree in the fovea and 6.12 ± 0.26 cells per degree on the foveal slope. Hence, the calculated theoretical limit of visual resolution was 2.39 ± 0.06 cpd in the fovea and 3.06 ± 0.13 cpd on the foveal slope or 12.54 ± 0.32 min of arc in the fovea and 9.81 ± 0.43 min of arc in the foveal slope (Table 1). For H. taeniopterus, the foveal density of cells on the GCL was 25,500 cells/mm2. The calculated spatial resolution (4.81 ± 0.27 cells per degree) and theoretical limit of visual resolution (2.40 ± 0.14 cpd or 12.51 ± 0.72 min of arc) were similar to that of H. abdominalis. The higher density of the cells in the GCL on the foveal slope (48,500 cells/mm2) resulted in a higher spatial resolution on the foveal slope (6.64 ± 0.17 cells per degree), which leads to a higher theoretical limit of visual resolution (3.32 ± 0.09 cpd or 9.04 ± 0.24 min of arc). The difference in the theoretical limits of H. taeniopterus estimated at the foveal slope was considered to be statistically significant compared with that in H. abdominalis (P value = 0.0214; Table 1).
Theoretical limits of visual resolution calculated based on GC densities

Behavioral limit of visual resolution
The sizes of the prey were variable, which lead to variable reactive distances. In general, a larger prey resulted in a longer reactive distance. The visual angle measured behaviorally in minutes of arc was greater with H. abdominalis (1090.64 ± 70.44 min of arc) compared with H. taeniopterus (692.86 ± 198.36 min of arc) under the same experimental conditions. This indicated that H. taeniopterus was able to detect smaller prey. Behaviorally, H. taeniopterus had a statistically better visual resolution compared with H. abdominalis (P = 0.0068). Compared with the theoretical limit of visual resolution calculated from the PR cell or cells in the GCL densities, both fish perform more poorly than predicted; however, it was consistent that H. taeniopterus had lower theoretical and behavioral limits of acuity, which translates to a greater degree of visual resolution compared with H. abdominalis.
Discussion
This is the first report of the topographic distribution of PRs and GCs across the H. abdominalis and H. taeniopterus retina, which also includes a comparison of the theoretical limit of visual resolution with the feeding behavior of the seahorse. Our data showed that both species possess a distinct rod-free convexiclivate fovea centralis in the ventrotemporal retina. PR cell densities were highest at the foveal slope with lower densities within the foveal center. Beyond the foveal slopes, cell density gradually decreased towards the periphery. The density of cells in the GCL varied in accordance with the PR densities. Overall, H. taeniopterus had a higher density peak of PR and cells in the GCL on the foveal slope compared with H. abdominalis. The theoretical limit of acuity suggested that H. taeniopterus was able to detect statistically smaller targets compared to H. abdominalis. The behavioral measurement of visual resolution, reactive distance, was consistent with the theoretical estimation of visual resolution in that H. taeniopterus was able to detect smaller prey at the same distance.
Foveal morphology
Seahorses belong to the family Syngnathidae, which means “jaw fused.” Within this family, there are 55 genera including more than 320 species. The family Syngnathidae can be divided into four subfamilies based on their shared features; Syngnathinae (pipefishes), Hippocampinae (seahorses and pygmy pipefishes), Solegnathinae (seadragons and pipehorses), and Doryrhamphinae (free swimming pipefishes). Some immediately related taxa of the seahorse include the pipefishes, which share some retinal characteristics (Collin & Collin, Reference Collin and Collin1999; Kuiter, Reference Kuiter2003). All the members of the Syngnathidae family that have been studied contain a foveal specialization in their retina, except H. kuda (Easter, Reference Easter1992).
The presence of a fovea in the teleost retina was first reported by Slonaker (Reference Slonaker1897), but it was not until 1942 that Walls reported the presence of a fovea centralis in the seahorse retina. The current study is in agreement with Walls (Reference Walls1942) who described the seahorse fovea as a convexiclivate structure; however, we observed that the fovea was located in the ventrotemporal retina rather than the central retina as described previously. The temporal location of fovea centralis has been observed in a variety of teleosts with laterally displaced eyes such as the pipefish, Corythoichthyes paxtoni (Collin & Collin, Reference Collin and Collin1999). It has been postulated that the temporal fovea mediates increased spatial resolving power in the binocular regions of the visual field. The temporal location of the seahorse fovea may also be essential in binocular depth judgment, especially when capturing prey.
Many other fish species have been shown to possess a fovea, although the morphologies are variable. Collin and Collin (Reference Collin and Collin1999) classified the teleost fovea into four distinct types based on their morphology citing differences in depth, degree of inner retinal neuron displacement, and presence of radial fibers in the fovea. According to this classification, both the H. abdominalis and H. taeniopterus foveae are categorized as Type I, similar to the previously described fovea of the pipefish (C. paxtoni), deep-snouted pipefish (Syngnathus typhle), the bass (Paralabrax nebulifer), and the barred sand perch (Parapercis nebulosis) (Schwassmann, Reference Schwassmann1968; Easter, Reference Easter1992; Collin & Collin, Reference Collin and Collin1999). Type I foveae are characterized by a deep convexiclivate retinal depression without the lateral displacement of the inner retinal layers, the exclusion of rods, and an increase in PR and GC densities (Collin & Collin, Reference Collin and Collin1999).
Easter (Reference Easter1992) reported that a tropical species of seahorse H. kuda did not possess a fovea centralis; instead, the retina contained an area centralis. Our personal observations were in agreement that the H. kuda does not have a fovea but rather has a rod-free area centralis with the increased retinal thickness at the corresponding region in the ventrotemporal retina (unpublished data). The fovea of H. abdominalis and H. taeniopterus, however, are distinctly convexiclivate, lack rod PRs, and possess increased PR and GC densities, similar to other syngnathids. At least two other species of seahorse, H. subelongatus and H. barouri, have been reported to possess a foveate retina (Mosk et al., Reference Mosk, Thomas, Hart, Partridge, Beazley and Shand2007). Our analysis of two additional species of seahorse (H. abdominalis and H. taeniopterus) indicated that the presence of a fovea centralis is the norm rather than the exception in seahorses.
Although the functions of a convexiclivate fovea still remain to be explained further, it is possible that seahorses use their fovea as an image magnifier to promote high resolution and provide a mechanism for maintaining accurate fixation by increasing sensitivity to small angular movements due to distortion of the retinal image (Walls, Reference Walls1942; Pumphrey, Reference Pumphrey1948; Harkness & Bennet-Clark, Reference Harkness and Bennet-Clark1978). The idea that the convexiclivate fovea is useful for detecting motion is consistent with our behavioral data. Although due to the experimental conditions, the most common prey capture event occurred with stationary prey, we observed that both species of seahorses were able to detect mobile prey more rapidly and at a greater distance with higher sensitivity (data not shown). Our data strongly suggest that unlike in primates where motion detection and visual acuity are processed in different visual pathways (Merigan & Maunsell, Reference Merigan and Maunsell1993), the seahorse visual system is attuned to movement detection as opposed to acuity.
Topographic variation in PR and GC density and visual acuity
Both the H. abdominalis and H. taeniopterus retinae have a rod-free region that extends beyond the fovea centralis. The function of the rod-free zone in fish is not completely clear. Because visual acuity is usually measured in photopic conditions when the rods are less active, their contribution to acuity is likely minimal. It is possible that without the rods, cones are able to pack together at higher density as is the case with the Type I fovea of the pipefish C. paxtoni (Collin & Collin, Reference Collin and Collin1999). Cone PRs within the foveal region form a square mosaic with a probable role in the perception of movement of small approaching prey in conjunction with high visual acuity provided by an increased PR cell density. The cone PRs function best in photopic conditions and again their very presence would support that the seahorse is specialized for perceiving finer detail.
A common feature in foveate retinae is the topographical variation in cell density across the retina, with the highest densities of both PRs and GCs located in the foveal region. In teleosts, cone PRs are added at the retinal margin during growth, whereas new rods are generated throughout the retina and integrated into the existing retinal circuitry, which results in the maintenance of rod density. This may induce a differential distribution pattern of rod PR topography to that of total PRs (Fernald, Reference Fernald1985). Our results on the rod PR densities at various locations in the retina support this differential distribution pattern. The density values increase gradually from the margin of rod-free region towards the far nasal periphery, which is the opposite pattern to the topography of total PRs.
It is also interesting to note the reversed pattern of the PR cell density in the far periphery, where H. abdominalis has higher density compared with H. taeniopterus retina. A possible explanation for this increased PR cell density in the far peripheral retina of H. taeniopterus is that these size-matched seahorses from each species are at different developmental stages even at mature ages. The fish eye grows in size throughout the lifetime by stretching and the generation of new cells at the far peripheral margin (Fernald, Reference Fernald1985).
In order to estimate GC density, all cells in the GCL were counted. The GCL is often composed of other cell types including the glial cells and displaced amacrine cells; therefore, GC densities obtained in this study may be inflated. The degree of amacrine cell displacement varies across species. For example, 49% in elasmobranch (Collin, Reference Collin1988) and 24% in three species of reef fish (Collin & Pettigrew, Reference Collin and Pettigrew1988) of the cells in the GCL were amacrine cells. The influence of overestimated density calculations would be an increased visual acuity estimated from the lower convergence ratio between cone PRs and GCs. Mack et al. (Reference Mack, Sussmann, Hirt and Wagner2004) postulated changes in the proportion of displaced amacrine cells in GCL as the fish mature. They have concluded that the displaced amacrine cells are eliminated from the GCL in the more central retina during growth of the eye. Although we have not counted the number of displaced amacrine cells in the GCL of the adult seahorse retinas in this study, the inflation of GC counts may be smaller in the central retina compared to the periphery if displaced amacrine cells decrease with age.
Visual resolution: theoretical versus behavioral
Various studies investigating the acuity of teleost fish have concluded that the behavioral estimate of acuity is poorer than the theoretical estimate of acuity, as determined from retinal cell densities (Miller et al., Reference Miller, Crowder and Rice1993; Pankhurst et al., Reference Pankhurst, Pankhurst and Montgomery1993). The theoretical limit calculated in the current study is based on the quantitative morphological data such as PR or GC densities. The theoretical limit signifies the maximum limit of visual acuity, which can be achieved at the cellular level in the retina. On the other hand, the behavioral limit of visual resolution was obtained experimentally; therefore, the resulting behavior includes other factors influencing visual processing including neural processing in the brain. Browman et al. (Reference Browman, Gordon, Evans and O’Brien1990) reported that behavioral measures of visual acuity are likely to yield a more accurate estimate of an animal’s visual abilities.
Different kinds of acuity assessments have variable sensitivities, which means that a comparison to the theoretical limit is an important factor in analyzing visual function (Dobson & Teller, Reference Dobson and Teller1978; Hodos et al., Reference Hodos, Ghim, Potocki, Fields and Storm2002). For the theoretical limit calculation, we have used a formula, which takes into account the intercone spacing and lens radius and hence focal length of the lens. To obtain the focal length of the lens, the average Matthiessen’s ratio (2.55) was used (Browman et al., Reference Browman, Gordon, Evans and O’Brien1990). It has been shown that the ratios could vary within the range of 2.4–2.82 depending on the variety of fish species (Pankhurst et al., Reference Pankhurst, Pankhurst and Montgomery1993).
It has been suggested that the behavioral limit of visual detection in teleosts is set by the convergence ratios of cones to higher processing cells such as GCs, the resolving power of the lens, and the accommodative state of the eye. Is it the intercone spacing or the density of the GCs that is the limiting factor for visual acuity (Fernald, Reference Fernald, Atema, Fay, Popper and Tavolga1988)? Collin and Pettigrew (Reference Collin and Pettigrew1989) proposed that the spatial distribution of the retinal GCs places an upper limit on the spatial resolving power, and therefore, the least separable visual angle approximates the angle subtended by one GC. In other words, the spatial resolving power of the eye needs to be calculated from the inter-GC distances in area of highest GC density. In this region, there is a low convergence ratio of cones to a GC, and because each GC possesses a separate conductive axon to higher brain centers via the optic nerve, the retinal GC mosaic provides the only link between the eye and behavioral output (Collin & Pettigrew, Reference Collin and Pettigrew1989).
Why are the theoretical and behavioral limits of visual resolution higher in the tropical species, H. taeniopterus? Morphologically, their retina and, especially, the fovea bear a resemblance to each other, except that the cell densities are higher in H. taeniopterus. Considering that visual acuity can be limited by the spatial resolution of PR packing density and the types of connections made to GCs via bipolar cells, the observed increase in cell density, PR cell density in particular, in the foveal region is thought to subserve higher visual acuity. A low convergence ratio between GCs and PRs ensures an increased sampling of light information for direct transmission of information centrally. Although convergence ratios are only an indirect indication of the circuitry responsible for high acuity and other visual functions, they have been widely applied for this purpose (Boycott & Wassle, Reference Boycott and Wassle1999). In the far periphery, H. taeniopterus had lower convergence ratios compared with H. abdominalis. We did not take into account the resolving power of the lens from each species.
Influence of habitat
The light conditions in their natural habitats are quite different as H. abdominalis is a temperate fish, whereas H. taeniopterus is a tropical fish. In nature, seahorses are found in a diverse range of aquatic environments with differing light intensities and spectral radiance distributions from “blue water” coral reefs and “green water” coastal habitats (Foster & Vincent, Reference Foster and Vincent2004; Mosk et al., Reference Mosk, Thomas, Hart, Partridge, Beazley and Shand2007). Cone PR pigment properties could be different in these two species of seahorse. Mosk et al. (Reference Mosk, Thomas, Hart, Partridge, Beazley and Shand2007) have measured the spectral absorption characteristics of visual pigments in the retinal PRs using microspectrophotometry technique. They reported that a tropical seahorse H. barbouri has greater transmission of short wavelengths of light and an additional short wavelength specific pigment present, allowing an extended spectral range available for vision. Sensitivity to shorter wavelengths in the shallow coral reef habitat is beneficial to this species compared to temperate seahorse, H. subelongatus. It may be possible that the increased visual resolution enhances the ability of H. taeniopterus to capture prey in the blue water of the tropical environment.
Conclusions
The syngnathids are a group of fishes that feed on small crustaceans, with individual prey items detected and tracked visually prior to capture (Bergert & Wainright, Reference Bergert and Wainright1997). The presence of a convexiclivate fovea is an advantage for capturing prey in many species, which inhabit a wide variety of environments.
Acknowledgments
The authors thank Rachelle Hawkins of Seahorse Australia for her assistance with these experiments. We are very grateful to Drs. Jan Hemmi and Ulrike Siebeck for valuable discussions concerning the seahorse retina and to Dr. Jan Hemmi and Angeliza Querubin for critical reading of the manuscript. This work was supported by the Australian Research Council (ARC) Centres of Excellence program based at The Australian National University in Canberra. H.R.L. is supported by ARC Centre of Excellence in Vision Science and an Australian National University PhD scholarship.