1. Introduction
This paper examines the portfolio allocation policies of U.S. state and local government pension funds. It presents a dynamic model of public pension fund investment choice and analyzes how risk-taking behavior may vary with the pension plan's characteristics. Risk is measured by the volatility of a fund's asset portfolio rate of return relative to the rate of return on the market value of its liabilities. The model's implications are examined using annual data on 125 state pension funds over the period from 2000 to 2009.
The asset allocation choice of a public pension fund is critical to understanding the problem of public pension plan underfunding. A public pension fund's annual investment return is typically much larger in magnitude than its annual employer and employee contributions (Munnell and Soto, Reference Munnell and Soto2007). Furthermore, the fund's portfolio allocation across broad asset classes is the major determinant of its investment return (Brinson et al., Reference Brinson, Hood and Beebower1986, Reference Brinson, Singer and Beebower1991). Thus, portfolio allocation policy has first-order consequences for funding status.
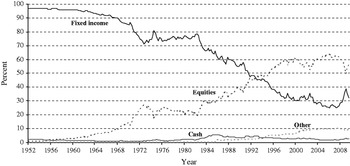
Public pension fund asset allocation also is of interest because, in aggregate, it has changed drastically over time. Figure 1 shows that state and local government pension funds invested almost entirely in cash and fixed income during the 1950s, but gradually increased their allocations to equities and, more recently, to other investments (including real estate, private equity, and hedge funds).
Portfolio allocations of state and local government pension funds.

A benchmark policy for assessing a pension fund's investment choice is a portfolio allocation that best hedges or ‘immunizes’ the risk of its liabilities. The value of a pension fund's liabilities equals the value of the retirement annuities that it is obligated to pay its employees and retirees. These retirement annuities typically are linked to a worker's wages and years of service, and most often payments are partially indexed to inflation. Hence, the value of pension liabilities is exposed to risks from real or nominal interest rate changes and also changes in wage rates. A satisfactory analysis of portfolio choice must account for these risks.
Portfolio allocations that deviate from the benchmark portfolio that best immunizes liabilities introduce what we refer to as ‘tracking error.’ This paper considers how different pension fund objectives influence the choice of tracking error volatility and how this volatility might be influenced by the pension plan's funding ratio, past returns, and other plan characteristics. Our study is perhaps the first to examine the overall asset–liability risks of a time series – cross-section sample of public pension funds. We use data on state and local government wages and various investment classes to compute a single measure of tracking error volatility for each pension fund during each year.
The plan of the paper is as follows. Section 2 briefly discusses related theoretical and empirical work on the portfolio allocations of public pension funds. Our model is presented in Section 3. Section 4 describes our data and variable construction, while Section 5 presents the empirical results. Concluding comments are in Section 6.
2. Related literature on public pension fund portfolio allocation
The focus of this paper is a public pension fund's portfolio allocation relative to a benchmark portfolio that best hedges (immunizes) the fund's liability risks. To evaluate liability risk, one must first determine a method for valuing pension liabilities since they are not marketable securities. There is disagreement on how this should be done, with the major conflict between the actuarial approach of the Government Accounting Standards Board (GASB) and the market value approach based on finance theory. The GASB actuarial approach discounts a pension plan's future retirement payments using the expected rate of return on the pension plan's assets, rather than a discount rate appropriate to the actual risk of the pension plan's retirement payments.
As pointed out in many papers, most recently by Brown and Wilcox (Reference Brown and Wilcox2009), Lucas and Zeldes (Reference Lucas and Zeldes2009), and Novy-Marx and Rauh (Reference Novy-Marx and Rauh2009), valuation using the GASB actuarial standard is inconsistent with basic financial theory and leads to moral hazard incentives in the form of ‘accounting arbitrage’: a pension plan has the incentive to invest in assets with high systematic risk in order to justify a higher discount rate that will reduce the actuarial valuation of its liabilities. Thus, we take it as a settled question that a financial theory-based market valuation approach more accurately reflects the risk of pension liabilities.
A more subtle issue is whether the market value measure should be the pension fund's Accumulated Benefit Obligation (ABO) or Projected Benefit Obligation (PBO). Typically, the annual annuity payment paid by a public pension plan to a participant is the product of the participant's final average salary over the last 1–5 years, years of credited service, and a benefit multiplier of 1–2.5%. The ABO is the present value of these payments based on current years of service and the current average salary, whereas the PBO is the present value based on current years of service and an estimated future average salary just prior to retirement. Thus, for hedging liability risk when the public pension plan is likely to be a continuing concern, the PBO better incorporates future risks. Therefore, we employ it to value our benchmark immunizing portfolio.Footnote 1 The effect of using PBO is to include future wage uncertainty as a component of overall liability risk.
Black (Reference Black1989) recommends that if a pension fund manager takes a narrow view by hedging the ABO measure of pension liabilities, the pension portfolio should invest almost exclusively in duration-matching bonds. If a broader PBO view is taken, then he recommends some allocation to stocks under the assumptions that stock returns are positively correlated with wage growth. Peskin (Reference Peskin, Mitchell and Hustead2001) supports this view and finds that a 20–90% allocation to equities could be optimal depending on the characteristics of a particular public pension fund.
Lucas and Zeldes (Reference Lucas and Zeldes2009) come to a similar conclusion from a model where a municipality wishes to minimize tax distortions and pension liabilities are positively correlated with stocks. Their model predicts that pension funds should invest more in stocks if their liabilities are more wage sensitive, which should be the case if a pension fund has a relatively high ratio of currently employed pension participants to pension plan retirees. However, they find no empirical evidence for this prediction.
3. A public pension fund model
Since a public pension fund's portfolio choice will be derived from its objective function, we begin by considering possible normative and positive objectives of a public pension fund.
3.1. The public pension fund's investment objective
As will be discussed, academics and practitioners often propose different investment objectives for a public pension plan. However, if one takes a broad Ricardian (Ricardo, Reference Ricardo1820)/Modigliani–Miller (Modigliani and Miller, Reference Modigliani and Miller1958) perspective, a municipal pension fund's objective may be irrelevant. As discussed in Bader and Gold (Reference Bader and Gold2007), arguments along the lines of Barro (Reference Barro1974) imply that any balance sheet (including pension fund) decision made by a municipal government could be offset by the savings and portfolio decisions of rational private agents. If private individuals and firms recognize the future tax consequences of a government's (dis-) savings and portfolio decisions, those public decisions could be over-turned by private portfolio decisions.
However, as summarized in Elmendorf and Mankiw (Reference Elmendorf, Mankiw, Taylor and Woodford1999), the conditions that enable private individuals to fully neutralize government savings and portfolio decisions are unlikely to hold in practice. Heterogeneity among individuals, borrowing constraints, tax distortions, and imperfect information regarding government policies imply that public pension policies very likely effect the net tax burdens by individuals and, therefore, have real welfare consequences.
Due to such frictions, Peskin (Reference Peskin, Mitchell and Hustead2001) argues that the risk that a pension fund's returns fail to match its liabilities imposes intergenerational transfers because future generations are not compensated for the taxes they will pay to cover current pension underfunding. Intergenerational equity is likely to be improved if unfunded pension costs are covered by current, rather than future, generations of taxpayers. Unlike the federal government, municipalities have more limited means to cope with underfunding: they cannot inflate away the value of their liabilities via money creation. Thus, unlike the federal social security program that operates on a pay-as-you-go basis, municipalities may want a funded pension plan to avoid unsustainable fiscal imbalances. Peng (Reference Peng2009) believes this is why almost all state and local pension plans are pre-funded.
Even if pension fund deficits are covered by an immediate rise in taxes paid by the current generation of taxpayers, risk-aversion and intra-generational equity motivate a desire to hedge pension liabilities. Not only might a pension fund's objective be to fund the present value of pension obligations as they accrue, but also to reduce the uncertainty that investment returns fail to match the change in the present value of obligations due to changing market conditions. A fully funded pension plan whose investments immunize its liabilities fits this ideal of minimizing tax uncertainty.Footnote 2
We find this argument compelling, with one caveat. It is unlikely that a municipality's other expenditures for non-pension benefits are fully matched by contemporaneous tax revenues at each point in time. During economic downturns, tax revenues (excluding pension contributions) typically fail to cover non-pension expenditures. If the municipality wished to hedge the net tax surplus of its aggregate balance sheet, pension investments might be chosen so that their returns outperform those of pension liabilities during economic recessions and under-perform them during economic expansions. An implication is that pension plans would optimally choose short positions in procyclical risky assets, such as equities.
In practice, municipal governments typically do not incorporate pension fund investment decisions within a single framework for managing their overall balance sheets. Rather, they delegate the administration of a public pension plan to a Board of Trustees who may be appointed or may be elected by plan participants. The Board's scope tends to focus narrowly on the pension plan. Typically, the Board sets objectives in the form of allocation guidelines in various asset classes, such as fixed income, equities, and alternative investments. A supporting staff headed by an executive director may implement these objectives and/or delegate them to external money managers whose performance is measured against market benchmarks or peers having similar investment styles.
Peng (Reference Peng2009) notes that asset allocation objectives typically are chosen to meet a numerical goal for ex-post investment returns, rather than a desire to hedge the risk of liabilities. Asset class portfolio weights often are chosen based on mean-variance portfolio efficiency with little regard to the risk of pension liabilities. Consequently, pension funds usually are exposed to significant risk from changes in the market value of their liabilities.
Why might public pension fund investment objectives have minimal connection to liability risk? A potential explanation is that archaic GASB accounting clouds the true market valuation of pension liabilities. Lacking a market value measure of liabilities to benchmark the market value of pension assets may discourage hedging. Moreover, opaque accounting of pension liabilities might affect how the performance of management is measured. Rather than, or in addition to, being judged on how the pension fund's investments hedge the market risk of its liabilities, the pension Board and staff's performance may be gauged against the investment performance of similar public pension funds. Peskin (Reference Peskin, Mitchell and Hustead2001) describes such a peer group benchmark as belonging to the ‘traditional’ approach to public pension investment management. Park (Reference Park2009) argues that such a peer group benchmark is a result of career concerns by the plan's Board of Trustees and staff and is reinforced by ‘prudent person’ fiduciary standards.
3.2. Public pension fund portfolio choice
Given the previous discussion, we begin with a normative model that assumes a pension fund's objective is to maximize the utility of a representative taxpayer. We later consider an agency model where the fund's objective is to maximize the utility of the pension plan's management.
The model is similar to Chen and Pennacchi (Reference Chen and Pennacchi2009), and details regarding its derivation can be found in that paper. Let the initial date be 0, and let the end of the pension fund's performance horizon be date T. The interval from date 0 to T might be interpreted as the municipality's fiscal year or a longer period over which pension over- or under-funding has tax consequences and thereby affects the wealth of the municipality's residents. Since our focus is on portfolio allocation given an initial level of funding, we assume that contributions by the pension plan's government employer and its employees are made just prior to date 0, as are any cash outflows to pay retirement benefits. Thus, from date 0 to date T, the only changes in the values of pension assets and liabilities are derived from their market rates of return.
During the interval from dates 0 to T, the pension fund's benchmark, which for now is assumed to be its liabilities, Lt, satisfies
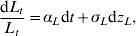
where dz L is a Brownian motion process. The Appendix in Pennacchi and Rastad (Reference Pennacchi and Rastad2010) shows how this rate of return process can be derived from the value of individual employees' projected benefits and retirees' annuities. The process depends on risks from changes in wages and changes in the value of nominal or, in the case of Cost of Living Adjustments (COLAs), inflation-indexed (real) bonds.
We assume that the pension fund can invest in a portfolio of securities that perfectly match (immunize) the above rate of return on liabilities.Footnote 3 It can also invest in n ‘alternative’ securities, where security i's rate of return satisfies

and dzi, i=1, …, n are other correlated Brownian motions such that σLdzLσidzi=σiLdt. The σi, σL, and σiL are assumed to be constants. αi and αL may be time varying, as would be the case with stochastic interest rates, but their spread, αi–αL, is assumed constant.
For the model applications that we consider, the pension fund's optimal investments in the n alternative securities are characterized by constant relative proportions, so that the pension fund's portfolio choice problem simplifies to one of choosing between the liability immunizing portfolio and a single alternative portfolio invested in the alternative securities with constant portfolio weights δi, i=1, …, n.Footnote 4 If we let At be the date t value of this alternative securities portfolio, then its rate of return is
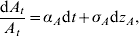
where  ,
 , and
 .
If at date t the pension fund allocates a portfolio proportion 1−ωt to the immunizing portfolio and a proportion ωt to this alternative securities portfolio, then the value of the pension fund's asset portfolio, Vt, satisfies

Whenever ωt≠0, the fund's return in equation (4) deviates from the liability immunizing portfolio's return. Now define Gt≡Vt/Lt to be the pension fund's date t funding ratio; that is, value of the fund's assets relative to that of its liabilities. At date 0, G 0=V 0/L 0 but then evolves over the interval from date 0 to date T as:

Future over-(under-)funding at date T is assumed to accrue to (be paid by) the municipality's taxpayers, which in aggregate equals VT−LT. Assuming the population of representative taxpaying individuals at date T is proportional to the value of date T liabilities, the representative taxpayer's after tax wealth date T is

where W tp is the taxpayer's date t personal before-tax wealth and λ>0 is the ratio of pension liabilities per taxpayer. The larger is λ, the more sensitive is the taxpayer's wealth to the pension plan's funding status. If taxpayers' utilities display constant relative risk aversion with coefficient (1−γ)>0, and pension investment policy has the objective of maximizing their utility, then the pension fund's asset allocation problem is

subject to equation (5).
Consider the case where the taxpayer can invest her before-tax wealth, W tp, in the same securities available to the pension fund so that it satisfies
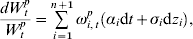
where αn+1≡αL, σn+1≡σL, dz n+1≡dzL, and ωi,tp is the taxpayer's portfolio weight in security i at t. Since from equation (6) after-tax wealth is linear in WTp and GT, in a Modigliani–Miller world a given pension fund allocation, wt, determining the process for Gt in (5) could be offset (perfectly hedged) by the taxpayer via her appropriate choice of personal portfolio weights ωi,tp in equation (8). In this case, the pension fund's portfolio choice, ωt, becomes irrelevant.
However, as discussed earlier it is unrealistic that at each point in time a taxpayer is aware of the pension funds' investments, liabilities, and, in turn, the extent to which she will need to contribute via future taxation to the fund. Poor pension accounting standards together with a lack of information means that the representative taxpayer is likely unaware of the risk faced by the pension funding ratio, Gt.
Consequently, the pension fund's portfolio choice could expose the taxpayer to unhedged risk that reduces her utility below that of a full information environment. In this more realistic setting, a strong case could be made that the pension fund should be managed to eliminate its tracking error risk so that wt=0 and dGt=0∀t∊[0,T]. If so, GT=G 0 and the taxpayer can choose her personal portfolio weights, ωi,tp, to maximize (7) with no uncertainty regarding the tax to be paid at T. Moreover, if the pension fund was fully funded at date 0, then GT=G 0=1 and the taxpayer faces no obligation at date T.
Might there be circumstances where pension funding risk could benefit taxpayers? If a significant portion of taxpayers lack access to risky investments, pension tracking error risk could afford them this exposure. Empirical evidence shows that individuals' holdings of risky investments such as stocks has risen over time, but significant proportions of the population continue to hold almost all of their financial assets in risk-free investments such as bank deposits.Footnote 5 If these risk-free investments are not chosen willingly but are due to high costs of accessing risky assets, exposure to pension funding risk could potentially raise utility by generating risk premia for taxpayers.
If we consider this case where WTp is risk-free, equal to a constant  , then the pension fund's utility maximizing proportion invested in the alternative security portfolio for any date t∊[0,T] is
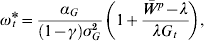
where αG≡αA−αL+σL2−σAL and σG2≡σA2−2σAL+σL2. Equation (9) says that when the risk premium αG is positive (negative), the pension fund takes a long (short) position in the alternative securities.Footnote 6 This deviating position is tempered by the relative volatility of the alternative securities, σG, and the taxpayer's relative risk aversion, (1−γ).
Equation (9) indicates that the pension fund should change its allocation in the alternative securities as its funding level, Gt, changes:

This derivative is negative whenever  is positive, so that when total taxpayer wealth unrelated to pension funding is larger than total pension liabilities, declines in Gt raise
 . This occurs because with constant relative risk aversion, the individual's utility is maximized when she holds constant fractions of her wealth in risk-free and risky assets. When pension funding, and therefore after-tax wealth, rises, the pension fund optimally lowers its allocation to the risky alternative securities to maintain a constant share in risk-free assets.
Based on our earlier discussion, the model results for this case come with several caveats. First, the representative taxpayer faces taxation risk not just from the municipality's pension under-funding but from other deficits/surpluses that may arise from the government's other activities. Recognizing these other sources of tax uncertainty in the individual's wealth in equation (6) could motivate the pension fund to hedge those risks. Second, the analysis ignores federal personal income taxes. Bader and Gold (Reference Bader and Gold2007) show that to minimize federal income taxes, it is preferable for the pension fund to invest in high-taxed bonds and for individuals to hold lower-taxed risky assets, such as equities, in their personal portfolios when possible.
Third, when the pension fund ends with a surplus (GT>1), it may not accrue to the taxpayer. Political pressure leads to a sharing of the surplus with public employees in the form of a reduction in employee contributions or an increase in pension benefits.Footnote 7 Thus, it may be illusory to believe that taxpayers benefit by receiving the risk premia generated by pension investments.
These caveats cast doubt on an ‘activist’ public pension fund investment strategy designed to provide risk premia on behalf of investment-constrained taxpayers. Rather, these qualifications favor an optimal investment policy that passively follows the liability immunizing strategy where ωt=0∀t. Such a strategy would be transparent to taxpayers, allowing many of them to focus on their individual portfolios. It also avoids generating surpluses that taxpayers would be forced to share with employees. In addition, since this passive policy entails primarily fixed-income investments, it delivers federal tax savings.
Shifting from a normative to a positive theory of public pension investment behavior, note that the practice of delegating pension fund management could lead to agency problems where the Board of Trustees and staff maximize their own utility of wealth rather than that of a representative taxpayer. Since stated objectives guiding pension plan investments often downplay the risk of pension liabilities, the Board and staff may be judged against an alternative benchmark such as the investment performance of peer pension plans. In this light, the wealth in equation (6) can be re-interpreted as that of the pension fund management where the process followed by the benchmark Lt in (1) may be the average rate of return earned by other public pension funds. If explicit or implicit (career concern) compensation is performance related, the pension Board and staff's wealth will be linked to future relative performance, GT=VT/LT, measured as the pension plan's funding ratio or its investment performance relative to its peers.
Assuming that the fund managers' wealth unrelated their pension performance is invested mainly in risk-free assets and is sufficiently large ( ), the solution for optimal portfolio choice continues to satisfy equations (9) and (10): pension fund managers will increase the fund's tracking error risk as their relative performance declines. If their wealth that is unrelated to performance is low (
 ), the pension fund's management will decrease its tracking error risk as its performance declines.
The next section examines the empirical evidence related to our model based on a time series and cross section of state pension plans. We investigate how a state pension plan's choice of tracking error volatility relates to its characteristics, including the plan's funding ratio, its performance relative to its peers, its governance, and participants.
4. Data and variable construction
Our data on state pension funds comes from two sources. The first is Wilshire Associates who generously provided us with an annual time series of investment information on 125 state pension funds over the 2000–2009 period.Footnote 8 These data include each fund's actuarial values of liabilities and actuarial and market values of assets for each of the 10 years. For each year, it also gives every fund's proportions of assets allocated to eight categories: U.S. equities, non-U.S. equities, U.S. fixed income, non-U.S. fixed income, real estate, private equity, hedge funds, and others. In addition, it includes each fund's assumed rate for discounting liabilities and the total payroll for active participants in the pension fund.
The second data source comes from the Boston College Center for Retirement Research (CRR). This is publicly available data on 112 state pension funds for the year 2006.Footnote 9 It provides individual pension fund characteristics on governance, the type of plan participants (general employees, teachers, or police and firefighters), and numbers of active members and annuitants.
Comparing the state pension funds in the Wilshire data to those in the CRR data led to 97 matches. We selected from the CRR the following variables: the ratio of a pension fund's Board members who are plan participants to the total Board members of the pension fund; a dummy variable equaling 1 if the pension fund had a separate investment council (zero otherwise); and a dummy variable equaling 1 if the contribution rate of the pension fund sponsor was statutorily set (zero otherwise).
As previously mentioned, our measure of a pension fund's overall asset–liability risk-taking is its tracking error volatility. To translate a given pension fund's asset-class allocations for a given year into this risk measure, we collected for the period January 1997 to April 2010 monthly time series of asset returns in order to estimate a covariance matrix of returns for seven different asset classes.Footnote 10 The following asset return series were chosen: U.S. equities – Vanguard Total Stock Market Index Institutional Fund; Non-U.S. equities – Vanguard Total International Stock Index Fund; U.S. fixed income – Vanguard Total Bond Market Index Institutional Fund; Non-U.S. fixed income – Barclays Capital Global Majors, Ex. U.S., Fixed-Income Index; Real estate – Wilshire U.S. REIT Index; Hedge funds – Morningstar MSCI Composite Hedge Fund Returns; and Private equity – Cambridge Associates U.S. Private Equity Returns.Footnote 11 In addition, while not an asset class specified in the Wilshire data, a part of our analysis of tracking error volatility will use a Treasury Inflation-Protected Securities (TIPS) return series, which we proxied by the Vanguard Inflation-Protected Securities Institutional Fund.
Data on wage growth and returns on nominal and real (inflation-indexed) bonds were used to estimate the variances of market returns on pension fund liabilities as well as these returns' covariances with the different asset classes. Wages were proxied by the Bureau of Labor Statistics quarterly Employment Cost Index for State and Local Government Workers. For bonds, a monthly time series of 15-year maturity, zero-coupon bond returns were constructed for nominal Treasuries and Treasury Inflation-Protected Securities (TIPS) using the data of Gürkaynak et al. (Reference Gürkaynak, Sack and Wright2007, Reference Gürkaynak, Sack and Wright2008).Footnote 12 Nominal and real bonds having a 15-year maturity were chosen because several sources indicate that the typical pension fund's liabilities have a duration of that length.Footnote 13
In our model, tracking error volatility was represented by the quantity  , which is mathematically equivalent to the square root of the variance of the difference in the rates of return on pension assets (Vt) and pension liabilities (Lt): σV2+σL2−2ρVLσVσL. We estimated the variance of a pension fund's assets in a given year as
 , where Ω is the estimated covariance matrix of returns for the seven asset classes and ω is the 7×1 vector of the fund's portfolio weights (allocations) in these seven asset classes.
As shown in the appendix of Pennacchi and Rastad (Reference Pennacchi and Rastad2010), pension liabilities under a PBO measure are composed of wage and bond risk, where the bond risk is either nominal or real (in the case of COLA benefits). Thus, the standard deviation of pension liabilities, σL, can be computed from the estimated standard deviations of wage growth (σLw) and nominal or real bond returns σLp as well as their correlation ρwp: σL2=σLW2+σLP2+2ρWPσLWσLP. We calculated this pension liability standard deviation, σL, assuming that liabilities were either purely nominal or purely real liabilities. As detailed in this appendix, we also adjusted the standard deviations of wage growth and bond risk (duration) using the fund's ratio of active (employed) to total plan participants (including retirees). These adjustments led to the funds' liabilities reflecting different sensitivities to wage risk and different durations ranging from 6 to 20 years.
Because in practice pension funds may not view their liabilities as a benchmark but may benchmark their performance to peer public pension funds, we created an additional tracking error volatility measure where, instead of the liability volatilities just discussed, we set  , where ωa is a 7×1 vector of portfolio allocations that are the averages across the 125 state funds for a particular year.
The last step in constructing tracking error volatility calculates the covariance between a fund's chosen assets and the selected liability/peer performance for a particular year: ρVLσVσL. The final measure of tracking error volatility is the square root of σV2+σL2−2ρVLσVσL.
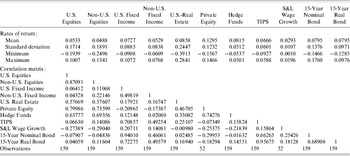
Table 1 gives summary statistics for different asset class rates of return, as well as state and local employee wage growth and returns on 15-year zero-coupon nominal and real bonds. It is the annualized standard deviations and correlations from this table, which were calculated over the 1997–2010 period that we use to construct tracking error volatilities. Of particular interest is the estimated correlation of −0.27 between state and local wage growth and U.S. equity returns. Prior research, including Black (Reference Black1989), Cardinale (Reference Cardinale2003), and Lucas and Zeldes (Reference Lucas and Zeldes2006, Reference Lucas and Zeldes2009) advocate pension fund investments in equities as a way to hedge wage uncertainty under the presumption that equities and wages are positively correlated.
Summary statistics of asset returns and wage growth

Note: Summary statistics for rates of return on eight different asset categories: U.S. Equities; Non-U.S. Equities; U.S. Fixed Income; Non-U.S. Fixed Income; U.S. Real Estate; Private Equity; Hedge Funds; and Treasury Inflation-Protected Securities (TIPS), as well as State and Local Employee Cost Index wage growth and 15-Year Nominal and Real (TIPS) Bond returns. State and local employee wage growth and private equity returns are calculated based on quarterly data from the second quarter of 1997 to the first quarter of 2010. All other statistics are calculated from monthly return data between February 1997 and April 2010. Means and standard deviations are annualized. Minimums and maximums for wage growth and private equity are one-quarter rates while minimums and maximums for the other series are one-month rates.
A potential criticism of our negative wage–equity correlation estimate is that it is calculated over a quarterly holding period. Recommendations for using stocks to hedge wage growth assume that their correlation is positive over a longer holding period. Models by Lucas and Zeldes (Reference Lucas and Zeldes2006), Benzoni et al. (Reference Benzoni, Collin-Dufresne and Goldstein2007), and Geanakoplos and Zeldes (Reference Geanakoplos, Zeldes and Lucas2010) show that wage growth and stock returns can have zero short-run correlation but, due mean reversion, a correlation that approaches 1 over long horizons.Footnote 14
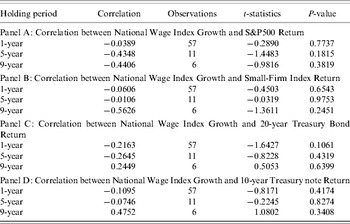
As a check, we calculated wage–equity correlations, as well as wage–bond correlations, over longer holding periods. Because the BLS state and local wage index only starts in 1981, we use the BLS national wage index that starts in 1952. Equity returns are for the S&P 500 index or a small stock index and bond returns are those for 10-year or 20-year maturity Treasury bonds.Footnote 15
Table 2 presents estimated wage–asset return correlations for holding periods from 1 year to 9 years. Panel A indicates little evidence of a positive correlation between wages and large firm stock returns, and the correlation point estimates trend more negative as the holding period increases. Panel B shows the same qualitative correlations hold for small firm stock returns. This pattern of correlations is consistent with Jermann (Reference Jermann1999) who estimates wage–stock correlations over the 1929–1996 period, finding correlation point estimates that are negative at horizons from 7 to 17 years before turning positive. Since a typical pension fund's duration of liabilities is about 15 years, stocks may not be the best hedge of wage risk.
Correlations of equity and bond returns with national wage growth, 1952–2008

Note: National Wage Index is taken from the U.S. Bureau of Labor Statistics. The returns on the S&P 500 Index, the 10-year Treasury note and the 20-year Treasury Bond were obtained from the Center for Research in Security Prices (CRSP).
Another asset class, possibly bonds, might be a better hedge. Panels C and D of Table 2 find a correlation between wage growth and bond returns whose point estimates becomes more positive as the holding period increases. Although none of the correlation estimates in Table 2 are statistically significant, the evidence does not justify large equity investments for hedging wage risk at horizons relevant to a typical pension fund.
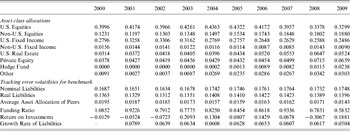
Along with asset return and wage growth standard deviations and correlations, the final input in constructing tracking error volatilities is each pension fund's asset allocations for each year. Table 3 gives summary statistics of these allocations and the resulting tracking error volatilities calculated for different benchmarks. Average volatilities are lower when the benchmark is real liabilities compared to nominal liabilities. Unsurprisingly, with a benchmark equal to the average of funds' allocations, average tracking error volatilities are the least.
Time series of average asset allocations, tracking error volatilities, and funding ratio

Note: Sample average over 125 state pension plans for eight different asset allocations, various tracking error volatilities, funding ratios (market value of assets divided by actuarial value of liabilities), and return on investments. The returns on investments were estimated as the product of their asset-class allocation weights and the returns earned by each of the asset classes.
Table 3 also includes yearly averages for two variables that our model predicts may influence tracking error volatility: the plan's funding ratio and its investment return. The funding ratio is measured as the market value of assets divided by the actuarial value of liabilities. The plan's investment return in a given year is estimated as the product of its asset-class allocation weights and the returns earned by each asset class. The average funding ratio of these 125 state pension plans was highest at 109% during 2000 prior to the technology stock decline and was at a minimum of 58% during 2009, largely due to an estimated 30% investment loss in 2008.
5. Empirical evidence
5.1. Tracking error minimizing allocations and alternative portfolio allocations
As a prelude to examining how funds' tracking error volatilities vary with their plan characteristics, we first estimate the asset allocations that would minimize the typical fund's tracking error volatility. We also present estimates of allocations for the ‘alternative’ security portfolio modeled in equation (9). These allocations are for a plan having 15-year duration liabilities and a sensitivity to wages reflecting a ratio of active participants to total participants of 66.57%, which is our sample average. Calculating allocations for both portfolios employ the estimated covariance matrix for the asset classes' returns as well as these returns' covariances with wages and the 15-year maturity bonds. To calculate the alternative portfolio allocations also requires estimates of the assets' expected returns which are taken from Table 1.Footnote 16
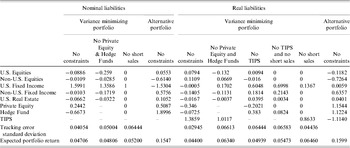
Table 4 gives the portfolio allocations that best hedge (immunize) this typical pension fund's liabilities.Footnote 17 Columns 1, 2, and 3 show results when the pension fund's liabilities are purely nominal, having no COLAs. In column 1, the unconstrained allocation that minimizes tracking error volatility calls for a 9% short position in U.S. equities, a 160% allocation to U.S. fixed income, a 24% allocation to private equity, and a 67% short position in hedge funds. The huge allocation to U.S. fixed income is partly explained by our assumption that the pension funds' fixed-income investments are of lower duration (lower interest rate sensitivity) than the 15-year duration of the pension funds' nominal liabilities.Footnote 18 These allocations imply that the fund should borrow via short positions in other asset categories in order to increase its U.S. fixed-income investment, thereby raising its asset interest sensitivity. If, instead, the pension fund's U.S. fixed-income portfolio was assumed to take the form of 15-year zero-coupon bonds, then its tracking error minimizing allocation would be approximately 100%, rather than 160%, in U.S. fixed income.Footnote 19
Tracking error minimizing allocations and alternative portfolio allocations

Note: The entries are the pension asset portfolio weights that minimize a typical pension fund's tracking error volatility.
This typical fund's liabilities have a 15-year duration and a ratio of active to total participants of 66.6%.
Because a short position in hedge fund investments is infeasible and a large allocation to private equity may be unrealistic, column 2 of Table 4 shows the volatility minimizing allocation without private equity or hedge fund investments. There the allocation to fixed income becomes 136%, with a 13% short position in U.S. equities and a 17% short position in non-U.S. fixed income. Column 3 reports immunizing allocations when short sales are not permitted. Interestingly, the allocation is 100% in fixed income.
Columns 5 to 9 of Table 4 assume that the pension fund's liabilities are fully inflation indexed, real liabilities. Given the widespread presence of COLAs in state and local pension benefits, this case may be most realistic. Although the Wilshire data do not specifically identify funds' allocation to inflation-indexed bonds (they would likely be included in U.S. fixed income), we consider allocations with and without including TIPS. When TIPS are included, column 5 shows that the immunizing allocation is 139% in TIPS with a large short position in private equity. If, as in column 6, private equity and hedge fund investments are disallowed, the TIPS allocation becomes 101%. Column 7 reports allocations when TIPS are excluded. The allocation to U.S. fixed income becomes 60% and the allocation to non-U.S. fixed income is a large 18%. Moreover, the allocation to hedge funds switches signs, to a large 38% allocation financed with a 20% short position in private equity.
In column 8, the allocation that excludes TIPS and short sales calls for U.S. and foreign fixed-income allocations of 70% and 21%, respectively, with an 8% allocation to hedge funds. The sizable position in foreign fixed income makes sense since it should hedge U.S. inflation if exchange rates adjust with purchasing power parity. Column 9 permits investments in TIPS but no short positions. The result is a simple 86% allocation to TIPS and a 14% allocation to U.S. fixed income.
Columns 4 and 10 of Table 4 give the ‘alternative security’ portfolio allocations corresponding to the multivariate analog of the quantity αG/σG2 in equation (9).Footnote 20 Unlike the tracking error minimizing portfolio, the alternative security portfolio depends on the asset classes' expected returns that are difficult to estimate accurately (Merton, Reference Merton1980). Hence, these estimated alternative portfolio weights should be interpreted cautiously. Column 4 shows that when the pension fund wishes to generate risk premia on behalf of the representative taxpayer and liabilities are nominal, the pension fund will start from its tracking error minimizing portfolio in column (1) and move in the direction of eliminating its long position in U.S. fixed income, short foreign equities, and investing primarily in hedge funds, non-U.S. fixed income, private equity. Equation (9) indicates the extent of this deviation from the immunizing portfolio will be inversely related to risk aversion and pension funding.
When liabilities are real, column (10) indicates that generating risk premia leads the pension fund to undo its large TIPS position shown in column (5) and, similar to the nominal liability case, short foreign equities, and allocate more to private equity, hedge funds, and foreign fixed income. Note from the last row in Table 4 that such a deviation generates an excess return of approximately 0.160–0.044=11.6%.
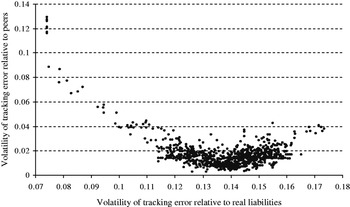
Finally, note from the second to last row of Table 4, the minimum tracking error volatilities for both nominal and real liabilities are much lower than the average tracking error volatilities estimated in Table 3 for our sample of state pension funds. Figure 2 explores this point further by plotting the sample distribution of tracking error volatilities. It graphs, for each fund during each year, the volatility of tracking error relative to the fund's real liabilities (horizontal axis) versus the fund's volatility of tracking error relative to its peers (vertical axis). The distribution appears skewed, with only a few pension funds (primarily those with very high allocations to U.S. fixed income) choosing allocations that immunize real liabilities. The vast majority of pension funds' allocations result in peer tracking error volatilities below 4%, indicating a tendency to herd far from an immunizing portfolio.
Distribution of tracking error volatilities.

5.2. Tracking error volatility and plan characteristics
Let us now investigate the relationship between a fund's characteristics and its choice of tracking error volatility based on the following linear regression model:

where σTE,i,t is the tracking error volatility of fund i in year t. Under the normative view that the pension fund should maximize the utility of a representative taxpayer, our model predicts different relationships between tracking error and pension funding under different assumptions. As discussed earlier, if the representative taxpayer is able to invest in the same asset classes available to the pension fund, utility is maximized if the fund simply minimizes tracking error volatility, implying no relationship between tracking error volatility and the plan's funding ratio (β1=0). Alternatively, if the representative taxpayer has access only to risk-free investments, utility maximization could imply that tracking error declines with the plan's funding ratio (β1<0).
Under the positive theory that the pension fund is managed to maximize the utility of wealth of the pension Board and staff, and their benchmark for compensation includes the ‘traditional’ one of return performance relative to the fund's peers, then tracking error volatility may vary with the fund's past investment return. In particular, if the personal wealth of the pension Board and staff is primarily in risk-free investments whose value is large relative to their management compensation ( ), then tracking error risk should be high following a poor relative return (β2<0). Conversely, if the compensation of the Board and staff is large relative to their personal wealth (
 ) or, as may seem reasonable, their personal wealth is invested in primarily risky assets, then they may optimally lower tracking error risk following a poor relative return (β2>0).
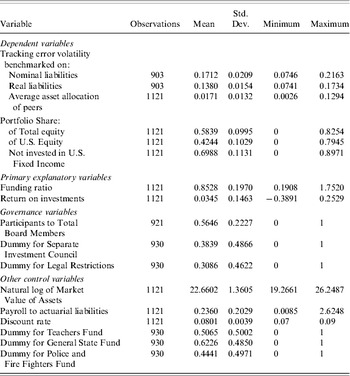
The regression includes additional explanatory variables listed in Table 5. These include governance-related variables, controls related to the type of participants, and other characteristics such as a proxy for fund size (the natural log of the market value of pension assets), the ratio of payroll to pension liabilities, and the rate chosen by the fund to discount its liabilities. We include the fund's chosen discount rate, not because it is an exogenous variable, but to explore whether tracking error risk is linked to a possible motive to under-report liabilities via a higher discount rate.
Regression variable summary statistics

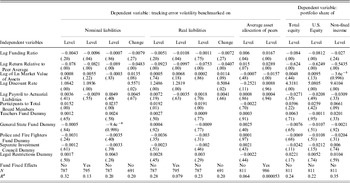
Table 6 reports results of equation (11). Each regression specification controls for time (year) fixed-effects. In columns 1, 3, 5, 7, and 9, the regressions include time-invariant fund characteristics from the CRR dataset, and so our observations drop to 97 pension plans per year. In columns 2, 6, and 10 we exclude the CRR data but control for fund fixed effects, in which case the observations equal 125 pension plans per year. Columns 4 and 8 run regressions of equation (11) in first differences (annual changes) for all the variables.
Regression results

Note: Numbers in parenthesis are P-values. Each regression includes time (year) fixed effects. In columns (1) to (4) tracking error volatility is constructed assuming that pension liabilities are in nominal terms, while in columns (5) to (8) tracking error volatility is constructed assuming pension liabilities are fully inflation-indexed real liabilities. For the regressions in columns (4) and (8), all variables are in annual changes, rather than levels. In columns (9) and (10) tracking error volatility is constructed assuming a benchmark equal to the average sample asset allocation of peer public pension funds.
The results in Table 6 differ little when the dependent variable, tracking error volatility, is based on a nominal or real pension liability benchmark. As shown in columns 1 to 8, three explanatory variables are always statistically significant: the prior year's investment return relative to peers; the fund's chosen rate used to discount liabilities; and the proportion of members of the Board of Trustees who are participants. In addition, columns 2 and 6 indicate that the prior year's funding ratio is significant when the larger 125 plan sample, estimated with fund fixed effects, is used. Notably, prior returns and the discount rate remain significant when the regressions are in changes.
The negative coefficients on the fund's prior-year return and its funding ratio might be interpreted as risk-shifting behavior counter to a policy of pure immunization but consistent with a policy that generates risk premia for taxpayers as in equation (9). However, the positive relationship between a fund's chosen rate to discount liabilities and its tracking error volatility indicates possible moral hazard on the part of pension fund management.Footnote 21 According to GASB standards, funds with higher tracking error volatility may justify a higher discount rate because they are investing in assets with higher systematic (priced) risks. Or, it may be that a fund is motivated to select a higher discount rate to understate its liabilities and fictitiously increase its net worth, thereby justifying greater tracking error risk. Since the direction of causality is unclear and the chosen discount rate may be endogenous, regressions reported in columns 3 and 7 exclude it. Doing so does not qualitatively change the results.
The finding that a fund takes more tracking error risk when it has greater participant representation on its Board of Trustees might be explained in a couple of ways. If pension participants are less financially literate than typical Board members, they may be less able to select asset allocations that immunize the plan's liabilities. Alternatively, participants may intentionally take more tracking error risk to increase the likelihood of a significant pension surplus that will accrue to them in the form of increased benefits or lower employee contribution rates.
Columns 9 and 10 report regression results where the benchmark is the average investment allocation by peer pension plans. The estimated coefficients tend to be qualitatively different from the previous regressions where a liability benchmark was used. The positive and statistically significant coefficients on the plan's prior-year funding ratio and prior investment return indicate that pension funds deviate more from their peers following better performance. Such behavior would be consistent with the positive theory that the pension fund Board and staff maximize their own utility and their compensation is large relative to their personal wealth or their personal wealth is invested in primarily risky assets.
The finding that better-performing pension funds increase their tracking error relative to the average allocation of other funds is not inconsistent with the previous regression results. Figure 2 shows that peer and liability benchmarks are quite different, and so when better-performing funds deviate more from their peers they move closer to an immunizing portfolio. In other words, a poorly performing pension fund reduces the hedging of its liabilities and gambles by choosing a riskier portfolio more typical of its peers.
To explore whether our results are sensitive to using tracking error as a measure of a fund's deviation from an immunization benchmark, we consider three other dependent variables that proxy for deviations from a fixed-income immunization strategy. These are a fund's allocation to: equities, U.S. equities, or all asset classes except for fixed income. The results using these alternative dependent variables are shown in columns 11 to 13 of Table 6. Compared to using tracking error benchmarked on nominal or real liabilities, the qualitative results are unchanged.
6. Conclusion
This paper introduced a model of public pension fund asset allocation that can be a normative guide for choosing pension investments or a positive theory of pension managerial behavior. It concludes that hedging risk from changes in the market value of the pension fund's liabilities is likely to be the socially optimal policy. However, career concerns of pension fund managers may conflict with this objective. Our empirical results seem consistent with such managerial agency behavior. We find that a public pension fund's Board of Trustees and staff tend to allocate assets based on the performance of peer pension funds rather than with the aim of immunizing the plan's liabilities.
Our empirical analysis of 125 state pension plans over the 2000–2009 period finds that a fund tends to take more asset–liability ‘tracking error’ risk following declines in its relative performance. Tracking error volatility also is higher for pension funds that select a high rate with which to discount their liabilities and pension funds that have a greater proportion of participants on their Boards of Trustees.
The portfolio choices of public pension plans that deviate substantially from the liability immunizing strategies may be encouraged by opaque and misleading accounting standards that are divorced from finance theory. Such standards may lead public plans to follow their ‘traditional’ investment strategies of choosing investments with little regard to their true liability risks. The pension fund asset–liability mismatches resulting from these strategies pose a potential burden to taxpayers that will be realized then economic conditions decline and when losses are most difficult to bear.
 is always positive.
 ,where Ω is the 7×7 covariance matrix of asset returns and Ψ is a 7×2 vector of covariances between the asset returns and pension liabilities (wage and nominal or real bond), 1 is a 7×1 vector of ones, and
 .