I. INTRODUCTION
Thermoelectric silicide materials have received renewed attention during the past decade owing to their potential applications in the field of renewable and sustainable energy technology. Magnesium silicide (Mg2Si),Reference Oto, Iida, Sakamoto, Miyahara, Natsui, Nishio, Kogo, Hirayama and Takanashi1–Reference Morris, Redin and Danielson3 which is a narrow-gap n-type semiconductor, is a promising candidate for mid-temperature (500–800 K) thermoelectric applications; it is therefore expected to be suitable in waste-heat recovery systems for vehicular applications. Mg2Si also exhibits advantageous properties: it is nontoxic, lightweight, cheap, and composed of elements abundantly available in the Earth's crust. Although these potential advantages are favorable for practical applications, it is necessary to further improve the thermoelectric-conversion efficiency for thermoelectric applications.
Impurity doping is a well-established method for improving the thermoelectric performance of Mg2Si, and it has been extensively researched. However, it is time-consuming and sometimes impractical to experimentally elucidate the detailed effects of doping on the structure, electronic and transport properties, and thermoelectric performance of a material. Therefore, theoretical approaches to this problem are considered both beneficial and powerful tools for obtaining a fundamental understanding of the doping effect. Such research can provide theoretical guidelines to further develop for realizing optimized thermoelectric performance.
Mg2Si synthesized without intentional doping is known to exhibit n-type conductivity.Reference Akasaka, Iida, Nemoto, Soga, Sato, Makino, Fukano and Takanashi4 Theoretical studies have revealed that intrinsic n-type doping occurs because Mg-related defects exhibit donor-like behavior.Reference Kato, Yagi and Fukusako5,Reference Jund, Viennois, Colinet, Hug, F`evre and T´edenac6 In addition, n-type dopants (e.g., Sb,Reference Oto, Iida, Sakamoto, Miyahara, Natsui, Nishio, Kogo, Hirayama and Takanashi1 Al,Reference Sakamoto, Iida, Matsumoto, Honda, Nemoto, Sato, Nakajima, Taguchi and Takanashi7 Bi,Reference Sakamoto, Iida, Matsumoto, Honda, Nemoto, Sato, Nakajima, Taguchi and Takanashi7 and SnReference Zaitsev, Fedorov, Gurieva, Eremin, Konstantinov, Samunin and Vedernikov8) are generally used for doping Mg2Si. On the other hand, despite many efforts to find suitable dopants to achieve p-type conductivity, there are few impurities for the synthesis of p-type Mg2Si-based materials. For example, several experimental studies have reported that doping Mg2Si with AgReference Sakamoto, Iida, Matsumoto, Honda, Nemoto, Sato, Nakajima, Taguchi and Takanashi7,Reference Mars, Ihou-Mouko, Pont, Tobola and Scherrer9 or GaReference Ihou-Moukoa, Mercier, Tobola, Pont and Scherrer10 results in p-type conductivity, but the doped Mg2Si shows poorer thermoelectric efficiency than typical n-type-doped Mg2Si materials. If p-type Mg2Si with greater stability and thermoelectric efficiency could be achieved through impurity doping, it would significantly contribute to the manufacture of thermoelectric power-generator modules. For example, it could be applied to the pi-type thermoelectric module, which consists of both n- and p-type semiconductors.
In the present study, we focus on both types of doping in Mg2Si and investigate the structural and thermoelectric properties of systems doped with Al and Sb as n-type dopants and Na and B as p-type dopants. The former two elements are known n-type dopants for this material,Reference Oto, Iida, Sakamoto, Miyahara, Natsui, Nishio, Kogo, Hirayama and Takanashi1,Reference Sakamoto, Iida, Matsumoto, Honda, Nemoto, Sato, Nakajima, Taguchi and Takanashi7 while the feasibility of obtaining p-type Mg2Si through doping with the latter two elements was assessed in our previous work.Reference Hirayama, Iida, Funashima, Morioka, Sakamoto, Nishio, Kogo, Takanashi and Hamada11 Thus far, many theoretical and numerical studiesReference Zwolenski, Tobola and Kaprzyk12–Reference Zwolenski, Tobola and Kaprzyk17 have been performed to achieve a fundamental understanding of the effects of doping on Mg2Si crystals. In particular, comprehensive works on the crystal stability and electronic structure of pure Mg2Si and impurity-doped systems for extensive dopant substitutionals have been presented.Reference Zwolenski, Tobola and Kaprzyk12,Reference Bourgeois, Tobola, Wiendlocha, Chaput, Zwolenski, Berthebaud, Gascoin, Recour and Scherrer13 The results of these studies are of great value because they are useful for predicting promising dopants for achieving stable and high-performance Mg2Si-based materials. In some cases, however, the occupation of sites by impurity atoms in a crystal is not yet clear; for example, as discussed in Ref. Reference Bourgeois, Tobola, Wiendlocha, Chaput, Zwolenski, Berthebaud, Gascoin, Recour and Scherrer13, the site preference of Al and Ti is not simply determined by comparing their Pauling electronegativity to that of the host. In addition, it may be necessary to consider the possibility of impurities occupying different sites because they could occupy not only the most stable sites but also other sites at finite temperatures.
Because the site occupation of impurities should strongly affect the transport properties, it is indispensable to establish a quantitative methodology for analyzing the site occupation of impurities. As a first step toward such a quantitative methodology, in the present study, we evaluated the occupancy probabilities for substitutional Mg, Si, and interstitial 4b sites, p i (i = Mg, Si, 4b), from the formation energy obtained through variable-cell calculation using the generalized gradient approximation (GGA) pseudo-potential method. The result suggests that the contributions from different sites should be considered when estimating the carrier concentration, n, induced by impurity doping and, thus, the thermoelectric transport properties.
We evaluated the Seebeck coefficient, S, based on the band structure obtained using the all-electron full-potential linearized augmented-plane-wave (FLAPW) method. In experimental systems, low doping concentrations are often used (n < 1.0 at.%); however, it is generally difficult to examine a lightly doped system using the supercell method because of the calculation cost. Therefore, we introduced the rigid-band approximation to quantitatively understand the doping effects on the S. We will show that, for Sb doping, the maximum value of S is attained at a doping concentration of approximately 0.15 at.%; on the other hand, the optimum concentration of Al is lower than that of Sb and depends on the operation temperature.
This study is organized as follows. In Sec. II, we outline the cell relaxation method used for optimizing the structures of the impurity-doped systems and the calculation of E form, p i, and S. We also provide a brief review of the validity of the rigid-band approximation for Mg2Si. In Sec. III. A, we discuss the structural properties of Al-, Sb-, Na-, and B-doped Mg2Si obtained using the cell relaxation calculation. First, we present the doping-concentration dependence of the E form for the systems; we then estimate the p i and n from the obtained values of E form. Subsequently, the lattice-constant changes induced by these impurities are examined. Finally, we discuss the types of conductivity of these systems in view of electronic band structure. In Sec. III. B, we demonstrate the dependences of S on temperature obtained using the supercell and rigid band approaches. The results obtained using the rigid band approximation are compared with the experimental findings. Sec. IV presents conclusions.
II. THEORETICAL METHODS
A. Structural optimization of impurity-doped Mg2Si
1. Structure description of undoped and impurity-doped Mg2Si
Mg2Si has the antifluorite (CaF2) crystal structure of the  $Fm\bar 3m$ space group, in which the Si and Mg atoms are located at the 4a and 8c sites, respectively. Therefore, the atomic positions in the conventional unit cell, in units of the lattice constant, are given by the following coordinates: Si: (0, 0, 0); Mg: (0.25, 0.25, 0.25); and Mg: (0.75, 0.75, 0.75). The traditional unit cell consisting of 8Mg and 4Si atoms is shown in Fig. 1. For the impurity-doped systems, as shown in the figure, we considered three impurity-site cases: substitution for Si and Mg and the interstitial insertion of an impurity into the 4b site, i.e., the (0.5, 0.5, 0.5) position in the cell.
Perfect crystal of Mg2Si with Si and Mg atoms indicated as small (red) and large (blue) points at the 4a and 8c sites, respectively. Three types of impurity sites are depicted; an impurity atom substitutes (a) Mg and (b) Si atoms, and (c) an impurity atom is inserted into the 4b site.

We defined the doping concentration, x (at.%), as the at.% of the dopant among all the atoms in a cell. To consider several cases of different x, we utilized two lattice types in the calculation: the conventional unit cell, which is shown in Fig. 1, and a 2 × 2 × 2 supercell. As shown in Fig. 1, the unit cell contains 12 atoms: 4Si and 8Mg atoms; therefore, the supercell, which consists of eight unit cells, has 96 atoms: 32Si and 64Mg atoms. For the atomic positions of the impurities in these cubic cells, we consider face-centered-cubic (fcc) or simple-cubic (sc) arrangements. When one atom (Mg or Si) in the 2 × 2 × 2 supercell is replaced by an impurity with sc periodicity, x is 1.0416 at.% (1 impurity per 96 atoms); similarly, when two atoms are replaced, x is 2.083 at.% (2 impurities per 96 atoms). On the other hand, when we consider fcc periodicity for the impurity distribution in the 2 × 2 × 2 supercell, four impurities are introduced into the cell, which results in an x of 4.167 at.%. For a unit cell, we considered only the sc lattice; hence, substituting an impurity atom into the cell leads to an x of 8.333 at.% (1 impurity per 12 atoms).
2. Cell relaxation using Quantum Espresso code
We optimized the structures of the systems with impurities by considering the localized shifting of individual atoms from their regular positions in a perfect crystal owing to the existence of impurity atoms. This was achieved using the cell relaxation calculation and the Quantum Espresso package,18 which is an ab initio pseudopotential approach based on density functional theory. Generally, the pseudopotential method requires less calculation, and it is relatively easy to achieve high accuracy by considering a large basis set of plane waves. Furthermore, this method can be used to examine systems with low impurity concentrations by using a supercell that includes a large number of atoms.
In a previous study,Reference Hirayama, Iida, Funashima, Morioka, Sakamoto, Nishio, Kogo, Takanashi and Hamada19 we examined the validity of Quantum Espresso for the calculation of the structural properties of Al-doped Mg2Si. We found that, although Quantum Espresso neglects the core states of electrons according to the pseudopotential method, the resulting doping-concentration dependence of the formation energy and the lattice constant were comparable to those of the all-electron calculations.Reference Hirayama, Iida, Funashima, Morioka, Sakamoto, Nishio, Kogo, Takanashi and Hamada19 This indicated that more accurate physical properties could be obtained using Quantum Espresso, suggesting the possibility of investigating the impurity contributions.
Using the Quantum Espresso code, we performed a structure relaxation, including optimization of the lattice constant, a, and the atomic positions in a cell, for supercells doped with impurities: Al, Sb, Na, and B. We used the norm-conserving pseudopotential that underwent GGA by using the Perdew–Burke–Ernzerhof functional. For self-consistent field calculations, the convergence thresholds of the total energy of the cell and all force components acting on all atoms were 10−5 Ry and 10−4 Ry/Bohr, respectively. The kinetic energy cutoff for the wave functions was set to 60 Ry. A (8, 8, 8) k-point set was used, and variable-cell relaxation was performed using the Broyden–Fletcher–Goldfarb–Shanno quasi-newton algorithm.
B. Formation energy and site occupancy probability
Based on the optimized structures, we calculated the formation energies to identify the preferred occupation site for a given impurity:
 $${E_{{\rm{form}},{\rm{Si}}}}\left( {{\rm{M}}{{\rm{g}}_2}{\rm{S}}{{\rm{i}}_{1 - \xi }}{A_\xi }} \right) = E\left( {{\rm{M}}{{\rm{g}}_2}{\rm{S}}{{\rm{i}}_{1 - \xi }}{A_\xi }} \right) + \xi E\left( {{\rm{Si}}} \right)-E\left( {{\rm{M}}{{\rm{g}}_2}{\rm{Si}}} \right) - \xi E\left( A \right)\quad ,$$
 $${E_{{\rm{form}},{\rm{Mg}}}}\left( {{\rm{M}}{{\rm{g}}_{2 - \xi }}{\rm{Si}}{{\rm{A}}_\xi }} \right) = E\left( {{\rm{M}}{{\rm{g}}_{2 - \xi }}{\rm{Si}}{{\rm{A}}_\xi }} \right) + \xi E\left( {{\rm{Mg}}} \right)-E\left( {{\rm{M}}{{\rm{g}}_2}{\rm{Si}}} \right) - \xi E\left( A \right)\quad ,$$
 $${E_{{\rm{form}},4{\rm{b}}}}\left( {{\rm{M}}{{\rm{g}}_2}{\rm{Si}}{{\rm{A}}_\xi }} \right) = E\left( {{\rm{M}}{{\rm{g}}_2}{\rm{Si}}{{\rm{A}}_\xi }} \right)-E\left( {{\rm{M}}{{\rm{g}}_2}{\rm{Si}}} \right) - \xi E\left( A \right)\quad .$$
Eqs. (1)–(3) correspond to the occupation of the Si, Mg, and 4b sites, respectively, by the impurity A (=Al, Sb, Na, or B). Here, ξ and E(A) denote the number of moles and the total energy, respectively. The E of the Al, Sb, Na, B, Si, and Mg crystals was calculated assuming single-crystalline structures for each element. Although B has several crystal structures, we used crystallographic information on rhombohedral BReference McCarty, Kasper, Horn, Decker and Newkirk20 to evaluate E(B) for substitution into Eqs. (1)–(3).
To estimate the site preferences of the dopants quantitatively, we defined the site occupancy probability, p i, for the Mg, Si, and interstitial 4b sites based on the following assumptions:
Assumption (1): Impurities are distributed according to the periodicity of the cell.
Assumption (2): Impurity sites are independent from each other.
Assumption (3): Impurities occupying the impurity sites form a canonical ensemble.
Assumption (1) allows us to neglect the random distribution of the impurities and use the E form obtained from the supercell calculation introduced in Sec. II. A. From Assumptions (2) and (3), p i at the absolute temperature, T, could be expressed as
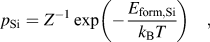 $${p_{{\rm{Si}}}} = {Z^{ - 1}}\exp \left( { - {{{E_{{\rm{form}},{\rm{Si}}}}} \over {{k_{\rm{B}}}T}}} \right)\quad ,$$
 $${p_{{\rm{Mg}}}} = 2{Z^{ - 1}}\exp \left( { - {{{E_{{\rm{form}},{\rm{Mg}}}}} \over {{k_{\rm{B}}}T}}} \right)\quad ,$$
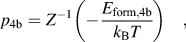 $${p_{4{\rm{b}}}} = {Z^{ - 1}}\left( { - {{{E_{{\rm{form}},4{\rm{b}}}}} \over {{k_{\rm{B}}}T}}} \right)\quad ,$$
where k B is the Boltzmann constant and the partition function, Z, is given by:
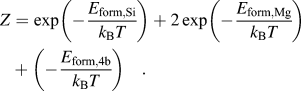 $$Z = \exp \left( { - {{{E_{{\rm{form}},{\rm{Si}}}}} \over {{k_{\rm{B}}}T}}} \right) + 2\exp \left( { - {{{E_{{\rm{form}},{\rm{Mg}}}}} \over {{k_{\rm{B}}}T}}} \right) + \left( { - {{{E_{{\rm{form}},4{\rm{b}}}}} \over {{k_{\rm{B}}}T}}} \right)\quad .$$
C. Dependence of the Seebeck coefficient on temperature
1. Seebeck coefficient calculation using FLAPW method
For the impurity-doped systems, we calculated the Seebeck coefficient, S, at temperatures ranging from 300–900 K using all electron band structure calculation package (ABCAP).Reference Kasai, Akai and Yoshida21 ABCAP is a program used for calculating the electronic state using the FLAPW method. In the calculations, we used the local density approximation and the analytical expression of Vosco et al.Reference Vosko, Wilk and Nusair22 and PainterReference Painter23 for the exchange-correlation energy. The APW method was linearized using the scheme of AndersonReference Andersen24 and Takeda and Kubler.Reference Takeda and Kubler25 The muffin-tin radii used in the calculation were 2.2 a.u. for Mg and 2.0 a.u. for Si. The energy cutoff parameters were 60 Ry for the wave function. The angular-momentum expansion was truncated at l max = 7 for the wave function and at l max = 6 for the charge density and potential. We took a (6, 6, 6) k-point set.
We first obtained the band structure of impurity-doped Mg2Si systems using ABCAP. In the supercell calculation, the lattice constant was optimized, while shift of the atomic positions was not taken into account. Based on the obtained band, we evaluated the value of S within the Boltzmann transport theory while using the relaxation-time approximation. In the semiclassical calculation, S was obtained from the following formula:
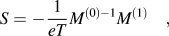 $$S = - {1 \over {eT}}{M^{\left( 0 \right) - 1}}{M^{\left( 1 \right)}}\quad ,$$
where e is the elementary charge. The velocity tensor M (0) (T, μ) and the energy-transport tensor M (1) (T, μ) are defined by the following formulas:
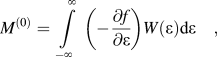 $${M^{\left( 0 \right)}} = \int\limits_{ - \infty }^\infty {\left( { - {{\partial f} \over {\partial \varepsilon }}} \right)W\left( \varepsilon \right){\rm{d}}\varepsilon \quad ,}$$
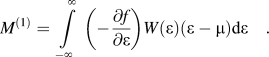 $${M^{\left( 1 \right)}} = \int\limits_{ - \infty }^\infty {\left( { - {{\partial f} \over {\partial \varepsilon }}} \right)W\left( \varepsilon \right)\left( {\varepsilon - \mu } \right){\rm{d}}\varepsilon \quad .}$$
Here, ε and μ are the energy and chemical potential, respectively. The velocity vkn, where n is the band index, and the density of velocity tensor W(ε) are expressed as follows:
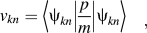 $${{\vskip-3ptv_{kn}} {\;\vskip-2.6pt=\;} \left\vscale200%\langle {\vskip-2.8pt{\psi _{kn}}\left| {{p \over m}} \right|{\psi _{kn}}} \right\vscale200%\rangle \quad ,$$
 $$W\left( \varepsilon \right) = \sum {{{{V_{{\rm{cell}}}}} \over {{{\left( {2\pi } \right)}^3}}}} \int {{v_{kn}}{v_{kn}}{{\partial {S_\varepsilon }} \over {\hbar \left| {{v_{kn}}} \right|}}} \quad ,$$
where p and m are the momentum and the mass of the electron, respectively;  $\left| {{\psi _{kn}}} \right\rangle$ is the Kohn–Sham eigenstate obtained using the FLAPW method; and V cell is the unit-cell volume. The integration is performed over the constant-energy surface in the Brillouin zone.
The Seebeck coefficient depends on the chemical potential, μ, which shifts on changing the temperature. The values of μ at finite temperatures were determined as follows so that the total number of electrons of the system, N, is constant:
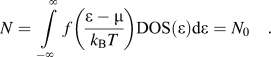 $$N = \int\limits_{ - \infty }^\infty {f\left( {{{\varepsilon - \mu } \over {{k_{\rm{B}}}T}}} \right){\rm{DOS}}\left( \varepsilon \right){\rm{d}}\varepsilon = {N_0}\quad .}$$
The value N 0 is determined by the impurity concentration.
2. Rigid-band approximation
For practical applications in thermoelectric generator systems, thermoelectric materials must be semiconducting, with impurity concentrations lower than that considered in the supercell calculation mentioned above (x < 1.0 at.%). We thus introduced the rigid-band approximation, which relates the effect of the impurity doping on the electronic states to shifts in the Fermi energy, regardless of the change in the band structure.
We have revealed that the calculation using this approach reproduces the Seebeck coefficient for Sb-doped Mg2Si obtained using the supercell calculation.Reference Hirayama, Iida, Nishio, Kogo, Takanashi and Hamada26 This indicates that Sb doping retains the band dispersion of Mg2Si despite our calculation being performed for a high doping concentration (∼4 at.%). Therefore, it can be concluded that the effect of the doping on S is primarily due to the changes in the carrier concentration, i.e., the Fermi levels of the electrons.
3. Contributions from different impurity sites
We considered contributions from both Mg and Si sites, incorporating the site occupancy probability of a given impurity, as explained above. Here, the insertion into the 4b site was not considered to introduce carriers. Therefore, the expected carrier concentration values, <n>, and Seebeck coefficient, <S> could be expressed as:
 $$\lt n > = {n_{{\rm{Si}}}}{p_{{\rm{Si}}}} + {n_{{\rm{Mg}}}}{p_{{\rm{Mg}}}}\quad ,$$
 $$\lt S > = S\left( { \lt n > } \right)\quad ,$$
where n i (i = Si, Mg) is the carrier concentration introduced by impurity doping into the i site. The latter formula indicates that <S> is calculated using <n> obtained from Eq. (8) under the rigid-band approximation.
III. RESULTS AND DISCUSSION
A. Structural properties of impurity-doped Mg2Si
1. Formation energy
We performed cell-relaxation calculations for impurity-doped Mg2Si using the pseudopotential method. The formation energies E form,i (i = Mg, Si, and 4b sites) of the systems were calculated using Eqs. (1)–(3). Figure 2 shows the calculated E form,i of Al-, Sb-, B-, and Na-doped systems with doping concentration x. Here, Figs. 2(a) and 2(b) include data from previous studies.Reference Hirayama, Iida, Funashima, Morioka, Sakamoto, Nishio, Kogo, Takanashi and Hamada11,Reference Hirayama, Iida, Funashima, Morioka, Sakamoto, Nishio, Kogo, Takanashi and Hamada19
Dependence of formation energies on doping concentration for (a) Al-, (b) Sb-, (c) B-, and (d) Na-doped Mg2Si for Mg (circles), Si (triangles), and 4b (diamonds) sites.
For the n-type dopants, Al and Sb, the systems exhibited a tendency toward doping into the Mg and Si sites, respectively, as shown in Figs. 2(a) and 2(b). Particularly, Sb strongly preferred the Si site at all concentrations. On the other hand, the Al-doped system showed the lowest E form for the Mg site; however, at low doping levels, the substitution of Al into the Mg and Si sites resulted in comparable values of E form, suggesting that there may be almost no energetic difference between these two impurity sites.
The substitution sites that exhibit p-type conductivity can be realized for B- and Na-doped Mg2Si [Figs. 2(c) and 2(d), respectively] because the lowest E form was obtained when B and Na occupied the Si and Mg sites, respectively. However, there is still a possibility that Na occupies the 4b site because doping with Na into the Mg and 4b sites resulted in almost the same E form. This would impede the realization of p-type conductivity.
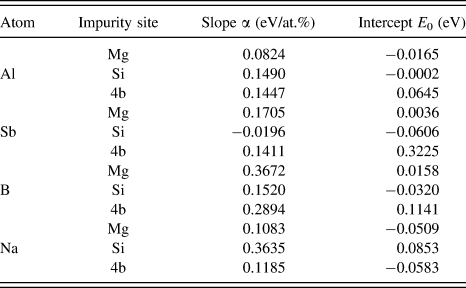
On the basis of the calculation results, the following equation was derived as a fitting formula using the least-square method: E form(x) = E 0 + αx. This information is given in Table I. We observed that the graphs of E form(x) exhibit good linearity and the R 2 values were mostly above 0.95, indicating that the impurities show minimal interactions with each other. Hence, it is expected that the clear linearity obtained here can be extrapolated to predict the behavior of the system in low-concentration regions. Because it is computationally expensive to perform a large supercell calculation, an estimate of E form(x) in a low-concentration region obtained from accurate calculations performed for high-concentration regions is advantageous in analyzing the experimental results.
Slopes (α) and intercepts (E 0) of the following fitting formula obtained based on the calculation results in Fig. 2: E form(x) = E 0 + αx. The data for the Al-doped system were summarized from our previous study.Reference Bourgeois, Tobola, Wiendlocha, Chaput, Zwolenski, Berthebaud, Gascoin, Recour and Scherrer13
2. Site occupancy probability and carrier concentration
By comparing the values of E form obtained for the different sites, we can determine the sites where the impurities could be easily substituted. However, it is not necessary that the impurities occupy only the most stable sites in a synthesized substance. They may occupy other sites, depending on the temperature necessary for the synthesis of the Mg2Si crystal; for example, the required temperature in the case of molten synthesis is 1000 K or higher. Therefore, a more explicit expression for the contribution of all possible impurity sites is necessary for a quantitative analysis of impurity-doped systems.
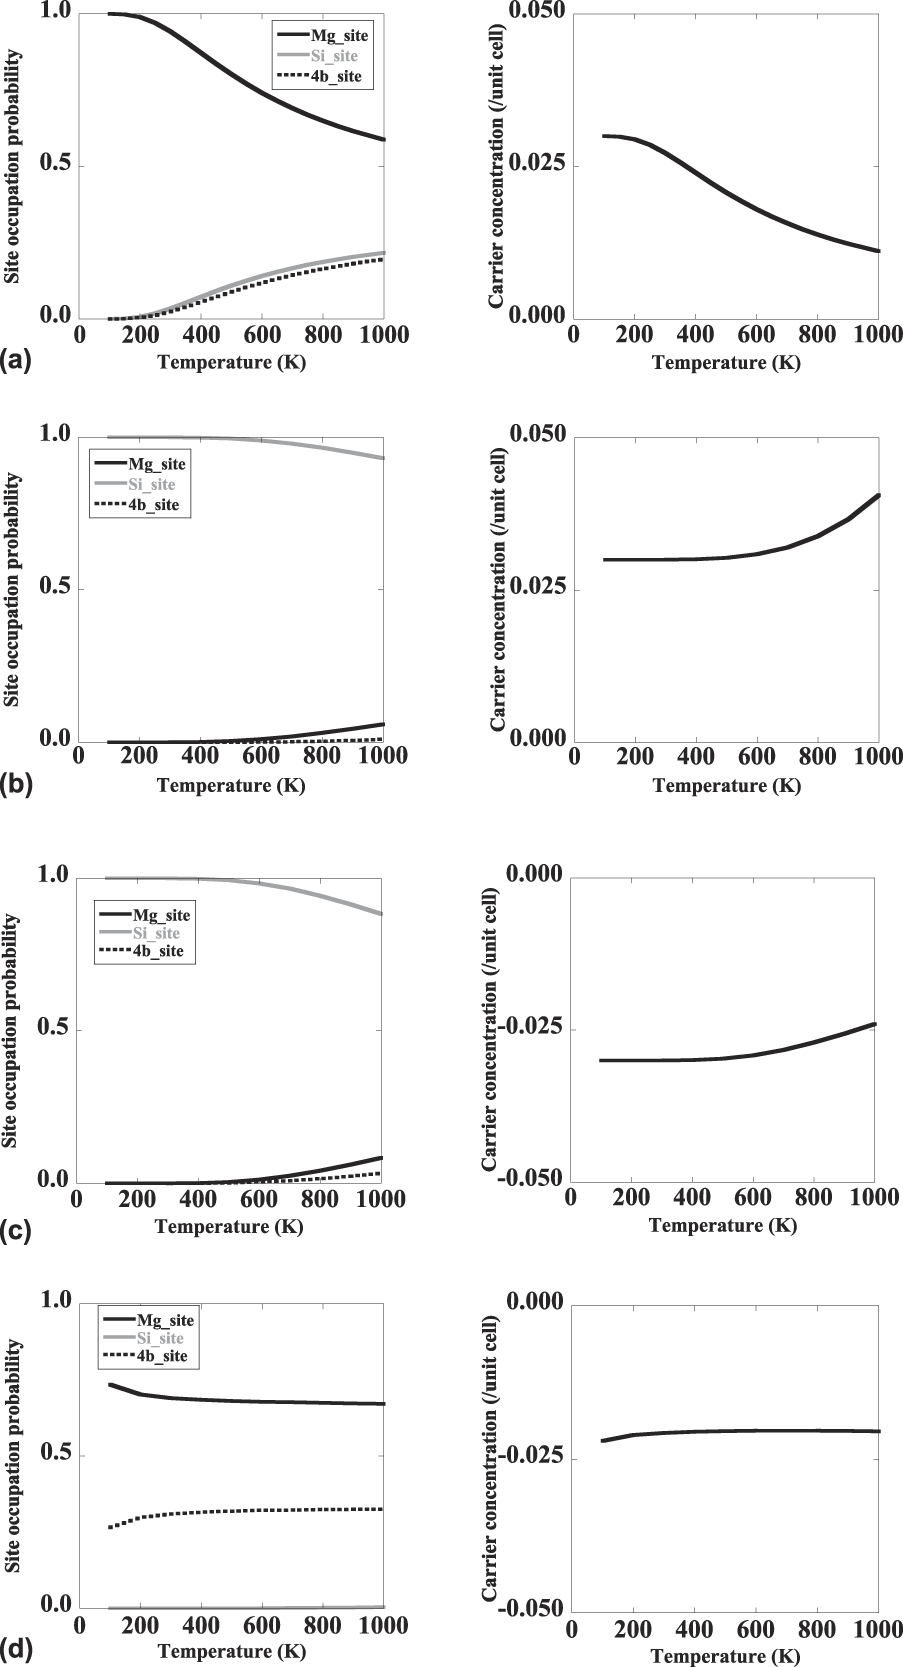
We therefore calculate the occupancy probability p i [Eqs. (4)–(6)] of the impurity sites i (i = Mg, Si, 4b sites) to determine the contribution from each site quantitatively. As an example, the dependence of p i on temperature for Al, Sb, B, and Na at x = 1 at.% is shown in Fig. 3. Hereinafter, the temperature used in the calculation of p i is represented as T O.P.. The results indicate that, at low T O.P., impurities occupy only the most stable sites. However, as T O.P. increases, they occupy other sites as well.
Dependence of site occupancy probabilities, p i(T O.P.) (i = Mg, Si, and 4b sites), and the carrier concentration, n(x, T O.P.), on temperature, T O.P., for (a) Al-, (b) Sb-, (c) B-, and (d) Na-doped Mg2Si. The carrier concentration is defined as the number of electrons per primitive unit cell; and it should be noticed that its sign indicates the carrier type with positive and negative n(x, T O.P.) corresponding to electrons and holes, respectively. Here, the doping concentration x is fixed at 1.0 at.%.
The Al-doped system exhibits relatively similar E form for all sites [Fig. 2(a)]; therefore, it occupies several sites over a broad temperature range [Fig. 3(a)]. On the other hand, as shown in Figs. 3(b) and 3(c), Sb- and B-doped Mg2Si are very stable when these impurities are substituted into the Si site. The substitution to the other sites can be ignored until T O.P. becomes higher than approximately 600 K. This is because the E form associated with the substitution of Sb and B into the Si sites is much smaller than those for the Mg and 4b sites, as shown in Figs. 2(b) and 2(c). As shown in Fig. 3(d), Na occupies both Mg and 4b sites over the whole temperature range (T O.P. = 100–1000 K) since the E form values associated with these sites are very similar, as shown in Fig. 2(d).
Next, by using the obtained values of p Si and p Mg, we estimate the carrier concentration resulting from the impurity doping. It is assumed that the number of carriers released when an impurity is substituted into a Si or Mg site can be determined by the difference in the valence. For example, when Al (valence 3) is substituted to Si (valence 4), one hole is released; similarly, when it is substituted to Mg (valence 2), an electron is generated. The results of this calculation are also shown in Fig. 3. Here, it is assumed that the impurity occupying the 4b site does not release a carrier.
The Al-doped system had the smallest number of electrons per unit cell, n(T O.P.), at high temperatures, as shown in Fig. 3(a). Because Al is simultaneously substituted into both Mg and Si sites, an electron and a hole are generated, which eventually decreases n(T O.P.).
As shown in Fig. 3(b), the Sb-doped system exhibits almost no change in n(T O.P.) at T O.P. below 700 K because the p i of Sb is high for the Si site. Contrary to the case of Al, n(T O.P.) increases at high T O.P. because of substitutions at the Mg site. The number of released electrons is one when Sb (valence 5) is substituted to Si (valence 4), whereas three electrons are introduced in the case of Mg (valence 2) substitution. Therefore, n(T O.P.) changes drastically at high temperatures even though the probability of Mg substitution is low.
When B or Na is substituted to the most stable sites in the system, a hole is generated. Here, it should be noted that a negative n(T O.P.) indicates that the carriers are holes in Fig. 3. For the B-doped system, there is a possibility for the generated carriers to have the opposite sign; that is, a hole is generated in B (valence 3) by Si (valence 4) substitution, and an electron is released from B (valence 3) by Mg (valence 2) substitution. However, because the E form,Mg is very high [Fig. 2(c)], p Mg is nearly zero in a wide temperature range (T O.P. = 100–600 K) [Fig. 3(c)]. Increasing T O.P. beyond 600 K reduces the number of holes. Na generates a hole when it occupies any of the Si or Mg sites; however, the substitution into the Si site hardly occurs, as shown in Fig. 3(d). Therefore, the hole concentration remains reasonably constant at all temperatures.
3. Lattice constant
Figure 4(a) shows the pick-up data for the lattice constant, a(x), obtained from cell relaxation for Al-, Sb-, Na-, and B-doped Mg2Si, where the impurities are located at their most energetically preferred sites. The lattice constant of pure Mg2Si, i.e., the intercept of the graphs, a 0, was obtained as 6.350 Å. This value is similar to experimentally obtained ones, which are in the range of 6.355–6.391 Å.Reference Fiameni, Battiston, Boldrini, Famengo, Agresti, Barison and Fabrizio27–Reference Owen and Preston29
Dependences of lattice constant a(x) on doping concentration x for Al-, Sb-, B-, and Na-doped Mg2Si, where (a) the impurities are located at their most energetically preferred sites and (b) contributions from different impurity sites are considered.
As shown in Fig. 4(a), a decreased for Al and B, whereas it increased for Sb and Na. This can be explained intuitively in terms of the ionic radiusReference Shannon and Prewitt30 as follows. For instance, when Al is located at the Mg site, which has four neighboring Si atoms, the larger ionic radius of Mg (0.57 ÅReference Shannon and Prewitt30) relative to Al (0.39 ÅReference Shannon and Prewitt30), for a coordination number of 4, indicates that the crystal should shrink. Similarly, B-doping [an ionic radius of 0.11 Å at a coordination number of 4 (Ref. Reference Shannon and Prewitt30)] leads to a decrease in a when it displaces Si (0.26 ÅReference Shannon and Prewitt30). In contrast, because Sb and Na have greater ionic radii than Si and Mg, respectively,Reference Shannon and Prewitt30 regardless of the coordination number, the crystal can be expected to expand if they are substituted in the respective Si and Mg sites. This prediction agrees with our calculation results. This intuitive explanation based on the ionic radii cannot be accurate because Mg2Si is not a completely ionic crystal; the crystal contains abundant covalency. Nevertheless, the discussion presented here is still meaningful because the lattice-constant changes due to impurity doping can be at least qualitatively interpreted from the volume occupied by an impurity atom in a crystal.
Figure 4(b) shows the expected values of the lattice constants, <a>, of Al-, Sb-, B-, and Na-doped systems. These were evaluated considering the site occupancy probability as follows:
 $$\lt a > = {a_{{\rm{Si}}}}{p_{{\rm{si}}}} + {a_{{\rm{Mg}}}}{p_{{\rm{Mg}}}} + {a_{4{\rm{b}}}}{p_{4{\rm{b}}}}\quad .$$
Consequently, in Fig. 4(b), the graphs for Al- and Na-doped systems have slightly larger slopes than those in Fig. 4(a), where only the most stable sites are considered. This is attributed to the additional contributions from the other sites to the lattice constant.
4. Density of states for impurity-doped systems
Electronic dispersion curves and the density of states (DOS) of pure Mg2Si obtained using Quantum Espresso are shown in Figs. 5(a) and 5(b), respectively. It is expected that the systems doped with Sb and Al and those doped with B and Na exhibit n- and p-type conductivities, respectively, considering the most stable sites for the impurity dopants, i.e., Mg sites for Al and Na and Si sites for Sb and B. However, as the occupation of unstable sites can affect the conductivity type, which is especially important for Al (as is clear from the calculation results of E form,i), we calculated the electronic band structure using Machikaneyama2002 (Akai KKR)31 [which is based on the Korringa–Kohn–Rostoker method with the coherent potential approximation (KKR-CPA)], while considering the contributions from all sites with p i (T O.P.) at the same time. Figures. 5(c)–5(f) show obtained DOS for the Al-, Sb-, B-, and Na-doped systems, respectively. As shown in the figures, the Fermi level shifted into the conduction band when doped with Al and Sb, whereas it shifted into the valence band when doped with B and Na. Therefore, even when contributions from unstable sites were considered, the systems exhibited n-type conductivity for Al and Sb and p-type conductivity for B and Na. This is consistent with the experimental results in which both Al- and Sb-doped Mg2Si show n-type conductivity. We will report on the calculation results and discuss the effect of impurity sites on the electronic states in more detail in a future study.
(a) Electronic dispersion curves and (b) DOS of pure Mg2Si obtained from the cell-relaxation calculation using Quantum Espresso are shown. Furthermore, DOS of the (c) Al-, (d) Sb-, (e) B-, and (f) Na-doped systems with x of 1 at.% were obtained by considering the contributions from impurity sites, i.e., Mg, Si, and 4b sites, with p i(T O.P.) using the KKR-CPA method.31 Here, each figure shows the total DOS along with the local DOS attributed to the constituent atoms within their Muffin-tin potentials. Consequently, the Al- and Sb-doped systems had Fermi levels in the conduction band, and therefore, they are expected to exhibit n-type conductivity. On the other hand, B and Na doping shifted the Fermi level into the valence band, and thus, these systems should exhibit p-type conductivity.
B. Thermoelectric transport property
1. Seebeck coefficient based on the FLAPW band calculation
Figure 6 shows the T dependence of S for Al- and Sb-doped Mg2Si calculated using the supercell approach, where these impurities are substituted in their corresponding most-stable sites. The results show that x predominantly affects S. Note that, as our calculation was limited to rather high x values for technical reasons, the systems under consideration were metallic and the obtained S values were as small as approximately 10−1–10−2 times the experimental values.Reference Oto, Iida, Sakamoto, Miyahara, Natsui, Nishio, Kogo, Hirayama and Takanashi1
T-dependence of Seebeck coefficient S for (a) Al- and (b) Sb-doped Mg2Si for x = 4.167 and 8.334 at.% obtained using supercell calculations. These impurities are substituted in their corresponding most-stable states, i.e., the Mg and Si sites are occupied by Al and Sb, respectively.
2. Comparison with experiment
To discuss experimental results, we calculated S for lightly doped systems using Eq. (9) with the expression for n taken from Eq. (8). Based on the above discussion, we included the following assumptions:
Assumption (4): Changes in the lattice constant and atomic positions induced by impurity doping do not affect S.
Assumption (5): The band dispersion is not influenced by impurities and only the Fermi-level shifting is considered (rigid-band approximation).
Furthermore, according to the discussion in Sec. III. A, we adopted the following:
Assumption (6): The formation energy at an arbitrarily small x can be linearly extrapolated from the results in Fig. 2.
Assumption (4) was verified by our study,Reference Hirayama, Iida, Nishio, Kogo, Takanashi and Hamada26 which clarified that S is predominantly dependent on the carrier concentration and does not depend strongly on the structural changes induced by impurity doping. Under Assumptions (1)–(6), by using Eq. (9), we calculated S for Al- and Sb-doped Mg2Si systems. Specifically, S was obtained by applying the Boltzmann transport equation for the intrinsic band dispersion of Mg2Si, using the Fermi level determined from the carrier concentration given in Eq. (8).
For the rigid-band approach, we now introduce another shortcut in the band-structure treatment: a scissors operation. In this operation, the band gap is corrected with the value of the following function:
 $${E_{\rm{g}}} = {E_{{\rm{g}}0}} + \beta T\quad ,$$
where E g0 = 0.78 eV and β = −5 × 10⁻⁴ eV K−1.Reference Morris, Redin and Danielson3,Reference Koenig, Lynch and Danielson32 The Kohn–Sham equations generally underestimate the band gap. The scissors operation corrects the band gap to the experimental value; i.e., all the calculated conduction bands are uniformly shifted up in the reciprocal space. This treatment is partially justified by a quasi-particle calculation in the GW approximation.Reference Hybertsen and Louie33,Reference Gygi and Baldereschi34
Figures 7(a) and 7(b) show the T dependence of S calculated for Al- and Sb-doped Mg2Si, respectively, along with the experimental results. We consider the same values of x as in the experiments: 1.0 at.% for Al doping and 0.5 at.% for Sb doping. Each figure shows three curves of theoretical results, which are obtained by assuming three different temperatures (T O.P. = 0, 300, and 1000 K) for the calculation of p(T O.P.) in Eqs. (4)–(7).
T dependence of Seebeck coefficient S calculated for (a) Al-, (b) Sb-, (c) B-, and (d) Na-doped Mg2Si using the rigid-band approximation along with the experimental results (only for Al and Sb). The same concentrations x of Al and Sb as those in the experiments are considered in the calculation: 1.0 at.% (4.92 × 10²⁰ in units of cm−3) and 0.5 at.% (2.46 × 10²⁰ in units of cm−3) for Al and Sb doping, respectively. The x of B and Na is set at 0.8 at.% (3.93 × 10²⁰ in units of cm−3). Different symbols represent the theoretical results obtained by assuming different temperatures (T O.P. = 0, 300, and 1000 K) for the calculation of p(T O.P.).
For the Al-doped systems [Fig. 7(a)], S has relatively large values when p (T O.P. = 1000 K) is used. This can be attributed to the carrier cancellation occurring at higher temperatures, as discussed in the previous section. At high temperatures, Al atoms can occupy Mg and Si sites with a finite probability, as shown in Fig. 3. It induces the cancellation of electrons and holes and consequent reduction in n; therefore, the Fermi level drops toward the band edge, leading to the enhancement of S. However, none of these calculations can reproduce the experimental results. This may be because the experimental sample actually contains a smaller amount of Al than that added (1.0 at.%). This is a reasonable explanation because, according to our observations, Al doping hardly changed the transport properties of Mg2Si, such as the electrical conductivity, suggesting that not all Al atoms are contained within the sample. However, we considered all of them to exist at one of the Si, Mg, or 4b sites; hence, there is a discrepancy between the experimental and calculated results.
As shown in Fig. 7(b), the calculated results for 0.5 at.% Sb doping well reproduce the trend of the Seebeck coefficients obtained in the experiment. This suggests that Sb atoms are stably contained within the experimental sample. As shown in Fig. 2(b), almost no formation energy was required for doping Sb into the Si site, implying that a large number of Sb atoms can be doped into Mg2Si. The S for Sb doping [Fig. 7(b)] decreases with increasing T O.P. substituted for the function p(T O.P.), contrary to the case of Al doping [Fig. 7(a)]. This can be understood from the increase in the electron concentration at high temperatures, as shown in Fig. 3(b).
On the other hand, Figs. 7(c) and 7(d) show Seebeck coefficients for B- and Na-doped p-type systems, respectively. The T–S curves are not consistent with those obtained for the experimental p-type systems (e.g., AgReference Mars, Ihou-Mouko, Pont, Tobola and Scherrer9- and GaReference Ihou-Moukoa, Mercier, Tobola, Pont and Scherrer10-doped Mg2Si), which exhibit maximum S at about 420 μV/K (600 and 475 K, respectively). The discrepancy between our calculations and the experiments can be primarily attributed to the difference in carrier concentration since it predominantly determines the magnitude of S.Reference Hirayama, Iida, Nishio, Kogo, Takanashi and Hamada26 For discussing the thermopower of the p-type Mg2Si, therefore, it is required to determine the carrier concentrations of the systems.
As mentioned previously, there is a possible discrepancy between the impurity concentration we added to Mg2Si and that present in the actual system. Figures 8(a) and 8(b) show the respective calculation results of S for Al- and Sb-doped Mg2Si with different doping levels. The values of S were obtained through Eqs. (8) and (9) with p i(T O.P.) (i = Mg, Si, 4b sites) for T O.P. = 1000 K. We observe that the Al-doped system has a magnitude of S comparable to that of the experiment for x in the range of 0.1–0.5 at.%, which is lower than the added concentration of 1.0 at.%. This suggests that the experimental system may practically have an Al content lower than that added. Similarly, Fig. 8(b) suggests that the actual Sb content in the system is approximately 0.35 at.%, while the added concentration was 0.5 at.% in the experiment.
T dependence of Seebeck coefficient S for (a) Al- and (b) Sb-doped Mg2Si with several doping levels, along with the experimental data. The theoretical values of S were obtained through Eq. (9) with Eqs. (4)–(8). In the calculation, we used the site occupancy probability of dopants, p(T O.P.) (i = Mg, Si, 4b sites), calculated assuming T O.P. = 1000 K. In Fig. 8(a), we observe that the S values for x in the 0.1–0.5 at.% (4.92 × 10¹⁹ − 2.46 × 10²⁰ in units of cm−3) range were comparable to those obtained from the experiment. Similarly, in Fig. 8(b), the actual Sb content is suggested to be approximately 0.35 at.% (1.72 × 10²⁰ in units of cm−3). It is suggested that 0.15 at.% (7.37 × 10¹⁹ in units of cm−3) is the optimum concentration of Sb to attain the maximum S value. However, for Al, attaining the maximum S value depends on the operation temperature because the T–S curve has a peak and its position varies with temperature.
It is noteworthy that, for the systems doped with Al at 0.05 and 0.1 at.% in Fig. 8(a), the T–S curves show a peak, and S subsequently decreases with increasing T at a higher temperature range. The chemical potential μ is shifted into the band gap of Mg2Si at such temperatures. The electrons and holes are simultaneously generated; therefore, the value of S decreases with increasing T.
Finally, we determined the optimum concentrations of Al and Sb for achieving the maximum Seebeck coefficient. From Fig. 8(b), it is suggested that 0.15 at.% is the optimum concentration of Sb, whereas for Al-doped Mg2Si [Fig. 8(a)], the optimum doping concentration depends on the operating temperature because the T–S curve has a peak and it shifts to higher-temperature regions with increasing x. For example, to realize a system operating at a low temperature such as 600 K, a lightly doped system (x < 0.05 at.%) must be used. At high temperatures (700–900 K), on the other hand, the optimum concentration of Al is suggested to be in the range of 0.05–0.1 at.%.
IV. CONCLUSIONS
We performed variable-cell relaxation calculations for Al-, Sb-, B-, and Na-doped Mg2Si using the pseudopotential method and analyzed the site stabilities of these dopants for the Mg, Si, and 4b sites in terms of the formation energy E form. Furthermore, to quantitatively discuss the site occupancy of the dopants, we derived the site occupancy probability p from E form, assuming a canonical distribution for the site occupation of impurities.
The p and the corresponding density of the carrier introduced by impurity doping, n, show different dependencies on temperature for each dopant. Between the n-type impurities, Al and Sb, the former tends to occupy different sites with finite probabilities, particularly in the high temperature region, and leads to the reduction of n because of the generation of both electrons and holes. On the other hand, the n value remains nearly constant in the latter for a wide range of temperatures (100–700 K) because of Sb's strong preference to the Si site. For B and Na, it is suggested that p-type conductivity can be realized using these impurities. However, the Na-doped system shows an occupancy probability for the 4b site comparable to that of the Mg site. Thus, it may be difficult to achieve stable p-type conductivity through Na doping.
We calculated the Seebeck coefficients for the systems based on the FLAPW calculation and the Boltzmann transport theory. To discuss the lightly doped systems, we introduced the rigid-band approximation. Using this method, we evaluated the T dependence of S for Al- and Sb-doped Mg2Si. The results suggest a possible discrepancy between the impurity concentration added to the sample and that present in the actual system. Furthermore, we predicted the optimum concentrations of Al and Sb that maximize the Seebeck coefficient. For the Sb-doped system, an x of 0.15 at.% enhances the Seebeck coefficient. For the Al-doped system, the optimum x depends on the operation temperature; an x in the range of 0.05–0.1 at.% was found to be suitable at approximately 700–900 K, and an x of 0.05 at.% was suggested to maximize S at 600 K.
In the present study, we examined impurity doping in perfect single-crystalline Mg2Si. For a more realistic treatment of the systems, however, the crystal disorder may need to be considered. For example, theoretical studiesReference Kato, Yagi and Fukusako5,Reference Liu, Tan, Yin, Liu, Tang, Shi, Zhang and Uher14–Reference Kutorasinski, Wiendlocha, Tobola and Kaprzyk16 have shown that vacancies of Mg sites and interstitial Mg defects modify the electronic structure and can affect the conductivity type.Reference Tobola, Kaprzyk and Scherrer15 Moreover, it has been reported that Mg-vacancy defects and doping of Sb into the Si site can cause the degeneracy of conduction bands,Reference Liu, Tan, Yin, Liu, Tang, Shi, Zhang and Uher14 which may affect the Seebeck coefficient, similarly to the behavior theoretically predicted for Mg2Si1−xSnx.Reference Bourgeois, Tobola, Wiendlocha, Chaput, Zwolenski, Berthebaud, Gascoin, Recour and Scherrer13 In addition, we considered periodic arrangements for the distributions of impurities; however, it is not confirmed that these configurations are the most energetically stable. Therefore, additional investigations are needed for clarifying the influence of the structural disorders mentioned here on the crystal stability as well as the transport properties toward a quantitative understanding of the effects of doping on the thermoelectric characteristics of Mg2Si.
ACKNOWLEDGMENTS
The authors are grateful to Dr. H. Funashima and Prof. M. Geshi for their professional guidance and insightful comments. This research was partially supported by JSPS KAKENHI Grant No. (26820099).