Introduction
Molybdenite is the primary carrier of rhenium, which is an important critical metal in the United Kingdom and Russian Federation (Chakhmouradian et al., Reference Chakhmouradian, Smith and Kynicky2015 and references therein). This makes the study of both structural and chemical heterogeneity of molybdenite extremely important. Heterogeneous distribution of rhenium, and, sometimes, tungsten and selenium in molybdenite have been identified by electron microprobe analysis (EMPA) (Kovalenker et al., Reference Kovalenker, Laputina and Vyalsov1974; Prokof'ev et al., Reference Prokof'ev, Zorina, Kovalenker, Akinfiev, Baksheev, Krasnov and Trubkin2007; Voudouris et al., Reference Voudouris, Melfos, Spry, Bindi, Kartal, Arikas, Moritz and Ortelli2009, Reference Voudouris, Mavrogonatos, Melfos, Spry, Magganas, Alfieris, Soukis, Tarantola, Periferakis, Kołodziejczyk, Scheffer, Repstock and Zeug2019; Grabezhev and Shagalov, Reference Grabezhev and Shagalov2010; Grabezhev, Reference Grabezhev2013; Grabezhev and Voudouris, Reference Grabezhev2013; Kalinin et al., Reference Kalinin, Savchenko and Selivanova2013; Maksimyuk and Kulikova, Reference Maksimyuk and Kulikova2013; Grabezhev and Hiller, Reference Grabezhev and Hiller2015; Plotinskaya et al., Reference Plotinskaya, Grabezhev and Seltmann2015, Reference Plotinskaya, Abramova, Groznova, Tessalina, Seltmann and Spratt2018a; Rathkopf et al., Reference Rathkopf, Mazdab, Barton and Barton2017; McFall et al., Reference McFall, Roberts, McDonald, Boyce, Naden and Teagle2019), by laser ablation inductively coupled plasma mass spectrometry (LA-ICPMS) (Aleinikoff et al., Reference Aleinikoff, Creaser, Lowers, Magee and Grauch2012; Ciobanu et al., Reference Ciobanu, Cook, Kelson, Guerin, Kalleske and Danyushevsky2013; Bogdanov and Krumov, Reference Bogdanov and Krumov2016; Kovalenker et al., Reference Kovalenker, Trubkin, Abramova, Plotinskaya, Kiseleva, Borisovskii and Yazykova2018, Plotinskaya et al., Reference Plotinskaya, Abramova, Groznova, Tessalina, Seltmann and Spratt2018a), and by nanoscale secondary ion mass spectrometry (NanoSIMS) (Barra et al., Reference Barra, Deditius, Reich, Kilburn, Guagliardo and Roberts2017).
Newberry (Reference Newberry1979) revealed the positive correlation between contents of rhenium and the portion of rhombohedral (3R) polytype in molybdenite. Later Filimonova et al. (Reference Filimonova, Zhukov and Malyavskaya1984) made similar observations. The 3R polytype has since been considered more favourable for Re incorporation than the more common hexagonal (2H) polytype, although sometimes high Re contents (>1wt.%) have been reported both in natural (Voudoris et al., Reference Voudouris, Melfos, Spry, Bindi, Kartal, Arikas, Moritz and Ortelli2009) and synthetic (Drabek et al., Reference Drabek, Rieder and Bohmova2010) 2H molybdenites. It is notable that all papers mentioned above analysed bulk samples to estimate the 3R/2H ratio in molybdenite and did not take into account the chemical and structural heterogeneity of individual molybdenite grains.
The present paper is the first attempt to identify the distribution of different polytypes of molybdenite within a single grain using only non-destructive methods, such as micro x-ray diffraction (μXRD) and electron back-scattered diffraction (EBSD), and to reveal the relationships between variations of rhenium contents and molybdenite structure.
Sample selection and analytical methods
Sample selection
Molybdenite grains selected for this study were chosen according to the following conditions: (1) should form flakes large enough to be analysed, i.e. at least tens of μm; (2) must be neither mechanically deformed nor subjected to post-depositional hydrothermal or supergene alteration; (3) should have Re contents (i) easily detectable by EMPA (i.e. > 0.1 wt.%) and (ii) highly variable; and (4) must consist of both 3R and 2H polytypes.
For the above mentioned reasons two molybdenite-bearing samples from porphyry copper mineralisation of the Southern Urals were selected.
Sample Z-1461/164.5 comes from the Zapadnoe deposit located immediately to the west from the Mikheevskoe porphyry copper deposit, Chelyabinsk Oblast, Russia. The latter was described by Plotinskaya and co-workers (Plotinskaya et al., Reference Plotinskaya, Grabezhev and Seltmann2015, Reference Plotinskaya, Azovskova, Abramov, Groznova, Novoselov, Seltmann and Spratt2018b). The sample represents seriate diorite porphyry with phyllic alteration and a network of quartz veinlets ~0.5 cm thick with molybdenite nests up to 2 mm and later chlorite stringers. Molybdenite forms in bunches of sub-parallel flakes tens to 100 µm wide and 500 to 700 µm long. Flakes are intergrown with chlorite and overgrown by quartz with minor dolomite (Fig. 1).
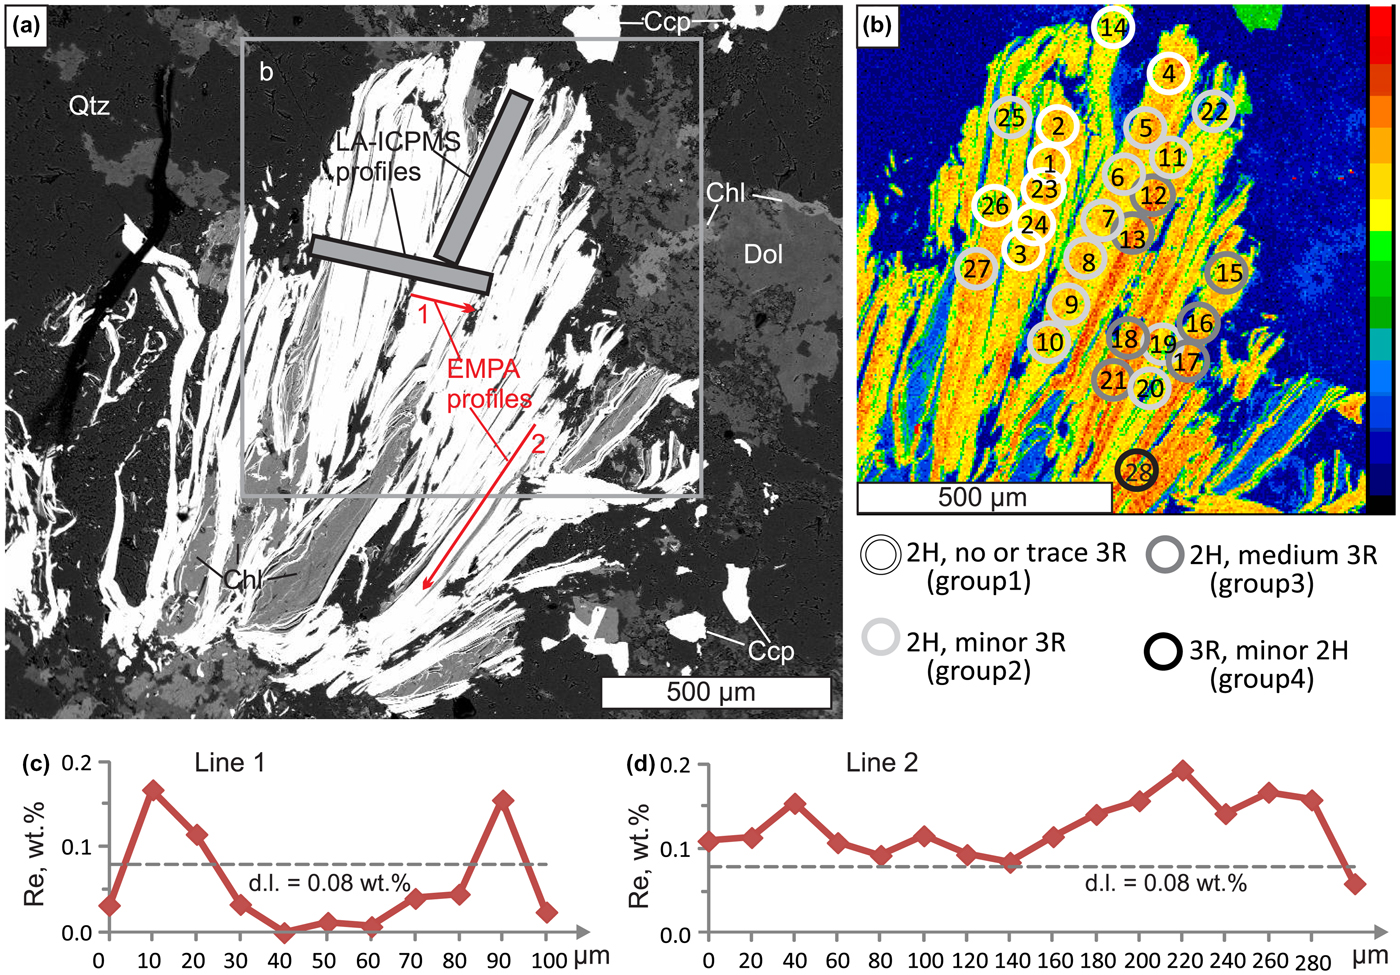
Molybdenite from sample Z-1461/164.5 showing the position of EMPA profiles and μXRD spot analyses (note that the effective area of μXRD analysis is larger and shown schematically). (a) Back-scattered electron image; (b) ReLα X-ray map, (c) and (d) variation of Re contents along EMPA profiles.
Sample Bir-1101/291.2 comes from the Birgilda porphyry copper sub-economic deposit, also in Chelyabinsk Oblast (54°59′47″N, 61°5′17″E). Its geology as well as molybdenite assemblages and trace-element geochemistry (studied by EMPA and LA-ICPMS) were described by Plotinskaya et al. (Reference Plotinskaya, Abramova, Groznova, Tessalina, Seltmann and Spratt2018a). The sample is aphyric basalt with pervasive chlorite alteration, numerous epidote–pyrite stringers and veinlets of white quartz with large pyrite nests and small nests of molybdenite. Molybdenite is present as aggregates of irregularly oriented flakes (Figs 2 to 4). Individual flakes are from 10 to 80 µm across and 50 to 150 µm long, intergrown with quartz, pyrite, epidote, albite, K-feldspar and chalcopyrite (Plotinskaya et al., Reference Plotinskaya, Abramova, Groznova, Tessalina, Seltmann and Spratt2018a).
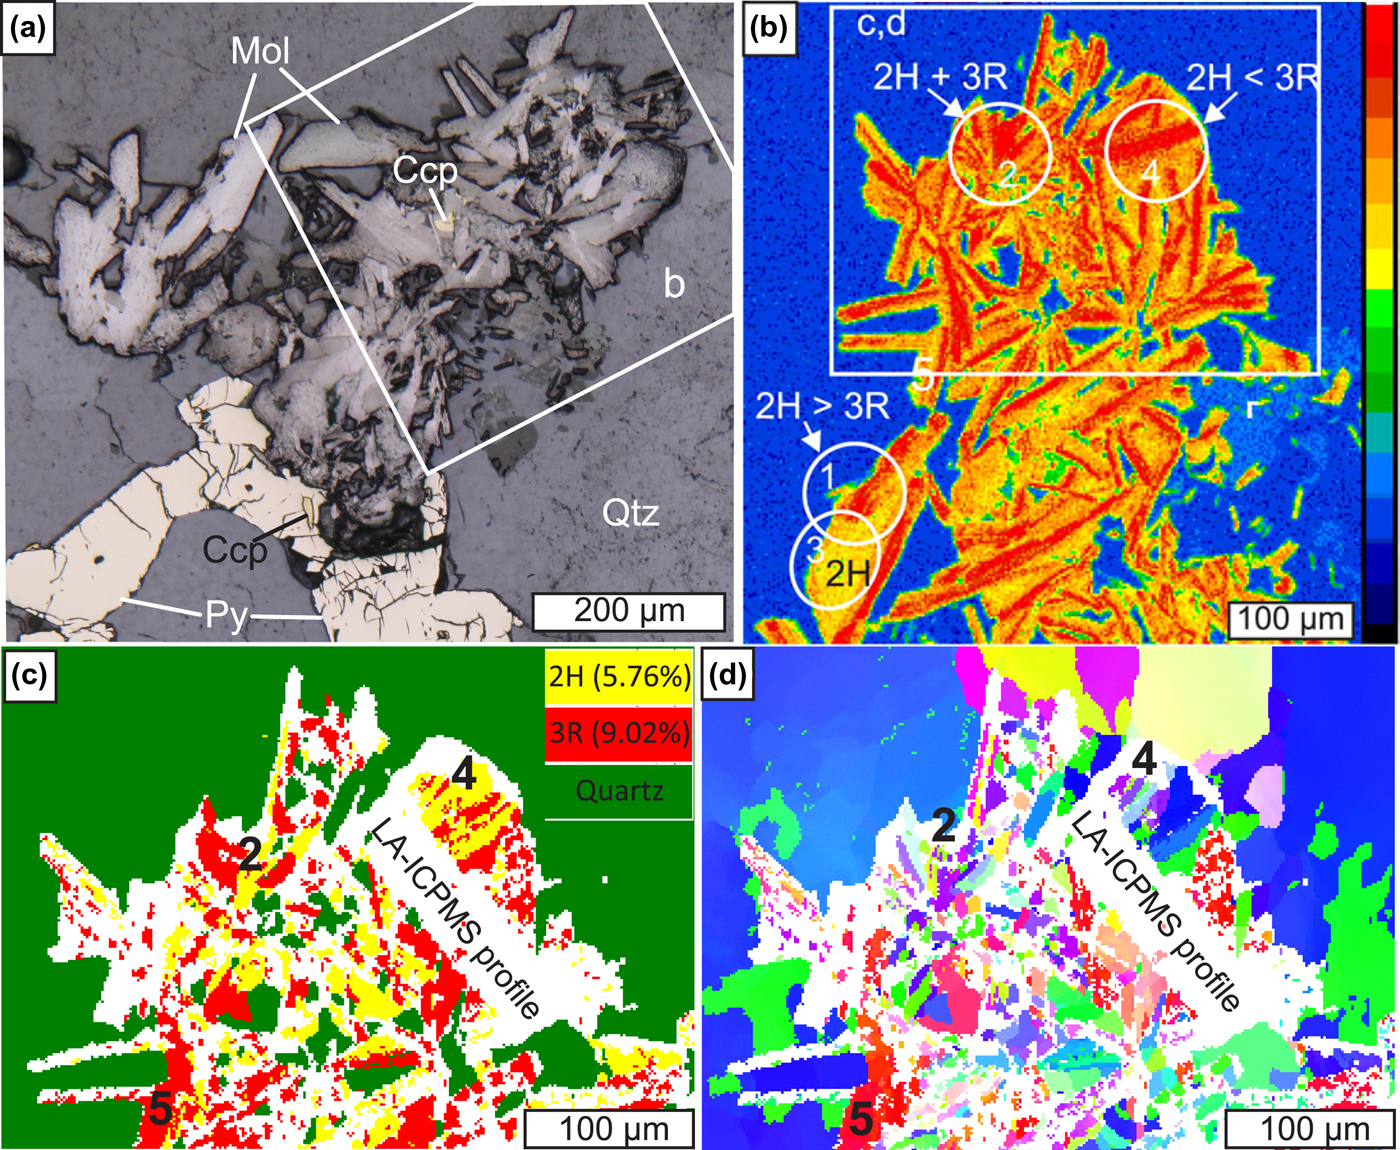
Molybdenite from sample Bir-1101/291.2, site 1. (a) and (b) modified after (Plotinskaya et al., Reference Plotinskaya, Abramova, Groznova, Tessalina, Seltmann and Spratt2018a). (a) Molybdenite (Mol) intergrown with pyrite (Py) and chalcopyrite (Ccp) in quartz (Qtz), reflected light; (b) enlarged part of (a), ReLα X-ray map, circles show μXRD analyses; (c) and (d) EBSD data (1.5 µm step): (c) phase map showing the distribution of 2H and 3R polytypes; (d) inverse-pole figure map showing different orientations in colours relative to the X 0 direction.
Electron microprobe analysis
The EMPA study was performed with a JEOL JXA-8200 electron microprobe equipped with five wavelength-dispersive (WDX) spectrometers at the ‘IGEM-Analitika’ shared analytical centre, Moscow, Russia (analysts: E.V. Kovalchuk and V.I. Taskaev). The operating conditions were: beam diameter 1 µm, accelerating voltage 20 kV and beam current 20 nA. Counting times were: 10 s for Mo, S and Se; 30 s for W; and 50 s for Re. Analytical lines were ReMβ, MoLα, WLα, SeLα, and SKα. The following standards were used: MoS2 (Mo and S), metallic rhenium (Re), scheelite (W) and CdSe (Se). The ZAF procedure within the JEOL software was used for matrix correction. The detection limits (3σ) were 0.08 wt.% for Re and Se, and 0.09 wt.% for W. Calibrated maps of Re contents were obtained with the following conditions: 20 kV (acceleration voltage), 20 nA (beam current) and 200 ms (dwell time) per spot. Non-calibrated X-ray maps of the sample Z-1461/164.5 were obtained using a Cameca SX-100 electron microprobe with five WDX spectrometers (Natural History Museum, London, UK) using ReLα, ReMα, MoLα, SKα, CaKα, SiKα, FeKα and ZnKα analytical lines.
Micro X-ray diffraction study
The micro X-ray diffraction study was performed using a Rigaku Rapid II micro-diffraction system, equipped with a Cu X-ray source, a carbon monochromator, a 2D curved image plate detector and an adjustable XY stage (Natural History Museum, London, UK). X-ray diffraction patterns were collected using a 30 µm X-ray beam collimator. The effective area of the μXRD analysis depended on the sample orientation to the beam. Stage oscillation about the ω axis (20–27°2θ) and spinning about the ϕ axis produced a maximum beam footprint of 90 µm on the sample. The polytype proportion was estimated using the integrated intensity ratio of peaks at 39.5 and 41.1°2θ, respectively 103 and 015 for 2H and 3R. These peaks were selected because they are intense, well separated, and fitting of the areal intensities is not much affected by peak overlap. As peak intensities can vary because of non-ideal diffraction conditions the obtained 3R/2H ratios should be considered semi-quantitative.
Electron back-scatter diffraction study
All samples were treated previously with Ar plasma via Oxford IonFab300 plasma etcher (10 min exposure, 500 V accelerating voltage and 200 mA beam current) at the SPbU, ‘Nanophotonics’ centre (Saint-Petersburg, Russia). The electron back-scatter diffraction study was carried out with a Hitachi S-3400N electron microscope equipped with Oxford NordlysNano EBSD detector at the SPbU, ‘Geomodel’ centre (Saint-Petersburg, Russia). Operating conditions were: 30 kV (accelerating voltage), 1 nA (beam current) and 0.5 s (dwell time), giving a diffraction pattern (Kikuchi image) of 1344 × 1024 pixels. All the acquired Kikuchi images were processed automatically with AZtecHKL software (Oxford Instruments) and compared to theoretical images generated from molybdenite-2H and -3R structural data (Persson, Reference Persson2014, Reference Persson2016). Best fit to the experimental data was chosen in a competitive mode. Noise reduction was performed, phase and orientation maps as well as pole figures were created using Oxford Channel5 software.
Results
Electron microprobe analysis
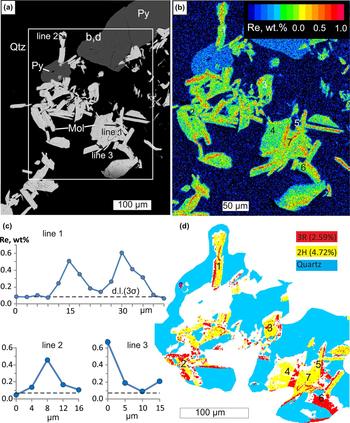
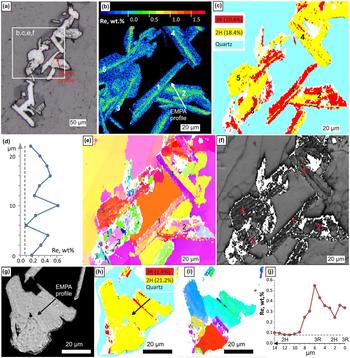
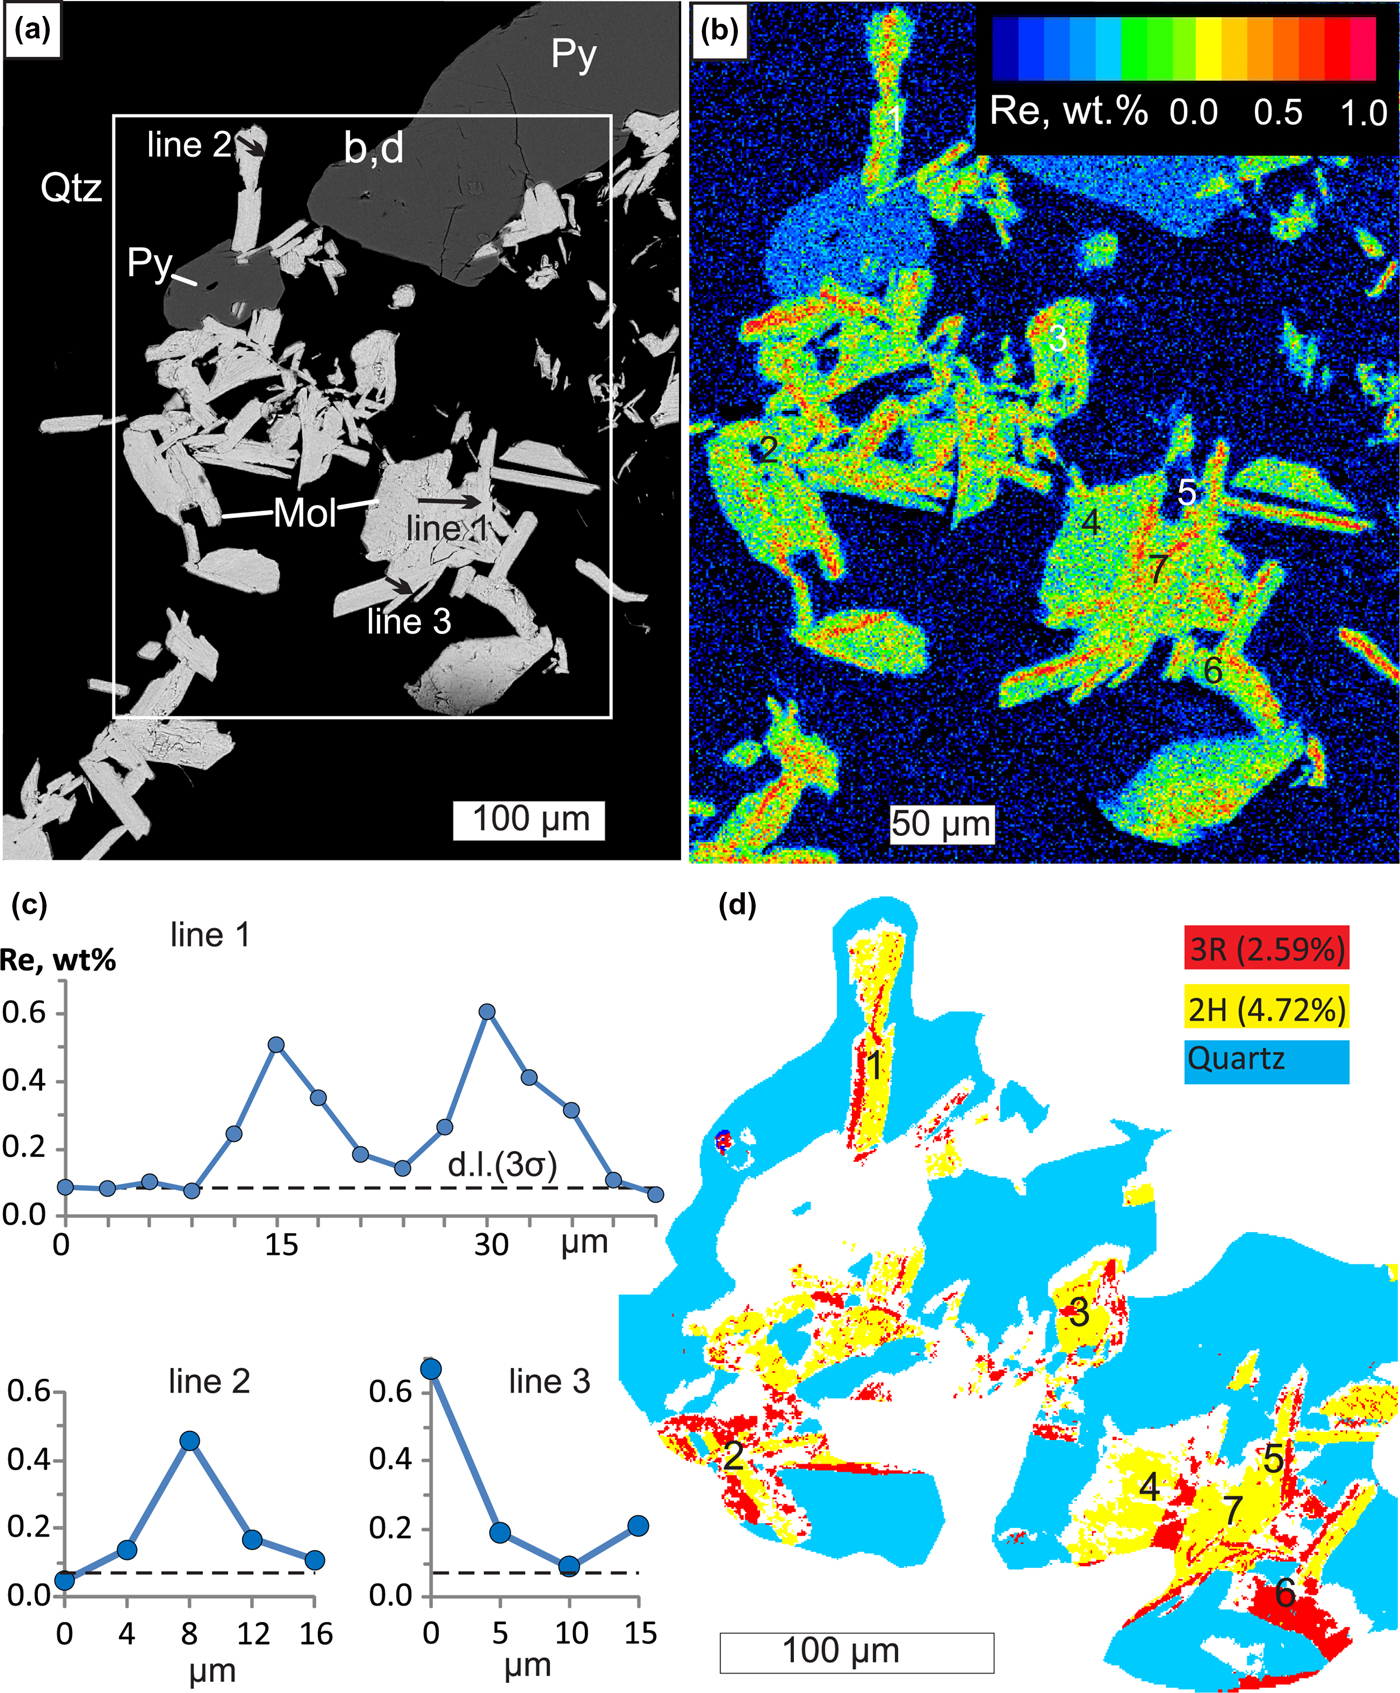
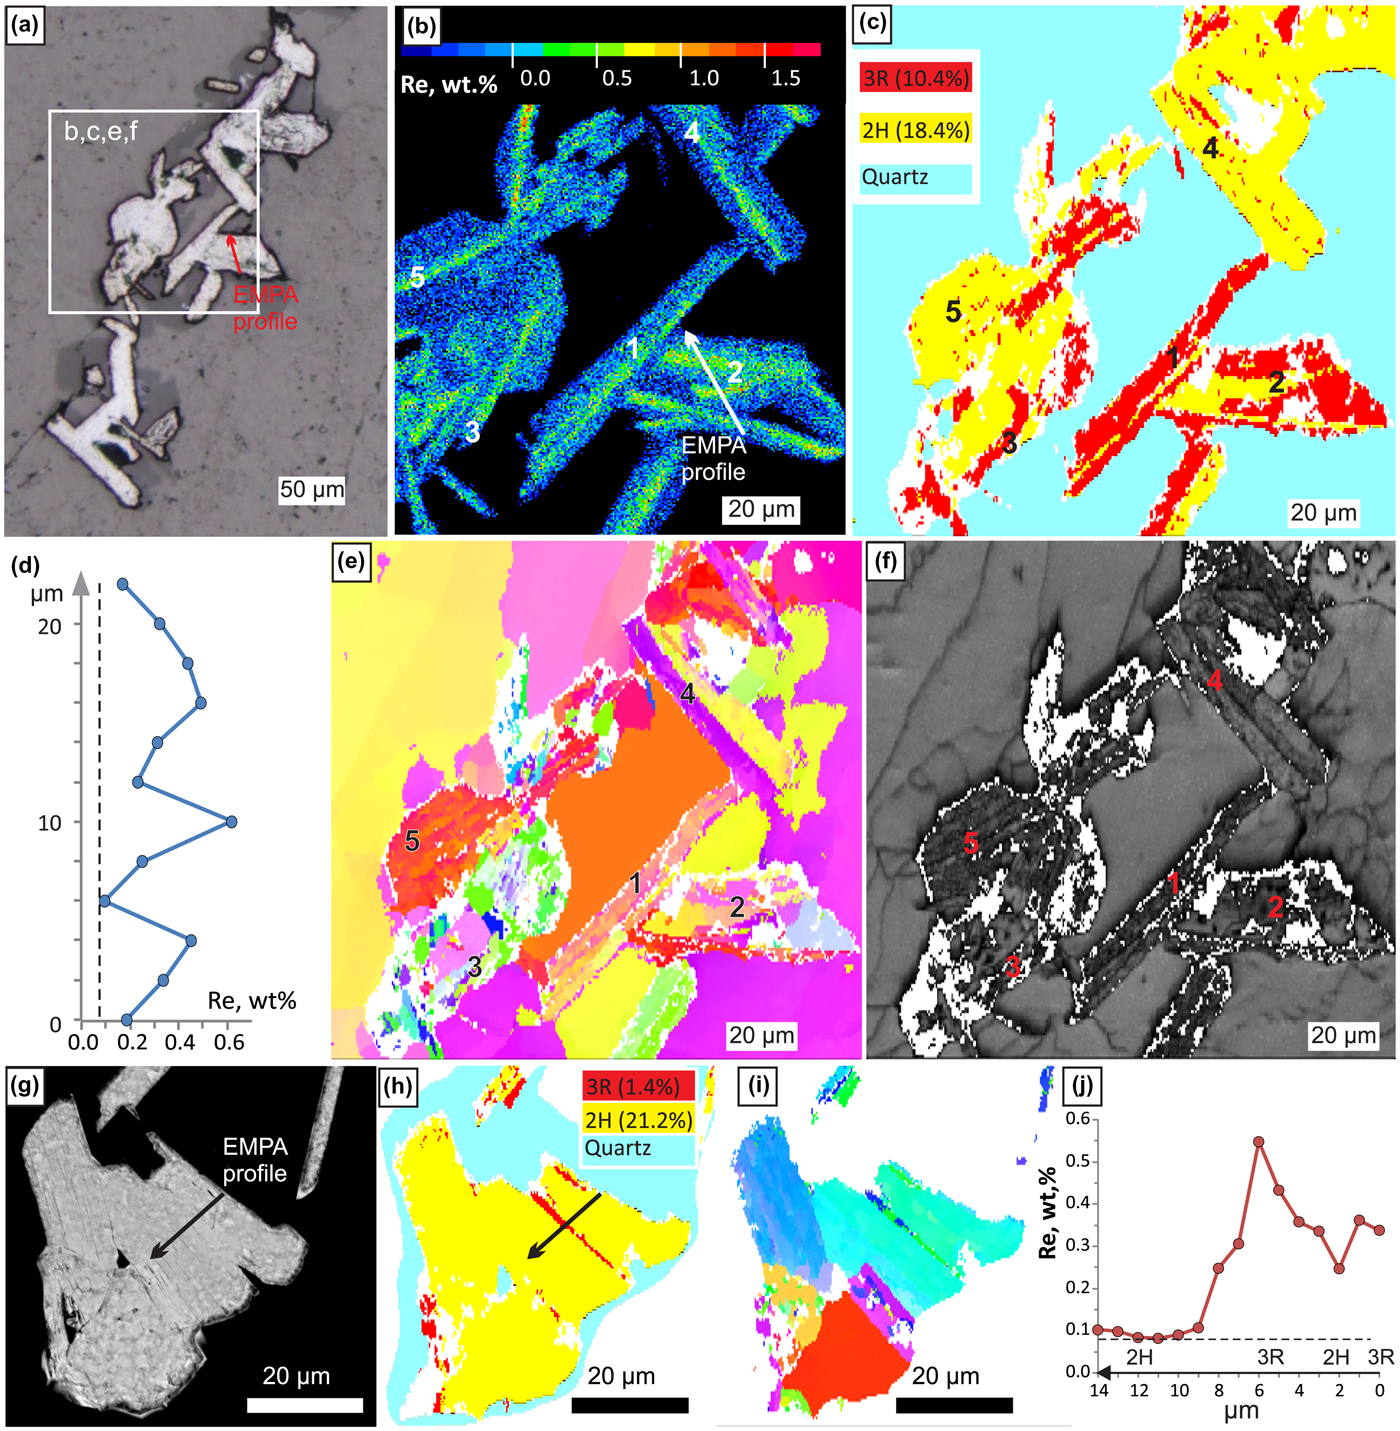
In all sites of the two samples studied, X-ray mapping revealed Re-enriched zones from several μm to tens of μm wide and up to hundreds of μm long. Such zones are confined to either axial or marginal parts of molybdenite flakes and are always parallel to the elongation of molybdenite flakes (Figs 1b, 2b, 3b and 4b). Analysed points (Figs. 1c,d, 3c, 4d,j, Appendix 1, see supplementary data below) show Re contents from 0.15 to 0.4 wt.% (sometimes up to 0.6 wt.%) within such zones and from below detection limit (b.d.l.) to 0.1 wt.% of Re outside of them. Our previous studies of the site 1 sample Bir-1101/291.2 (Plotinskaya et al., Reference Plotinskaya, Abramova, Groznova, Tessalina, Seltmann and Spratt2018a) revealed similar results with up to 1.1 wt.% of Re. Tungsten and Se contents are below the detection limit in both samples studied.
Molybdenite from sample Bir-1101/291.2, site 2. (a) Molybdenite intergrown with pyrite in quartz, backscattered electron image; (b) calibrated map of Re content (wt.%); (c) EMPA profiles; (d) EBSD phase map (0.5 µm step) showing the distribution of 2H and 3R polytypes.
Molybdenite from sample Bir-1101/291.2, site 3 (a–f) and site 4 (g–j). (a) Molybdenite in quartz, reflected light; (b) enlarged part of (a), calibrated map of Re content (wt.%); (c) EBSD phase map (0.5 µm step) showing the distribution of 2H and 3R molybdenite; (d) EMPA profile; (e) inverse pole figure map showing different orientations in colours relative to the Y 0 direction; (f) band contrast map; (g) back-scattered electron image; (h) EBSD phase map (0.25 µm step) showing the distribution of 2H and 3R polytypes; (i) IPF map showing different orientations in colours relative to the Z 0 direction; and (j) EMPA profile.
Micro X-ray diffraction data
Twenty eight analyses were obtained for sample Z-1461/164.5. The analysis locations are shown on the Fig. 1b. Based on 3R to 2H polytype proportion the XRD patterns were sorted into four groups: group 1 where only traces or no 3R polytype were detected (8 spots), group 2 with a 3R/2H ratio 0.07 to 0.25 (12 spots), group 3 with a 3R/2H ratio 0.3 to 1.2 (7 spots), and one spot with 3R/2H = 3.6 (Appendix 2).
For sample Bir-1101/291.2 four XRD patterns were collected only from site 1. Both 2H and 3R polytypes are present in areas 1, 2 and 4 (Fig. 2b). In the latter area the 3R polytype is predominant, while area 3 contains mostly the 2H polytype (Appendix 2).
Electron back-scattered diffraction data
Phase maps (Figs 2c, 3d, 4c and h) show that in all four sites of sample Bir-1101/291.2 molybdenite is represented by both 2H and 3R polytypes. In site 1, the 3R polytype dominates over 2H (9% and 5.8% respectively) while in sites 2, 3 and 4 the 3R polytype is less abundant than 2H (2.6 and 4.2% within site 2, 10.4 and 18.4% within site 3 and 1.4 and 21.2% within site 4 respectively). The inverse pole figure (IPF) maps of crystal orientations show no predominant colour in all four sites (Figs 2d, 4e,i), implying that molybdenite flakes do not have a crystallographic preferred orientation.
Discussion
Note on data quality
It has been noted earlier (Shilovskikh et al., Reference Shilovskikh, Plotinskaya and Lozhkin2019) that previous sample treatment, especially LA-ICPMS analysis and, to a lesser degree, X-ray mapping, reduces the quality of EBSD maps. Indeed, the EBSD map of site 1 sample Bir-1101/291.2 was obtained after X-ray mapping and LA-ICPMS analysis (Plotinskaya et al., Reference Plotinskaya, Abramova, Groznova, Tessalina, Seltmann and Spratt2018a) and this resulted in a lower quality of both phase map (Fig. 2c) and IPF map (Fig. 2d) due to the high portion of non-indexed areas (white colour on Fig. 2c,d). In sites 2, 3 and 4, where EBSD data were collected before X-ray mapping, the EBSD maps show an improved quality (Figs 3d, 4c,e,h,i).
On the contrary, μXRD data collected after X-ray mapping and LA-ICPMS analysis in both samples studied are not affected by any previous treatment. Moreover, good quality XRD patterns were obtained directly from laser traces (e.g. spots 4 to 7 on Fig. 1b). The individual intensities of most peaks in the patterns match well with the reference lines. This indicates that the data obtained can be treated identically to conventional powder data and that peak intensities as well as peak ratios are suitable for comparison.
Correlation between Re content in molybdenite and abundance of the 3R polytype
In sample Bir-1101/291.2 the highest Re content (0.3 to 1.1 wt.%) was reported within site 1 where EBSD data showed the dominance of the 3R polytype (Fig. 2c). In sites 2 and 3, where 2H is almost twice as abundant Re contents are mostly from b.d.l. to 0.4 wt.% and occasionally up to 0.6 wt.% (Figs 3 and 4b–d). μXRD revealed the same within site 1, where area 3 is featured by the lowest Re content and an absence of 3R polytype (Fig 2b and c). This means the abundance of 3R polytype and Re content correlate in different sites within a sample scale.
Within a grain scale, as observed in sample Z-1461/164.5 (Fig. 1b), zones with elevated Re contents are composed either of 3R polytype (e.g. spot 28) or of both 3R and 2H polytypes in variable ratios.
In sample Bir-1101/291.2 a comparison of Re X-ray maps and EBSD phase maps show in most cases that Re-enriched zones are composed of the 3R polytype. Perfect coincidence between 3R polytype and zones with elevated Re contents can be observed in the site 1, areas 4, 2, and 5 (Fig. 2b and c), site 2, areas 1 to 6 (Fig. 3b and d), site 3, areas 1 to 3 (Fig. 4b and c) and in site 4 (Fig. 4 h–j).
Sometimes however no 3R polytype was detected in Re-rich molybdenite. These are: site 2, area 7 (Fig. 3b and d) and site 3, areas 4 and 5 (Fig. 4 b,c,e,f). One may suppose that in some cases the 3R polytype bands were thinner than the EBSD step size (0.25 to 1.5 µm) and were missed during mapping. For example, a transmission electron microscopy study by Kovalenker et al. (Reference Kovalenker, Trubkin, Abramova, Plotinskaya, Kiseleva, Borisovskii and Yazykova2018) identified nanometre-sized interlayers of 3R polytype in 2H molybdenite. Some ‘noise’ in areas 4 and 5 of site 3 (Fig. 4c) indirectly supports this suggestion. In site 3, area 4 however a Re-rich ‘band’ is confined to a grain boundary which can be seen both on the orientation map and the band contrast map (Fig. 4 e,f). In area 5 (site 3) very small grains mis-orientated relative to the Y 0 direction can be observed (Fig. 4e). On the band contrast map (Fig. 4f) however area 4 represents a patch of parallel molybdenite grains. This suggests elevated Re contents in 2H molybdenite are confined to grain boundaries.
Summary
A combination of EMPA, μ-XRD and EBSD methods show that in most cases zones with an elevated Re content are composed of 3R-polytype molybdenite; in rare cases such zones are confined to boundaries of 2H-polytype molybdenite flakes.
The most appropriate tool to distinguish different polytypes within a single grain of molybdenite is EBSD. It is however sensitive to previous treatment such as X-ray mapping and LA-ICPMS. μXRD is less informative because of the large beam size but, it is useful for the preliminary evaluation and selection of grains for further investigation. Moreover, the data quality of μXRD is much less affected by any previous treatment and it can be applied after X-ray mapping and LA-ICPMS analysis.
Acknowledgments
This study was supported by the IGEM RAS basic project, by the Russian Foundation for Basic Research, Project No 19-05-00254, and by the NHM, London (via the CERCAMS Fellowship Program). RS acknowledges funding under NERC Grant NE/P017452/1 ‘From arc magmas to ores (FAMOS): A mineral systems approach’. V.I. Taskaev (IGEM RAS) is thanked for EMPA analysis, M. Lozhkin (‘Nanophotonics’ centre) is acknowledged for assistance with Ar plasma etching. The manuscript benefited from constructive comments by two anonymous reviewers.
Supplementary material
To view supplementary material for this article, please visit https://doi.org/10.1180/mgm.2019.49