




No CrossRef data available.
Article contents
Eye fluke-induced cataract formation in fish: quantitative analysis using an ophthalmological microscope
Published online by Cambridge University Press: 14 September 2004
Abstract
We examined the parasite-induced cataract formation in rainbow trout (Oncorhynchus mykiss) using slit-lamp microscopy to determine the relationship between cataract intensity and number of Diplostomum spathaceum parasites that were established in the lens. Cataract intensity increased significantly with parasite burden, but was also affected by the pattern of exposure to the parasite cercariae. The slit-lamp methodology proved useful in scoring the cataracts since it provides a 3-dimensional view into the lens and gives an actual picture of the location and intensity of the cataracts, which allows detailed investigations of mechanisms underlying cataract formation in various fish species. Potential applications of the method in fish farming and parasitological studies are discussed.
Keywords
Information
- Type
- Research Article
- Information
- Copyright
- 2004 Cambridge University Press
INTRODUCTION
Modern, intensive fish farming produces increasing amounts of fish for human consumption, stocking purposes and recreational use. However, the cultivation of fish in high densities attracts a variety of parasites, which pose threats to the health and viability of fish (e.g. Rintamäki-Kinnunen & Valtonen, 1996, 1997; Hakalahti & Valtonen, 2003). Although most diseases can be prevented or controlled by applying specified farming methods or drugs, some parasites have managed to persist and can cause occasional or recurrent outbreaks in farms (see above references). An important issue in fish farming has been how these infections affect the viability of fish, both in the farming conditions and after stocking into natural habitats. In macroparasites, which tend to affect their hosts in an intensity-dependent manner (e.g. Crowden & Broom, 1980; Lafferty & Morris, 1996), quantification of the parasite load above which harmful effects of infection begin to appear is an important aspect. In this paper, we focused on the effects of the trematode parasite Diplostomum spathaceum, which infects the lens of the fish eye and causes widespread problems at fish farms.
Diplostomum spathaceum is a common parasite of freshwater and brackish water fish (Valtonen & Gibson, 1997; Valtonen, Holmes & Koskivaara, 1997) and utilizes 3 hosts within its life-cycle: fish-eating birds, aquatic snails and fish. The parasite is transmitted from snail to fish as cercariae, which penetrate the fish epithelium and migrate into the lens where they develop into metacercariae (Chappell, Hardie & Secombes, 1994). Metacercariae are known to induce cataracts due to metabolic excretions and mechanical destruction of the lens structures (Shariff, Richards & Sommerville, 1980). Indeed, several studies have reported white and opaque appearance of the eye lens associated with heavy infections in fish (e.g. Ferguson & Hayford, 1941; Shariff et al. 1980; Karvonen, Seppälä & Valtonen, 2004b), but the relationships between parasite abundance and cataract intensity have not been investigated in detail. This is because effective techniques for studying parasite-induced cataract intensity have been lacking. There is, however, an apparent need for detailed information on these aspects since the parasite is frequently found in cultured fish (Stables & Chappell, 1986; Field & Irwin, 1994) causing economic losses to the industry in terms of reduced growth rate, fish morbidity and mortality (Bauer, 1961; Brassard, Rau & Curtis, 1982; Buchmann & Uldal, 1994). Recently, the parasite has also been shown to increase fish susceptibility to predation (Seppälä, Karvonen & Valtonen, 2004).
The lens of the fish eye is accessible without dissection using specialized slit-lamp microscopy in which a narrow slit of light is directed into the lens to give a 3-dimensional view of the lens. The method has been widely used in ophthalmology such as in scoring non-parasitic cataracts from fish (Bjerkås et al. 1996; Wall & Bjerkås, 1999; Schlotfeldt & Wegener, 2000) and it has recently been applied also in parasitological studies examining eye fluke infections and cataracts from living fish (Karvonen et al. 2004a,b). The aim of the present study was to determine the relationship between D. spathaceum burden in fish and cataract intensity. Using rainbow trout (Oncorhynchus mykiss) as a model fish species, we employed 2 infection procedures, gradual exposure in natural conditions and a single exposure in laboratory conditions, to produce fish with cataracts.
MATERIALS AND METHODS
Exposure in natural conditions was conducted in a 150×100×100 cm cage, placed in a densely vegetated littoral zone of Lake Konnevesi in Central Finland, where the snail intermediate host of the parasite had earlier been observed. A group of 160 rainbow trout (Oncorhynchus mykiss), aged 1 year with a low-level initial infection with the parasite [infection prevalence=85·0%, mean parasite load=1·3±0·2 (all figures indicate mean±S.E. unless otherwise indicated)], was obtained from a local commercial fish farm and maintained in indoor tanks for 39 days before the experiment. Fish were introduced to the cage on 10 June 2002 and a sample of 20 fish was then taken from the cage every 14 days until day 112 of the experiment, when all remaining fish were examined. Mean water temperature was 17·9±0·3 °C during the experiment. At each sampling time, fish were brought to the laboratory where they were killed with MS-222 and immediately studied with the slit-lamp microscope (Kowa portable SL-14) to determine the intensity of parasite-induced cataract. Intensity of the cataract was assessed as: 0=no cataract, 1=cataract covering horizontally <50% of the lens area, 2=cataract covering <100%, 3=cataract covering 100% and 4=cataract covering 100% and lens appearing totally opaque and white. Both lenses from the fish were then dissected to determine the precise number of parasites. Only morphologically fully developed metacercariae (see Sweeting, 1974) were considered, since previous experiments had shown that those parasites were responsible for cataract formation (Seppälä et al. unpublished observations). The vitreous body of the eye was not examined since we were only interested in cataract formation in the lens. Fish were fed every second day with commercial fish pellets and the mean length of the fish increased from 203·7±1·5 mm to 225·5±1·2 mm during the experiment.
Exposure in the laboratory was performed in 4 indoor tanks on 25 June 2001. Fifty, 1-year-old rainbow trout, originating from the same fish farm and having a low-level of infection (infection prevalence=100%, mean parasite load=7·8±0·6), were placed in each tank. Prior to the exposure, fish had been maintained in similar tanks in larger groups for 40 days. Parasite cercariae, which were identified by the distinctive right-angle resting position of the cercariae (Niewiadomska, 1986), were obtained from 20 naturally infected Lymnaea stagnalis collected from a pond of a fish farm in Central Finland. The same source of infected snails has also been used in our previous studies (e.g. Karvonen et al. 2003, 2004b). Cercarial density in the combined suspension from the snails was estimated from 10×1 ml subsamples. The infection dose of 400 newly emerged cercariae per fish (total 20000 cercariae per tank) was then introduced into each tank corresponding to a density of 80 cercariae l−1. The infection time was 30 min, during which the incoming water in the tanks was turned off and tanks were aerated using aquarium pumps. In our earlier studies we have not observed any cataract formation in fish in association with factors other than D. spathaceum infection in the lens. For example, long-lasting (2–4 months) maintenance of totally naïve or low-level infected rainbow trout in conditions identical to this experiment evoked no cataract formation in fish (Seppälä et al. 2004). This is why we did not include control tanks with unexposed fish in this experimental design.
After the infection, water volume in the tanks was brought up to 1300 l for the rest of the experimental period. Water temperature was 15·6 °C during the exposure and mean water temperature during the experiment was recorded as 15·6±0·3 °C. Tanks were illuminated from above with fluorescent lights according to natural dark–light rhythm. Ten randomly chosen fish were taken from all 4 tanks at 2, 29, 58, 86 and 119 days post infection (p.i.). Fish were examined for cataract intensity and parasite numbers as described previously. It should be noted that metacercariae have not been found in other parts of the eye in association with similar infections in our preliminary experiments. Fish were fed every 2nd day with commercial fish pellets and the mean length of the fish increased from 218·9±2·4 mm to 263·1±3·9 mm during the experiment. Statistical analyses were performed using ANOVA or non-parametric tests when requirements of equal variances and data normality could not be met.
RESULTS
In the lake system, parasite numbers in fish held in the cage increased gradually with time as a result of natural infection (ANOVA on log-transformed data: F7,156=95·05, P<0·001; Fig. 1). Cataract intensity was low at the beginning of the experiment when 42·5% of the eyes had no cataracts and 55% had few cataracts (<50% coverage). Cataract intensity then increased slowly and, at the end of the experiment, all eyes had cataracts with 27·5% of the eyes totally covered, and 7·5% totally opaque (Fig. 2).

Fig. 1. Number of fully developed Diplostomum spathaceum metacercariae in fish (sum for both lenses) (A) held in a cage in natural infection conditions and (B) exposed to experimental infection in laboratory conditions. Bars indicate mean±S.E. The solid line indicates ambient water temperature during the experiments.

Fig. 2. Development of parasite-induced cataract in the eyes of fish (A) held in a cage in natural infection conditions (data from every 2nd period is presented) and (B) exposed to experimental infection in laboratory conditions. Error bars indicate asymmetrical 95% confidence limits.
In the laboratory exposure, the average number of developed metacercariae in fish increased significantly from 7·8±0·6 (2 days p.i.) to 43·5±2·9 (29 days p.i.) as a result of the experimental exposure (ANOVA on log-transformed data: F7,72=267·15, P<0·001; Fig. 1) and the pattern of infection did not differ between the tanks (ANOVA: F7,72=0·39, P>0·7). Cataract intensity was low 48 h after the infection, when the newly established parasites were still undeveloped. However, cataract intensity increased rapidly as the parasites matured, and after 29 days, 37·2% of eyes had a complete cataract and 2·6% were totally opaque (Fig. 2). Cataract intensity remained stable thereafter (Fig. 2).
Comparisons between parasite numbers and cataract intensity in relation to pattern of exposure were made separately for the factors because of significant interaction. Cataract intensity increased with parasite burden in both infection procedures (Kruskall-Wallis: χ2=205·4, D.F.=4, P<0·001; χ2=218·0, D.F.=3, P<0·001, for the lake and laboratory exposure, respectively; Fig. 3). However, the pattern of cataract formation differed between the infection procedures in that the parasite numbers inducing the cataracts were lower in fish held in the lake compared to the laboratory infection (Mann–Whitney U-test between the infection procedures: Z=−3·243, P<0·01; Z=−6·265, P<0·001; Z=−2·297, P<0·05; Z=−1·368, P>0·1, for cataract intensities 1–4, respectively; Fig. 3).

Fig. 3. Number of Diplostomum spathaceum parasites per eye in fish exposed to natural and experimental infection in relation to cataract intensity. Bars indicate mean±S.E. NS, *, ** and *** denote statistical significance levels as non-significant, P<0·05, P<0·01 and P<0·001, respectively.
DISCUSSION
This paper examined the relationships between intensity of parasite-induced cataracts and number of Diplostomum spathaceum parasites in rainbow trout using slit-lamp microscopy. We found that cataract intensity was strongly dependent on the parasite burden such that this work provides a quantitative analysis of cataract development. The slit-lamp methodology enables cataract examination from living, anaesthetized fish (Karvonen et al. 2004b). However, since we also had to dissect the lenses in this study to determine the precise number of parasites, the cataract intensity was determined with the slit-lamp microscope from freshly killed fish prior to the dissection. We also used fish with low-level initial infection, which was acquired in the fish farm during the previous summer, approximately 1 year prior to the experiments. Fish were also maintained in tanks for 39–40 days before the experiments. This should be sufficient time for intensive cataracts to develop (see the Results section). However, the infection had caused no or only few cataracts in lenses – mainly small dots or thin thread-like formations although categorized as <50% cataract coverage (see discussion below on the precision of cataract determination) – by the beginning of the experiments. Therefore, we state that the initial infection had only a minor impact on the subsequent cataract formation.
Although D. spathaceum infection is known to have deleterious effects on fish (Crowden & Broom, 1980; Owen, Barber & Hart, 1993; Buchmann & Uldal, 1994; Seppälä et al. 2004), the role of parasite-induced cataracts in causing these effects has received very little attention (but see Seppälä et al. 2004). We suggest that cataracts probably have a major role in impairing the vision of fish and causing the harmful effects on fish. Although we did not determine these effects directly in this study, it is likely that the highest cataract intensities recorded (100% coverage and opaque lenses) influence the fish by reducing its vision. For instance, Seppälä et al. (2004) found that comparable cataract intensities caused a marked increase in the susceptibility of fish to predation. In this respect, our result suggests that the number of metacercariae in rainbow trout should probably not exceed 20 per eye if the harmful effects of the parasite are to be avoided.
However, fish species are known to differ in their susceptibility to D. spathaceum infection (e.g. Betterton, 1974; Sweeting, 1974; Speed & Pauley, 1984), which reflects different physiological performance of the parasite between host fish species. Therefore, it is likely that cataract development may also show species-specific differences. Rainbow trout are known to be highly susceptible to infection compared to other salmonids such as brown trout (Betterton, 1974) and, as indicated by the present results, the species also develops intensive cataracts as a result of the infection. We have also observed parasite-induced cataracts in salmon (Salmo salar) and whitefish (Coregonus lavaretus) in farming conditions (Karvonen et al. unpublished observations), but quantified analysis on cataract formation in these species is lacking. In addition to possible species-specific differences, cataract formation may also be related to the size of the fish, as more parasites may be needed to cause cataracts in larger fish because of the larger size and volume of the lens. For example, Owen et al. (1993) showed that only a few Diplostomum spp. metacercariae may be required to interfere with the vision of 3-spined sticklebacks. Although they did not consider the role of cataracts, it is probable that the effects caused by the low-level infection are due to the small size of the lens in sticklebacks (Owen et al. 1993). Therefore, it would be important to conduct studies using different fish species with varying sizes if, for instance, the effects of the parasite on other commercial fish species were to be evaluated.
We also found that cataract development differed between patterns of exposure; fish under natural exposure developed similar cataract intensities with lower parasite numbers compared to experimental infection. This is surprising since a high number of parasites concurrently penetrating the lens could be expected to elicit more damage leading to more severe cataract formation. In fact, the result suggests that the parasite is able to enter the lens with little damage, which is reasonable considering the relatively long development time of the metacercariae and subsequent transmission to the avian definitive host (see Seppälä et al. 2004). One possible explanation for the observed difference in cataract formation between the experiments is the slightly higher mean water temperature in the natural infection experiment compared to the laboratory infection (17·9±0·3 °C and 15·6±0·3 °C, respectively). Since the parasites cause cataracts through their metabolic activities, which are likely to be temperature dependent, higher temperature in natural conditions may have increased the metabolic rate of parasites leading to intensified cataract formation. Furthermore, the size of the fish in the natural infection was smaller at the end of the experiment compared to the laboratory experiment (ca. 38 mm difference in the mean length of fish), but we suggest that corresponding difference in the lens size was likely to be negligible and probably had no influence on the result with current infection intensities.
We found the slit-lamp microscopy particularly useful in studying parasite-induced cataracts as it provided an excellent 3-dimensional view into the lens allowing the determination of both thickness and location of the cataract within the lens. It was also possible to observe the lens without dissecting it, which gave a comprehensive and actual picture of the cataract. More importantly the method enables eye examinations from living, anaesthetized fish and thus the pattern of infection of individual, live fish can be followed (Karvonen et al. 2004a,b). Several studies have reported intensive cataracts in association with heavy eye fluke infections when the lens becomes distinctively opaque (Ferguson & Hayford, 1941; Shariff et al. 1980; Marcogliese et al. 2001; Karvonen et al. 2004b), which is visible by viewing the fish. However, our study shows that fish may already suffer from cataracts with lower parasite burdens when the cloudiness of the lens, and especially the cataract intensity, cannot be observed or determined reliably without a specialized microscope. In the present study we used a 5-step categorical scale to describe the cataract intensity, but suggest that even higher precision might be used, especially when including more detailed descriptions of the thickness and location of cataracts at lower intensities. The method also offers opportunities for detailed investigations into mechanisms underlying the development of parasite-induced cataracts in various fish species, both in farmed and natural fish populations. This has important implications for the fish farming industry where it is important to assess the ‘value’ of the infected fish with respect to growth rates at farms and survival probabilities after stocking to the wild using non-intrusive methods. Cataracts may also play an important role in impairing the vision of fish and increasing their susceptibility to avian predation (Seppälä et al. 2004), and studies examining these relationships could undoubtedly benefit from suitable methodology for precise determination of cataract intensity.
We thank Satu Paukku and Jani Hannula for their assistance in the experiments, Ellen Bjerkås for discussions on the slit-lamp microscopy, Peter Hudson and two anonymous referees for valuable comments, and Roger Jones for checking the English. The study was funded by the Biological Interactions graduate school, the Finnish Cultural Foundation and the SUNARE project of the Academy of Finland.
References
REFERENCES
BAUER, O. N. (1961).
Parasitic diseases of cultured fishes and methods of their prevention and treatment. In
Parasitology of Fishes (ed. Dogiel, V. A., Petrushevski, G. K. & Polyanski, Yu. I.), pp.
265–298.
Oliver & Boyd,
Edinburgh.
BETTERTON, C. (1974).
Studies on the host specificity of the eyefluke, Diplostomum spathaceum, in brown trout and rainbow trout.
Parasitology 69,
11–29.CrossRefGoogle Scholar
BJERKÅS, E.,
WAAGBØ, R.,
SVEIER, H.,
BRECK, O.,
BJERKÅS, I.,
BJØRNESTAD, E. &
MAAGE, A. (1996).
Cataract development in Atlantic salmon (Salmo salar L) in fresh water.
Acta Veterinaria Scandinavica 37,
351–360.Google Scholar
BRASSARD, P.,
RAU, M. E. &
CURTIS, M. A. (1982).
Infection dynamics of Diplostomum spathaceum cercariae and parasite-induced mortality of fish host.
Parasitology 85,
489–493.CrossRefGoogle Scholar
BUCHMANN, K. &
ULDAL, A. (1994).
Effects of eyefluke infections on the growth of rainbow trout (Oncorhynchus mykiss) in a mariculture system.
Bulletin of European Association of Fish Pathologists 14,
104–107.Google Scholar
CHAPPELL, L. H.,
HARDIE, L. J. &
SECOMBES, C. J. (1994).
Diplostomiasis: the disease and host–parasite interactions. In
Parasitic Diseases of Fish (ed. Pike, A. W. & Lewis, J. W.), pp.
59–86.
Samara Publishing Limited,
Dyfed.
CROWDEN, A. E. &
BROOM, D. M. (1980).
Effects of the eyefluke, Diplostomum spathaceum, on the behaviour of dace (Leuciscus leuciscus).
Animal Behaviour 28,
287–294.CrossRefGoogle Scholar
FERGUSON, M. S. &
HAYFORD, R. A. (1941).
The life history and control of an eye fluke.
Progressive Fish Culturist 54,
1–13.CrossRefGoogle Scholar
FIELD, J. S. &
IRWIN, S. W. B. (1994).
The epidemiology, treatment and control of diplostomiasis on a fish farm in Northern Ireland. In
Parasitic Diseases of Fish (ed. Pike, A. W. & Lewis, J. W.), pp.
87–100.
Samara Publishing Limited,
Dyfed.
HAKALAHTI, T. &
VALTONEN, E. T. (2003).
Population structure and recruitment of the ectoparasite Argulus coregoni Thorell (Crustacea: Branchiura) on a fish farm.
Parasitology 127,
79–85.CrossRefGoogle Scholar
KARVONEN, A.,
PAUKKU, S.,
VALTONEN, E. T. &
HUDSON, P. J. (2003).
Transmission, infectivity and survival of Diplostomum spathaceum cercariae.
Parasitology 127,
217–224.CrossRefGoogle Scholar
KARVONEN, A.,
HUDSON, P. J.,
SEPPÄLÄ, O. &
VALTONEN, E. T. (2004 a).
Transmission dynamics of a trematode parasite: exposure, acquired resistance and parasite aggregation.
Parasitology Research 92,
183–188.Google Scholar
KARVONEN, A.,
SEPPÄLÄ, O. &
VALTONEN, E. T. (2004 b).
Parasite resistance and avoidance behaviour in preventing eye fluke infections in fish.
Parasitology 129,
159–164.Google Scholar
LAFFERTY, K. D. &
MORRIS, A. K. (1996).
Altered behavior of parasitized killifish increases susceptibility to predation by bird final hosts.
Ecology 77,
1390–1397.CrossRefGoogle Scholar
MARCOGLIESE, D. J.,
DUMONT, P.,
GENDRON, A. D.,
MAILHOT, Y.,
BERGERON, E. &
McLAUGHLIN, J. D. (2001).
Spatial and temporal variation in abundance of Diplostomum spp. in walleye (Stizostedion vitreum) and white suckers (Catostomus commersoni) from the St. Lawrence River.
Canadian Journal of Zoology 79,
355–369.Google Scholar
NIEWIADOMSKA, K. (1986).
Verification of the life-cycles of Diplostomum spathaceum (Rudolphi, 1819) and D. pseudospathaceum Niewiadomska, 1984 (Trematoda, Diplostomidae).
Systematic Parasitology 8,
23–31.Google Scholar
OWEN, S. F.,
BARBER, I. &
HART, P. J. B. (1993).
Low level infection by eye fluke, Diplostomum spp., affects the vision of three-spined sticklebacks, Gasterosteus aculeatus.
Journal of Fish Biology 42,
803–806.Google Scholar
RINTAMÄKI-KINNUNEN, P. &
VALTONEN, E. T. (1996).
Gyrodactylus salaris at fish farms in northern Finland over a period of ten years.
International Journal for Parasitology 26,
723–732.CrossRefGoogle Scholar
RINTAMÄKI-KINNUNEN, P. &
VALTONEN, E. T. (1997).
Epizootiology of protozoans in farmed salmonids at northern latitudes.
International Journal for Parasitology 27,
89–99.CrossRefGoogle Scholar
SCHLOTFELDT, H. J. &
WEGENER, A. (2000).
Clinical screening for cataracts in rainbow trout and non-salmonid fish in traditional fresh water pond farming.
Bulletin of European Association of Fish Pathologists 20,
252–255.Google Scholar
SEPPÄLÄ, O.,
KARVONEN, A. &
VALTONEN, E. T. (2004).
Parasite-induced change in host behaviour and susceptibility to predation in an eye fluke – fish interaction.
Animal Behaviour (in the Press).CrossRefGoogle Scholar
SHARIFF, M.,
RICHARDS, R. H. &
SOMMERVILLE, C. (1980).
The histopathology of acute and chronic infections of rainbow trout Salmo gairdneri Richardson with eye flukes, Diplostomum spp.
Journal of Fish Diseases 3,
455–465.CrossRefGoogle Scholar
SPEED, P. &
PAULEY, G. B. (1984).
The susceptibility of four salmonid species to the eyefluke, Diplostomum spathaceum.
Northwest Science 58,
312–316.Google Scholar
STABLES, J. N. &
CHAPPELL, L. H. (1986).
The epidemiology of diplostomiasis in farmed rainbow trout from north-east Scotland.
Parasitology 92,
699–710.CrossRefGoogle Scholar
SWEETING, R. A. (1974).
Investigations into natural and experimental infections of freshwater fish by the common eye-fluke Diplostomum spathaceum Rud.
Parasitology 69,
291–300.CrossRefGoogle Scholar
VALTONEN, E. T. &
GIBSON, D. I. (1997).
Aspects of the biology of diplostomid metacercarial (Digenea) populations occurring in fishes in different localities in northern Finland.
Annales Zoologici Fennici 34,
47–59.Google Scholar
VALTONEN, E. T.,
HOLMES, J. C. &
KOSKIVAARA, M. (1997).
Eutrophication, pollution, and fragmentation: effects on the parasite communities in roach (Rutilus rutilus) and perch (Perca fluviatilis) in four lakes in central Finland.
Canadian Journal of Fisheries and Aquatic Sciences 54,
572–585.CrossRefGoogle Scholar
WALL, T. &
BJERKÅS, E. (1999).
A simplified method of scoring cataracts in fish.
Bulletin of European Association of Fish Pathologists 19,
162–165.Google Scholar
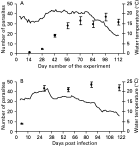
Fig. 1. Number of fully developed Diplostomum spathaceum metacercariae in fish (sum for both lenses) (A) held in a cage in natural infection conditions and (B) exposed to experimental infection in laboratory conditions. Bars indicate mean±S.E. The solid line indicates ambient water temperature during the experiments.
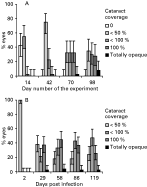
Fig. 2. Development of parasite-induced cataract in the eyes of fish (A) held in a cage in natural infection conditions (data from every 2nd period is presented) and (B) exposed to experimental infection in laboratory conditions. Error bars indicate asymmetrical 95% confidence limits.
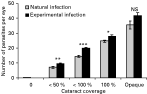
Fig. 3. Number of Diplostomum spathaceum parasites per eye in fish exposed to natural and experimental infection in relation to cataract intensity. Bars indicate mean±S.E. NS, *, ** and *** denote statistical significance levels as non-significant, P<0·05, P<0·01 and P<0·001, respectively.
 You have
Access
- 99
- Cited by