I. INTRODUCTION
Spectroscopy in the terahertz and sub-terahertz frequency range is currently possible with specialized laboratory instruments such as terahertz time-domain spectroscopy (THz-TDS) systems. With such instruments, a number of new applications have been demonstrated [Reference Siegel1] in the area of bio-chemistry, process control and security such as, e.g. bacteria detection [Reference Berrier2], and blood glucose concentration measurement [Reference Siegel, Tang, Virbila, Yanghyo, Chang and Pikov3]. To enable the broad application of terahertz and sub-terahertz spectroscopy in professional, e.g. medical and pharmaceutical industry and consumer applications, highly miniaturized and low-cost sensors will be required. Due to the required low-cost and high miniaturization of such new spectroscopic devices, a switch from THz-TDS to technologies such as CMOS and BiCMOS is highly desirable. Electronic spectrometers based on CMOS and BiCMOS technology have been presented [Reference Grzyb, Statnikov and Pfeiffer4, Reference Statnikov, Grzyb, Heinemann and Pfeiffer5]. However, the spectral range of these systems is typically limited to several narrow frequency bands. Continuous tuning over the frequency range from 210 to 305 GHz is demonstrated in [Reference Zhong, Choi, Miller, Henderson and Kenneth6]. Direct detection in 150-nm CMOS up to 4.3 THz in several frequency bands is presented in [Reference Boppel7]. In [Reference Berrier8] the authors presented a free space continuously tuneable, fully electronic broadband heterodyne spectrometer, based on non-linear transmission line technology (NLTL) [Reference Tripodi9–Reference van de Weide, Bostak, Auld and Bloom11] and its application to bacteria detection, but the frequency range was limited to 20 to 220 GHz. In [Reference Matters-Kammerer, Goor and Tripodi12] a heterodyne spectrometer, where the transmitter and receiver are both integrated on one 65-nm CMOS chip was presented by the authors. The current paper is an extension of [Reference Matters-Kammerer, Goor and Tripodi12], with more details on the design trade-offs of the Schottky diodes and transmission lines designs of the receiver as well as additional information on the combination of the receiver with broadband antenna's either on-chip or in a three-dimensional (3D) chip-scale package. Compared with [Reference Berrier8] the frequency range of the spectrometer presented in this paper is strongly extended to 20–480 GHz. The paper compares the full on-chip integration of the spectrometer for near-field spectroscopy to integration of the spectrometer with antenna's (on-chip or off-chip) which requires lenses and alignment between the transmitter and receiver. The extension of the frequency range for the near-field spectrometer as well as the improvement in signal to noise ratio over the free-space systems is discussed. In contrast to [Reference Grzyb, Statnikov and Pfeiffer4–Reference Zhong, Choi, Miller, Henderson and Kenneth6], the miniaturized THz spectrometer presented here allows full coverage of the terahertz frequency band up to 480 GHz.
Focus of this paper is the broadband sampler used in the receiver of the spectrometer. Further information on the broadband transmitter can be found in [Reference Tripodi9].
In Section II the design and layout of the on-chip spectrometer is presented with a focus on the high-speed sampling circuit. Section III shows time-domain and frequency-domain measurement results, Section IV shows two options for enabling the modules for free-space analysis and Section V presents the comparison to state-of-art and the conclusions.
II. DESIGN AND LAYOUT OF THE SPECTROMETER
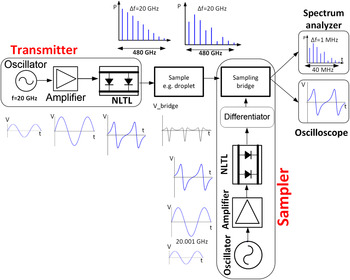
Figure 1 shows the system view of the spectrometer. The spectrometer is based on a similar principle as optical THz-TDS systems. The transmitter generates a signal that is extremely broadband which becomes apparent in its fast varying amplitude envelop over time. When it passes through a sample, this time-domain amplitude envelope is altered in a characteristic way due to the material's complex dielectric constant and thickness. The receiver is a sampling circuit, which measures the envelop of the signal in short time-intervals after it has passed through the sample. This envelope can be displayed on an oscilloscope (amplitude and phase information). The amplitude distribution over frequency can also be displayed on a spectrum analyzer. By comparing the measurement of a material under test to a reference measurement, e.g. without material, the dielectric constant of the sample can be extracted if the thickness of the material is known.
System view of the on-chip spectrometer. The output of the sampling bridge can be visualized in time and frequency domain on an oscilloscope or a spectrum analyzer. The graphs show the time-domain and frequency domain signal at various locations in spectrometer [Reference Matters-Kammerer, Goor and Tripodi12].

Based on a sine input signal of f in,transmit in the range of 6–20 GHz, the transmitter generates a broadband frequency comb with frequency components of multiples of the input frequency. The frequency multiplication is based on a non-linear transmission line, which was reported in [Reference Tripodi9]. As a transmission line is inherently a broadband structure, different input frequencies can be applied and will be frequency multiplied. In time-domain the sine signal is deformed to a sine-signal with a very fast falling edge.
The signal from the transmitter can pass through a sample, e.g. a micro droplet and forms the input signal to be analyzed by the sampler. The sample will change the amplitude and phase of each of the frequency comb components. To mimic the impact of a droplet, a 10 dB attenuator is inserted between the output of the source-NLTL and the input of the sampler. At the input of the sampler, a sine-signal of f in,transmit + Δf is applied, with Δf in the range of 10 kHz to about 1 MHz. In a second non-linear transmission line, this signal is generating a broadband frequency comb, where each component is shifted by n times Δf with respect to the components generated in the transmitter.
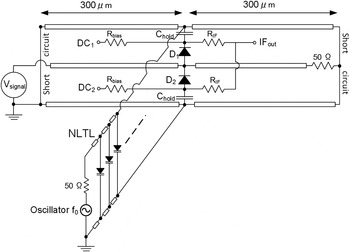
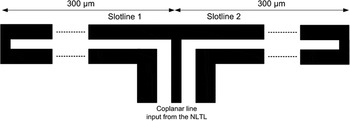
Figure 2 shows the schematic of the sampling circuit. The sampling circuit consists of three parts. A non-linear transmission line, a differentiator and a Schottky diode-based sample-and-hold circuit. The NLTL feeds its signal into two 300 µm long 100 Ω shorted slotline-stubs of the differentiator. Upon reflection at the shorted end of these arms the signal travels back with opposite polarity and superimposes to the original signal at the diode bridge. Thereby a voltage pulse is generated that opens the diode bridge during the sampling interval. The diodes of the bridge are biased such that the voltage spikes forward bias the diodes for a very short time interval only. When the diodes are conducting, the hold capacitors accumulate a certain amount of charge, representing the signal strength in that time interval.
Schematic of the time domain spectrometer [Reference Marsland, Valdivia, Madden, Rodwell and Bloom10–Reference Matters-Kammerer, Goor and Tripodi12].

In order to reach very high operating frequencies, the layout of the Schottky diodes is crucial.
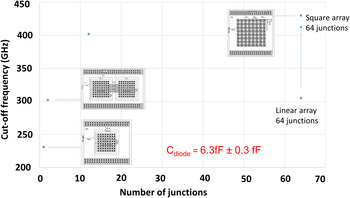
It has been optimized for high-speed operation. Various layouts have been compared for the RC-cutoff frequency [Reference Matters-Kammerer, Tripodi, van Langevelde, Cumana and Jansen13]. The junction speed has to be carefully separated from the much faster signal path through the stray capacitance of the tiny Schottky diodes. Based on the analysis presented in [Reference Matters-Kammerer, Tripodi, van Langevelde, Cumana and Jansen13], the trade-off between the cutoff frequency and the number of junctions is shown in Fig. 3. Each of the diode layouts has the same total junction area, resulting in a junction capacitance of 6.5 fF. For the slower diodes, the junction consists of one or a few (larger) junctions. For highest speed operation, a square array of 64 parallel diodes with minimum sized junction area was used and a junction RC-cutoff frequency of 430 GHz was reached.
RC-cutoff frequency of 65-nm CMOS Schottky diodes of 6.5 fF total junction capacitance with various electrode layouts [Reference Matters-Kammerer, Tripodi, van Langevelde, Cumana and Jansen13]. In the sampling bridge presented in this paper, the square array of 64 minimum sized diodes was used with a cutoff frequency of 430 GHz.

A second characteristic of the Schottky diodes, which is key for the optimum operation point of the sampler is the threshold voltage. In the sampler, the diodes are reverse biased most of the time. The very short voltage spikes generated from the signal of the non-linear transmission line with the help of the differentiator lead to a forward bias of the diodes. Therefore the bias voltage depends on the threshold voltage of the diodes and needs to be chosen such that they are forward biased only for a very short time interval.
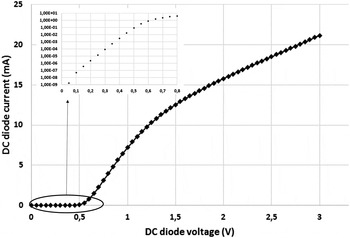
This optimum point has to be based on the Schottky diode's I–V curve as well as on the amplitude of the voltage spikes. The I–V curve of the diodes is shown in Fig. 4. The onset of significant current flow is around 0.5 V, with a threshold voltage of (0.39 ± 0.03) V [Reference Matters-Kammerer, Tripodi, van Langevelde, Cumana and Jansen13]. From transient simulation it was derived, that with an input power of 18 dBm at the non-linear transmission line, voltage spikes of about 0.4 V across the diode bridge are achieved. Thus DC biasing of the diodes is applied of about 0.4 V. The sum of the spikes and the DC bias will switch the diodes in forward direction for a short time interval.
Current-voltage characteristic of the Schottky diode used in the sampler. The inset shows the currents for the voltage interval between 0 and 0.8 V on a logarithmic scale for better visibility of the lower currents [Reference Matters-Kammerer, Goor and Tripodi12].

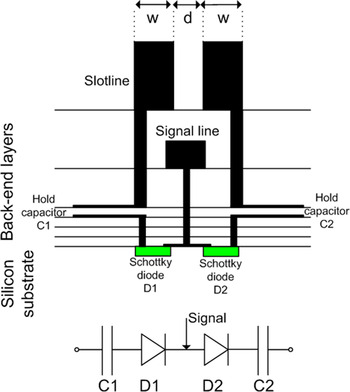
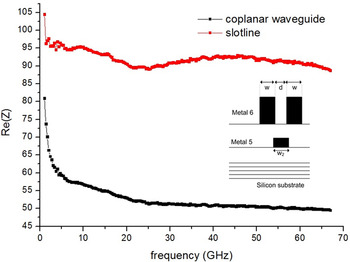
For proper functioning of the sampling bridge, the integration into the CMOS backend layers is crucial, especially for high-speed performance. Symmetry of the layout is required for accurate measurements. As shown in Fig. 5, the hold capacitors and the Schottky diodes are implemented above each other. With this layout minimum length interconnects and full symmetry is realised. The integration of the slotlines which form the differentiator arms is realized in the thick metal backend layer of the CMOS stack. The impedance of the NLTL is 50 Ω and the optimum slotline impedance for minimum reflection at the T-junction is therefore 100 Ω. This is achieved with slotlines of w = 2 µm linewidth and d = 6 µm line-to-line spacing. Superimposed to this slotline mode, the broadband signal from the transmitter is guided towards the diode bridge in the independent CPW mode. This mode uses the slotlines as ground and a line in a lower metal layer (Metal 5) as signal line, located in the symmetry plane of the two slotlines. The S-parameters of the coplanar line and the slotline are measured between 500 MHz to 67 GHz. The extracted impedances are shown in Fig. 6. Above 20 GHz the impedances are around 90 Ω for the slotline mode and 50 Ω for the coplanar waveguide mode, with low dispersion. Below 20 GHz the impedances show dispersion. As the goal of this structure is to analyse signals with frequencies typically beyond 20 GHz, the low frequency dispersion does not limit the circuit performance significantly. Thereby a very compact CMOS compatible geometry is achieved.
Cross-section of the integrated sampling bridge, showing the vertical connections between the transmission line and the metal-insulator-metal (MIM) capacitors as well as the connection between the capacitors and the Schottky diodes [Reference Matters-Kammerer, Goor and Tripodi12].

Measured impedance of the slotline and the coplanar waveguide. The inset shows the cross-section of the multimode transmission line structure. The slotline mode uses the two lines in Metal 6. The line in the Metal 5 layer is located in the horizontal symmetry plane. The coplanar waveguide mode uses the lines in metal 6 as ground and the line in the Metal 5 layer as signal line.

Transient simulations, including Spice models for the slotlines and coplanar waveguides extracted from electromagnetic simulations and circuit models for the Schottky diodes [Reference Matters-Kammerer, Tripodi, van Langevelde, Cumana and Jansen13] have resulted in an optimized slotlines stub length of 300 µm (Fig. 7).
T-junction between the 50 Ω coplanar waveguide from the non-linear transmission line and the slotlines of the sampler. The arm length between the junction and the short circuits on both sides has been optimized to 300 µm to reach maximum bandwidth of the sampler.

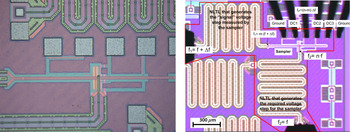
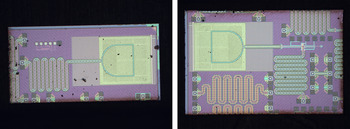
Figure 8 (left) shows a magnified photograph of the sampler. The 300 µm long arms of the differentiator are clearly visible as well as the hold capacitors, which are integrated into the backend layers. Furthermore the connection to the sampler's non-linear transmission line is shown from the bottom as well as the transmitter's non-linear transmission line from the left side. Figure 8 (right) shows the overview of the entire on-chip integrated spectrometer.
Left: photograph of the sampler. Right: photograph of the entire spectrometer. The NLTL on the left hand side is the transmitter, the one from below is part of the sampler and connects to the sampling bridge. The whole spectrometer requires about 3 mm2.

III. MEASUREMENT RESULTS
The characterization of the spectrometer is performed in time-domain as well as in frequency domain. The results for the non-linear transmission line in the frequency domain were already published in [Reference Tripodi9]. In this paragraph the time-domain characterization of the non-linear transmission line output waveform as well as time-domain and frequency-domain performance of the sampler are presented.
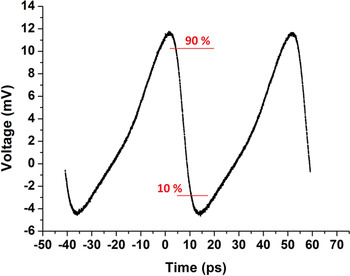
The output signal of the transmitter's non-linear transmission line is measured in the time-domain characterization. As described in paragraph II, the NLTL sharpens the falling edge of a sinusoidal input signal. The line itself is identical to the NLTL used in the sampler. A signal of 20 GHz with 18 dBm input power is connected to the input of the transmitter NLTL. At the input of the sampler NLTL an 18 dBm signal at 20 GHz + Δf is injected, with Δf equal to 1 MHz. The signals are generated by two Agilent signal generators type PSG E8257D time-synchronized by a 10 MHz reference signal. At the output of the sampler, the intermediate frequency (IF) contains frequency components of n times Δf, which are below 50 MHz. Thus the output can be connected to an oscilloscope and the 90–10% fall-time is measured. No intermediate buffer amplifier is used at the IF frequency in these measurements.
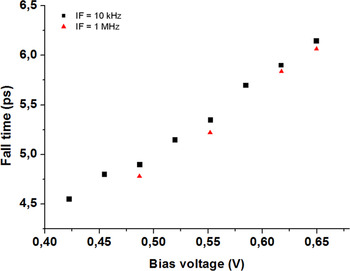
The measured fall-time at the IF frequency can then be translated to the original fall-time by multiplying with 20 GHz/Δf. As shown in Fig. 9 the measured waveform for 0.425 V bias of the diode bridge clearly shows that the falling edge of the signal is sharper than the rising edge. As discussed in the previous paragraph, the time-resolution of the sampler is a function of the bias voltage of the diode bridge. To assess this dependency, Fig. 10 shows the measured fall-time as a function of the bias voltage of the diode bridge. As expected, the measured fall-time is reduced for lower bias voltage of the diodes, because at lower bias voltage the voltage spikes forward-bias the diodes for a shorter time-interval than in the case that the diodes are biased closer to the threshold voltage. As the time-interval of forward biasing determines the time-resolution of the sampler, lower DC bias voltage enables more precise measurement of small fall-times. On the other hand, the very short time-interval that the diodes are conducting also leads to a very weak signal at the IF frequency. The minimum measured fall-time of the signal of T meas = 4.6 ps is an upper limit for the actual fall-time of the NLTL signal. It is the convoluted fall-time of the NLTL and the sampler response. Based on measurements with an electro-optical setup at the University of Siegen [Reference Jamshidifar, Spickermann, Schäfer and Haring Bolivar14], the fall-time T NLTL of the NLTL is 3.5 ps. The convoluted fall-time T meas is related to the NLTL fall-time T NLTL and the sampling-circuit rise-time T sampler by [Reference Tripodi9, Reference Marsland, Valdivia, Madden, Rodwell and Bloom10]:
 $$T_{{\rm measured}}^2 = T_{{\rm sampler}}^{\rm 2} + T_{{\rm NLTL}}^{\rm 2} + T_{{\rm jitter}}^{\rm 2} $$
Voltage envelope of the NLTL signal measured at the IF frequency range with an oscilloscope. The time-scale is translated to the original speed of the signal.

Convoluted fall-time as a function of the bias voltage for two values of the IF frequency offset between the two NLTL signals at the generator and sampler side. The bias voltage is the bias across the Schottky diodes of the sampling bridge.

In the case of negligible jitter a 3 ps sampler circuit rise time is estimated.
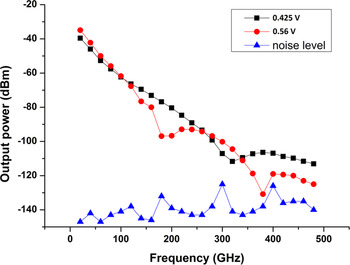
For the frequency domain analysis the 50 Ω impedance IF output of the sampler is connected to a spectrum analyser (Agilent PSA E4448A). Figure 11 shows the signal to noise ratio for 0.425 and 0.56 V DC bias voltage (Resolution bandwidth 1 Hz). The signal-to-noise ratio depends on the bias voltage of the diode bridge. As can be seen from Fig. 11, higher harmonics up to at least 480 GHz are generated from the initial 20 GHz signal at the input of the NLTL. Highest dynamic range is reached for the bias setting of 0.425 V, especially at frequencies beyond 350 GHz. Due to the shorter sampling window of the diode bridge at lower bias voltage, the fast changing envelope characteristics can still be distinguished, which is equivalent to improved high-frequency performance. Due to the non-linear generation method of the broadband signal in the NLTL, for both bias settings, the output power decays with frequency. In the spectrum of Fig. 11 also local minima are visible. These are not due to the NLTL signal itself, but due to the sampler transfer function. In the time domain the sampled signal s(t) is calculated from the product of the input signal f(t) and the sampling pulse p(t):
 $$s(t) = f(t) \times p(t).$$
Output power and noise power level of the spectrometer for 0.56 and 0.425 V sampler bias voltage (resolution bandwidth 1 Hz). The output spectrum of the NLTL contains only harmonics of the 20 GHz input frequency. Continuous lines are added as a guide for the reader. The output power of the spectrometer alone is 10 dB higher, as a 10 dB attenuator was inserted to mimic a real droplet sample. Over the measured frequency range the average noise power is about −140 dBm. The variation and especially the maxima of the noise power at 180, 300, and 400 GHz are not related to the spectrometer itself, but due to resonances in the measurement setup. For the conversion to signal-to-noise ratio shown in [Reference Matters-Kammerer, Goor and Tripodi12], an average noise power of −140 dBm is used.

In frequency domain, the output signal of a sampler is the convolution of the Fourier transform of the input signal with the Fourier transform of the sampling pulse. For an ideal sampling pulse, a delta function, the complete frequency content of the input signal is exactly reproduced. In the current circuit, the width of the sampling pulse is determined by the conductance time of the two Schottky diodes, which are opened and closed by the voltage pulses. The exact form of the time-dependent diode conductance can only be determined from simulations, including the characteristics of the transmission lines and the diodes. Typically, the sampling pulse is a repetitive series of identical narrow pulses. The Fourier transformation of such a periodic signal contains signals at all higher harmonic frequencies of the repetition frequency with a certain amplitude envelope. Such a sinc-function contains zeros at frequencies that correspond to multiples of the inverse of the rise time. For the frequency response curve at 0.425 V, the first minimum occurs at 320 GHz, which corresponds to a rise time of the sampler pulse of around 3 ps, comparable to the result from the time-domain measurement.
IV. PACKAGED AND FREE-SPACE ANTENNA-BASED SYSTEMS
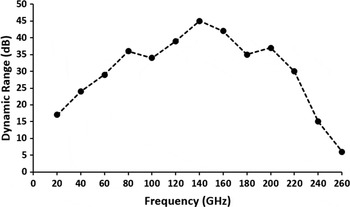
A fully on-chip integrated spectrometer allows for highest dynamic range and will enable analysis in the near-field in small samples like droplets. In this case the highest frequency range that can be reached with the current spectrometer is from 20 to 480 GHz. There are applications that require analysis at a certain distance of the sample and therefore the signal needs to leave the chip via an antenna. In [Reference Tripodi9] a hybrid transmitter module was presented consisting of a 3D chip-scale package with an integrated Vivaldi antenna and a Teflon lens (see also Fig. 12, left). Figure 12 (right) shows the corresponding receiver module, consisting of the sampler presented in this paper, a Vivaldi antenna and a Teflon lens. As the down converted output of the sampler is in the frequency range below 50 MHz, a low frequency connector can be used. Due to the interconnects, the finite gain and limited bandwidth of the antennas and the finite size of the lenses, the dynamic range of these free-space systems is reduced as compared with on-chip spectroscopy. The dynamic range of this hybrid free-space spectrometer is shown in Fig. 13. At lower frequencies, the antenna does not radiate efficiently. At higher frequencies, the interconnects limit the signal extraction from the CMOS chip. Due to these reasons, on-chip spectroscopy in the near-field has higher potential for reaching a large bandwidth up to several hundreds of Gigahertz with high dynamic range as compared with free-space systems.
Hybrid transmitter (left) [Reference Tripodi9] and receiver (right) module in a chip-scale package. The package contains a Teflon lens, a broadband Vivaldi antenna, the CMOS non-linear transmission line-based transmitter /receiver chip with DC and coaxial RF interconnect (from the top).

Dynamic range of the free-space spectrometer based on the hybrid modules shown in Fig. 12 [Reference Berrier8].

An alternative to the hybrid module integration is to use an on-chip antenna. The implementation of the broadband transmitter with on-chip antenna was shown in [Reference Hu, Tripodi, Matters-Kammerer, Cheng and Rydberg15]. Here we also show the receiver with on-chip antenna (Fig. 14). These modules have been laser-cut out of the CMOS wafer. In this implementation, a transmission line-based interconnect can be used between the spectrometer and the extreme wideband antenna [Reference Hu, Tripodi, Matters-Kammerer, Cheng and Rydberg15]. The wideband performance of the antenna is an enabler for broadband operation of the spectrometer.
Left: non-linear transmission line-based broadband transmitter [Reference Hu, Tripodi, Matters-Kammerer, Cheng and Rydberg15] with integrated broadband antenna. Right: high-speed sampling circuit with integrated antenna. Both modules were laser-cut out of the 65-nm CMOS wafer. The small black dots are debris from the cutting process. Due to a protection layer on top of the circuits, they did not influence the performance.

V. CONCLUSIONS
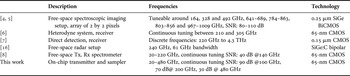
Table 1 compares the performance of the integrated spectrometer to published spectrometers in CMOS technology. This spectrometer has a 20–480 GHz bandwidth and can be frequency tuned to achieve a continuous coverage of the entire band. The signal to noise ratio is 90 dB @ 100 GHz, 70 dB @ 200 GHz, 50 dB @ 400 GHz, 30 dB @ 480 GHz. The on-chip integration makes it a lens-less spectrometer with a very high degree of integration, very suitable for e.g. micro-fluidic applications in the bio-medical and bio-chemical application areas. Co-integration with a broadband antenna as well as packaging of the CMOS transmitter and sampler with a Teflon lens was demonstrated to enable free-space analysis of samples. This however also decreases the available spectral range and dynamic range. Therefore if possible for the sample, a complete on-chip analysis results in a significantly higher signal to noise ratio and broader frequency range.
Performance comparison to prior art in CMOS and BiCMOS technology.

SNR: signal-to-noise ratio.
ACKNOWLEDGEMENTS
This work was supported by the European Community's Seventh Framework Program under Grant FP7-224189 (ULTRA project http://www.ultra-project.eu). The authors wish to thank Heiko Schäfer from Siegen University (Germany) for providing the photos of the hybrid transmitter and receiver modules. Furthermore, they acknowledge the company microTEC for the packaging of the hybrid transmitter and receiver modules.
 Marion K. Matters-Kammerer received the Master (1998) of Physics from Ecole Normale Supérieure (Paris, France) and the Physikdiplom (1999) from TU Berlin (Germany). In 2006 she obtained the Ph.D. in Physics from RWTH Aachen (Germany). In 1999 she joined Philips Research Aachen (Germany) and in 2004 Philips Research Eindhoven (The Netherlands). In 2009 and 2010 she was lecturer and guest researcher at the RWTH Aachen (Germany). Since 2011 she is Associate Professor at the Eindhoven University of Technology (The Netherlands) in the area of Terahertz Electronics for Imaging and Spectroscopy as well as high data rate communication systems and ultra-low power millimeter wave sensor systems.
 Dave van Goor received the B.S. degree in Electronic Engineering from the Fontys Hogeschool Eindhoven in 1999. He is currently working at Philips Lighting Research Eindhoven, The Netherlands. From 2000 to 2010, he was involved in RF IC design for Optical Networking applications, Microwave IC design and high-voltage and low-power analog-integrated circuits. In 2010 he joined the Power over Ethernet for Lighting project. Currently he is working in a project to define the IEEE P802.3bt standard for PoE.
 Lorenzo Tripodi received the Laurea degree in Electronics Engineering from Politecnico di Torino, Turin, Italy in 1999 and the Ph.D. degree in Theoretical Condensed Matter Physics from Université Joseph Fourier, Grenoble, France in 2002. In 2003 he joined Philips Research Eindhoven (The Netherlands) where he has been Senior Scientist and Project Leader until 2012. In 2008 he has initiated the European FP7 project ULTRA (ultra-project) and has coordinated it until its conclusion in 2011. In 2013 he has joined ASML in Eindhoven, The Netherlands, where he is currently group leader in the Development & Engineering Division.