I. INTRODUCTION
Aluminum-based amorphous alloy has attracted much interest because of its high specific strength, good corrosion resistance, etc. Reference Inoue and Nishiyama1–Reference Yavari, Lewandowski and Eckert3 The highest tensile strength was reported to reach about 1560 MPa for the Al-based amorphous alloys containing some nanoscale face centered cubic (f.c.c.)-Al. Reference Kim, Inoue and Masumoto4 However, the size of the cast piece is limited for glass formation in the Al-based amorphous alloys and greatly constrain their engineering applications. Reference Mu, Fu, Zhu, Wang, Li, Hu and Zhang5 Recently, a powder metallurgical method has been used to prepare Al-based amorphous alloys with larger external dimensions by hot consolidation of the amorphous powders. Reference Scudino, Surreddi, Nguyen, Liu, Gemming, Sakaliyska, Kim, Vierke, Wollgarten and Eckert6–Reference Sasaki, Hono, Vierke, Wollgarten and Banhart9 The problems, such as the ease of oxidation of powder, the porosity etc., are difficult to solve, limiting its application.
It is known that the amorphous alloy melt is of high degree short-range ordering, Reference Inoue10–Reference Penfold and Salmon13 which leads to melt viscosity about two orders of magnitude higher than that of pure metals or alloys. Reference Hays, Kim and Johnson11 The resultant high solid/liquid interfacial energy as well as the difficulty of atomic rearrangement suppresses the nucleation and growth of crystals. Reference Inoue10 Thus, if the glass former was solidified at quite a low cooling rate, the microstructure of the corresponding crystalline products may show fine grain, high solid solution, and high volume fraction of intermetallic phases. In the case of Al alloys, this kind of microstructure is expected to show high strength through grain refinement strengthening, Reference Ohtera, Terabayashi, Nagahama, Inoue and Masumoto8,Reference Liddicoat, Liao, Zhao, Zhu, Murashkin, Lavernia, Valiev and Ringer14,Reference Zhang, Hu, Berghammer and Gottstein15 solid solution strengthening, Reference Liddicoat, Liao, Zhao, Zhu, Murashkin, Lavernia, Valiev and Ringer14 dislocation strengthening, Reference Scudino, Surreddi, Nguyen, Liu, Gemming, Sakaliyska, Kim, Vierke, Wollgarten and Eckert6,Reference Liddicoat, Liao, Zhao, Zhu, Murashkin, Lavernia, Valiev and Ringer14,Reference Zhao, Liao, Jin, Valiev and Zhu16 strengthening by particles, and/or precipitates of intermetallic phases. Reference Kawamura, Mano and Inoue7,Reference Ohtera, Terabayashi, Nagahama, Inoue and Masumoto8,Reference Zhang, Hu, Berghammer and Gottstein15,Reference Ralston, Birbilis, Weyland and Hutchinson17,Reference Feng, Yang, Huang, Luo, Li, Han and Fu18 Additionally, Al-based amorphous alloys usually have the atomic percent of Al element as high as 85%, even 90%, which leads to high volume fraction of f.c.c.-Al and low density of the alloy. Reference Mu, Fu, Zhu, Wang, Li, Hu and Zhang5,Reference Fu, Mu, Wang, Li, Hu and Zhang19–Reference Wang and Bian22 In this paper, the aforementioned idea was examined in the Al–Ni–La amorphous system with good glass forming ability. The results show that the studied alloys possess high strength and good plasticity. The highest compressive strength is approximately 1.01 GPa, which is almost equivalent to the corresponding amorphous alloy. Reference Mu, Fu, Zhu, Wang, Li, Hu and Zhang5 This finding will provide a new method to design high strength Al alloys.
II. EXPERIMENT
Alloy ingots with compositions of Al90.5−x Ni9.5La x (x = 0–6, in atomic percentage) and Al95La5 were prepared by arc-melting high-purity metal mixture under a Ti-gettered high purity argon atmosphere in a water-cooled copper hearth. The ingots were remelted in a quartz tube and then injected through a nozzle with about 1 mm diameter into copper molds with a cavity in the shape of rod. For comparison, the intermetallic phases of Al3Ni and Al11La3 were synthesized. The ingots with the corresponding nominal composition were prepared just like the other alloys stated above. Al11La3 phase was formed in the ingots after arc melting. Since the Al3Ni phase is a product of peritectic reaction, Reference Massalski, Murray, Bennett and Baker23 it was prepared by annealing the samples at 923 K for 7 h. The microstructures of the samples were examined by x-ray diffractometry (XRD, Cu Kα radiation; Rigaku D/Max-2500 PC, Tokyo, Japan), scanning electron microscopy (SEM, Hitachi S3400N, Tokyo, Japan) accompanied with energy dispersive spectrometry (EDS), and high-resolution transmission electron microscopy (HRTEM; Tecnai G2 F30, Netherlands, 200 kV). Thermal behaviors were analyzed by differential scanning calorimetry (DSC; Netzsch DSC 204F, Germany) at the heating rate of 10 K/min in a flowing argon. The specimens of 2 mm in diameter and 4 mm in height were cut from the as-cast samples and used for compression tests. Compression tests were performed on a universal testing machine (Instron 5582, Norwood, MA), using a constant strain rate of 1 × 10⁻⁴ s−1. The microhardnesses were tested by the LM247AT Microhardness Tester (St. Joseph, MI) under different loads.
III. RESULTS
A. Microstructure
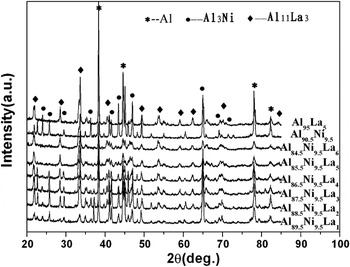
Figure 1 shows the XRD patterns of the as-cast 2 mm diameter samples of Al90.5−x Ni9.5La x (x = 0–6) and Al95La5 alloys. For the Al90.5−x Ni9.5La x (x = 1–6) alloys, after a careful match with the data in the powder diffraction files (PDF), the phases were indexed as Al, Al11La3, and Al3Ni, which are coincident with the crystallization products of the Al–La–Ni amorphous alloy. Reference Mu, Fu, Zhu, Wang, Li, Hu and Zhang24 Upon increasing the La content, the intensity of the diffraction peaks corresponding to Al11La3 phase becomes stronger, indicating an increase of the volume fraction for Al11La3 phase. In addition, the binary alloy Al90.5Ni9.5 is composed of Al and Al3Ni and Al95La5 is composed of Al and Al11La3 phases.
XRD patterns of the as-cast 2 mm diameter samples of the Al90.5−x Ni9.5La x (x = 0–6) and Al95La5 alloys.

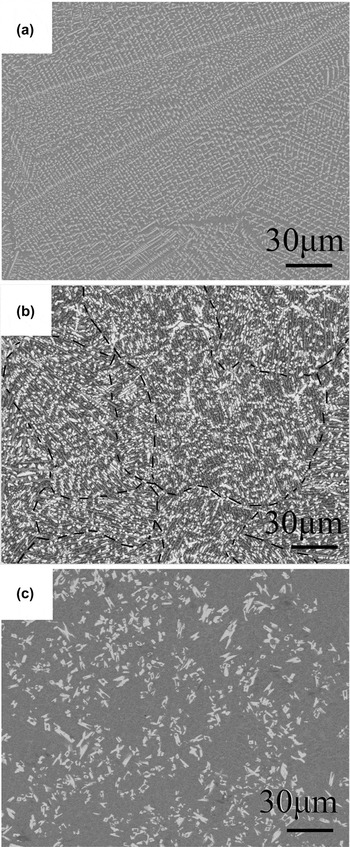
The microstructure morphologies of the alloys were investigated by SEM and TEM. Figure 2 shows the backscattering SEM images of the Al85.5Ni9.5La5, Al90.5Ni9.5, and Al95La5 alloys. For Al90.5Ni9.5 and Al95La5 binary alloys in Figs. 2(a) and 2(c), respectively, typical Al3Ni and Al11La3 dendrites disperse in the Al matrix, while the SEM images of the Al90.5−x Ni9.5La x (x = 1–6) ternary alloys, which are all similar to the Al85.5Ni9.5La5 alloy as shown in Fig. 2(b), show three kinds of microstructure morphology with different contrasts. According to the EDS measurements, the bright blocky phase is rich in La, the gray one in rod-like shape is rich in Ni, and the dark matrix is almost Al. Relating to the XRD results, it can be deduced that the bright phase is Al11La3 and the gray one is Al3Ni. It should be noted that the rod-like Al3Ni phase has a local unitive direction in a small region in all the ternary alloys, as shown in Fig. 2(b), and the size of the area and the spacing between Al3Ni phases are composition-dependent.
SEM images of the as-cast 2 mm diameter samples of the (a) Al90.5Ni9.5, (b) Al80.5Ni9.5La5, and (c) Al95La5 alloys.

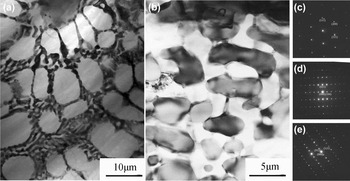
TEM observations show more information about the dark matrix as described in Fig. 2, which is composed of multiple phases instead of Al alone. Figure 3 shows the bright-field TEM micrograph of the dark area between the Al3Ni phase in the Al88.5Ni9.5La2 and Al85.5Ni9.5La5 alloys and the corresponding selected-area electron diffraction (SAED) patterns. For the Al88.5Ni9.5La2 alloy, the eutectic structures exist along the grain boundaries of the Al phase. According to the SAED results, the eutectic structure is the mixture of Al, Al3Ni, and Al11La3 phases. The Al85.5Ni9.5La5 alloy shows a different structure for the dark matrix, as shown in Fig. 3(b). Al, Al3Ni, and Al11La3 phases are interpenetrating themselves in-between the Al3Ni phases.
Bright-field TEM images of the as-cast (a) Al88.5Ni9.5La2 and (b) Al85.5Ni9.5La5 alloys. (c), (d), and (e) are the SAED patterns of the Al, Al3Ni, and Al11La3 phases, respectively.

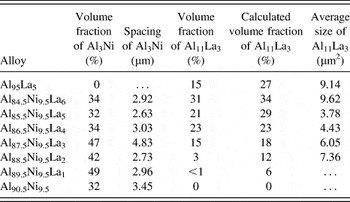
To obtain the volume fractions of the intermetallic phases in the Al90.5−x Ni9.5La x (x = 0–6) and Al95La5 alloys, the SEM images were analyzed by the mapping software. The results are summarized in Table I. In this estimation, some points need to be noted that the two intermetallic phases dispersed along the Al grain boundaries are too fine to be analyzed so that the results listed in Table I could not include this part. The calculated values of the Al11La3 phase volume fraction in Table I are obtained under the assumption that the intermetallic phase Al11La3 contains the entire element La in the alloys.
Microhardnesses of the Al3Ni and Al11La3 phases under the loading of 25 g.

Generally, the volume fractions of the Al11La3 phase in the alloys increase from 0 to 39% as the atomic percent of La increases from 0 to 6%. The deviations of the calculated volume fraction phase to the measured ones for the Al11La3 phase in the Al90.5−x Ni9.5La x (x = 0–3) alloys are much higher than those in the Al90.5−x Ni9.5La x (x = 4–6) alloys. And there are two exceptional points among the alloys, Al88.5Ni9.5La2 and Al85.5Ni9.5La5, of which the values of the deviation are up to 8–9%. Although the atomic percent of the Ni element remains constant in all the ternary alloys, the volume fraction of the Al3Ni phase exhibits a composition-dependent tendency. The volume fractions of the Al3Ni phase in the alloys of x = 0–3 are obviously lower than those in the alloys of x = 4–6. It is indicated that the precipitation of the Al3Ni phase is promoted for the alloys with the atomic percent of La lower than 3%, whereas the La almost precipitated in the form of the Al11La3 phase for those with the atomic percent of La higher than 4%.
The spacing of the rod-like Al3Ni phase and the average size of the Al11La3 phase were measured, which are also listed in Table I. The spacing of the Al3Ni phase and the size of the Al11La3 phase for the Al88.5Ni9.5La2 and Al85.5Ni9.5La5 alloys are smaller than other alloys. Taken the good glass forming ability of Al85.5Ni9.5La5 alloy in Al–Ni–La system into account, Reference Mu, Fu, Zhu, Wang, Li, Hu and Zhang5 the low volume fraction and fine size of the intermetallic phase in the Al85.5Ni9.5La5 alloy are thought to be attributed to the aforementioned unique feature of the melt.
B. Microhardness of the intermetallic phases
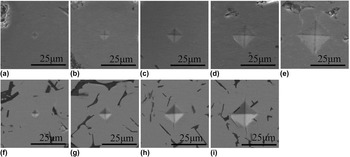
The microhardness test, which is a useful method to evaluate the strength of the phase, Reference Furukawa, Horita, Nemoto, Valiev and Langdon25–Reference Qin, Wu and Zhang27 was performed for the Al3Ni and Al11La3 single-phase samples. The microhardnesses of the Al3Ni and Al11La3 phases under the load of 25 g are 5.93 GPa and 4.43 GPa, respectively. The hardness of Al3Ni is even equivalent to that of Zr-based amorphous alloy. Reference Inoue, Zhang and Masumoto28 Obviously, the two intermetallic phases are the reinforcements in the present Al alloys. In addition, the microhardnesses of the two phases were tested under different loads. And the indents were investigated by SEM, as shown in Fig. 4. When the load gradually increases from 10 to 100 g, the indents of Al3Ni phase are all the normal squares. However, when the load is up to 200 g, there are small cracks appearing in the corner. For the Al11La3 phase, the critical loading for the appearance of the crack is 25 g, which is much lower than that of the Al3Ni phase. Since the microhardness of the Al11La3 phase is about 2/3 of that of the Al3Ni phase and the relationship between the strength and hardness is σf = 1/3 Hv, Reference Ashby and Jones29 the appearance of cracks in Al11La3 phase under low loading may be because of the brittleness of the phase.
SEM images of the indents under different loadings. (a–e) are the indents of Al3Ni phase under 10, 25, 50, 100, and 200 g loadings respectively. (f–i) are the indents of the Al11La3 phase under 10, 25, 50, and 100 g loadings, respectively.

C. Thermal properties
The thermal properties of the Al90.5−x Ni9.5La x (x = 0–6) and Al95La5 alloys were tested by DSC experiment. The DSC curves (not shown in this work) are all straight lines with negative slopes, which means that only the growth of the grains without phase transformation or crystallization occurs during the heating process. It proves that there is no amorphous phase or metastable phase in the samples.
D. Mechanical properties
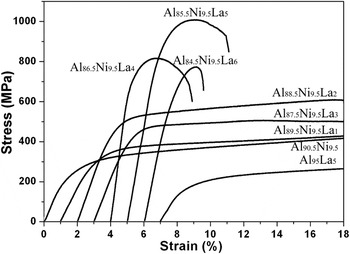
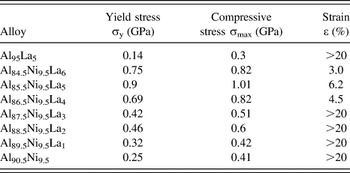
Figure 5 shows the typical compressive strain–stress curves of the as-cast 2 mm diameter specimens. It is clear that all the specimens exhibit an initial elastic deformation, and then yield, followed by plastic deformation. The yield strength σy, fracture strength σmax, and plastic strain ε of all the alloys are listed in Table II. Based on the strength and plasticity, the studied alloys are classified into two groups. Group A includes the binary alloys and Al90.5−x Ni9.5La x (x = 0–3) alloys. The other alloys belong to Group B. For Group A alloys, the yield strengths are below 0.5 GPa, and the strain is up to 20% without fracture in compression. However, in Group B, the strength becomes much higher, while the plasticity is declined. For these two groups, the variation trends of the yield strengths are both shown as a parabola. The top points in each group are 0.46 GPa of Al88.5Ni9.5La2 and 0.9 GPa of Al85.5Ni9.5La5, respectively. Among all the present alloys, the Al85.5Ni9.5La5 alloy exhibits the maximum fracture strength and considerable strain, which are about 1.01 GPa and 6.2%, respectively.
The typical compressive strain–stress curves of the as-cast 2 mm diameter samples of the Al90.5−x Ni9.5La x (x = 0–6) and Al95La5 alloys with 1% offsets in the strain.

Compressive mechanical properties of the Al–Ni–La alloys.

E. Deformation and fracture behaviors
As shown in Fig. 5, Al88.5Ni9.5La2 and Al85.5Ni9.5La5 alloys display the highest strength in each group as well as the lowest spacing and finest grain. This means that the good mechanical properties of the two alloys result from the optimal combination of the volume fraction, spacing, and grain size of the intermetallic phases. To better understand the relationship between the microstructure and mechanical properties, the detailed deformation processes of the Al88.5Ni9.5La2 and Al85.5Ni9.5La5 alloys were further investigated.
1. Deformation processes of the Al88.5Ni9.5La2 alloy
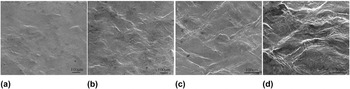
Figure 6 shows the SEM images of the profiles of Al88.5Ni9.5La2 specimens subjected to different strains. When the supplied strain is 5%, there are materials piled out in some regions, which distribute the plastic strain to the whole specimens. According to the backscattering SEM image, the piled out materials correspond to the Al-rich matrix and all along the Al3Ni phase. The angles between the loading direction and the Al3Ni phase in this region are in the range of 80°–65°, which are bigger than 45°. As the strain reaches 10%, some areas with lower angle start to be involved in the plastic deformation, as shown in Fig. 6(b). When the strain increases to 20%, most of the regions with different directions plastically deform. However, compared to the region with low angle, the regions with the angle of 80°–65° deform more severely.
SEM images of the profile after different strain for the Al88.5Ni9.5La2 alloy: (a) 5%, (b) 10%, (c) 15%, and (d) 20%.

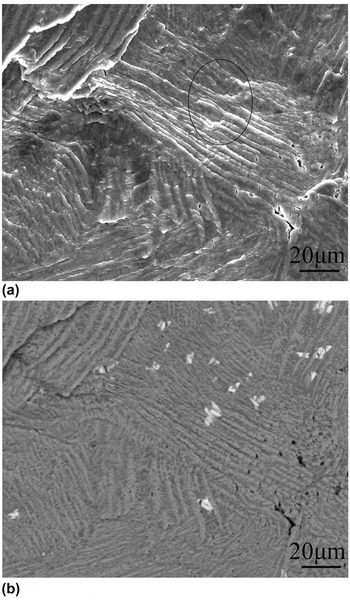
Figure 7(a) is the partial enlarged image of Fig. 6(d). There are some microcracks occurring, especially gathering in the edge of the region with large angle. Meanwhile, another phenomenon attracted our interests. The area in the circle in Fig. 7(a) shows some phase inhibiting the piling out of the material. The corresponding backscattering image shows that the phase is Al11La3. It indicates that the Al11La3 phase can effectively strengthen the alloy. It may cause two consequences: the first one is the Al11La3 phase that effectively strengthens the alloy. And the other one is stress concentration that inevitably occurs in this area.
(a) SEM image of the partial enlarged details of Al88.5Ni9.5La2 alloy subjected to 20% strain and (b) the corresponding backscattering electron image.

2. Deformation processes of the Al85.5Ni9.5La5 alloy
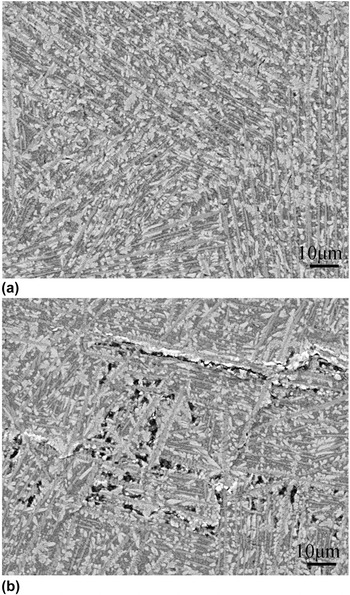
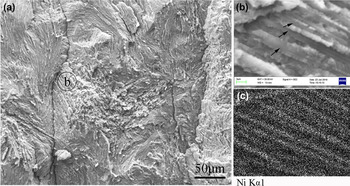
The investigation on the profiles of Al85.5Ni9.5La5 specimens subjected to different strains is shown in Fig. 8. After yielding, there are some pores occurring in the sample. The pores are all in the zone between Al3Ni phases, and close to or just in the Al11La3 phase. What should be noted is that the location of the pores is concentrated in the edge of the area with large angle. According to the simulation results in Sec. IV. B, these regions are of strain concentration. When the sample is subjected to plastic strain of 5%, the pores link and develop into microcracks. This phenomenon coincides with the investigation of the fracture surface. As shown in Fig. 9(a), the fracture surface of the Al85.5Ni9.5La5 alloy is very rough. The enlarged image in Fig. 9(b) shows that there are some rod-like phases acting as the ridge in each zone. The mapping result in Fig. 9(c) shows that the ridge phase is rich in Ni, indicating the occurrence of the Al3Ni phase. Considering the microstructure stated above, the fracture surface fluctuates correspondingly as the distribution of the Al3Ni phase changes.
SEM images of the profile after different strain for the Al85.5Ni9.5La5 alloy: (a) yield and (b) 5%.

(a) SEM image of the fracture surface for the Al85.5Ni9.5La5 alloy, (b) the enlarged image, and (c) the corresponding mapping result.

IV. DISCUSSION
The distribution of the intermetallic phases and its relationship with the mechanical properties are the key issues to understand the deformation mechanism of the Al alloys. Reference Scudino, Surreddi, Nguyen, Liu, Gemming, Sakaliyska, Kim, Vierke, Wollgarten and Eckert6–Reference Sasaki, Hono, Vierke, Wollgarten and Banhart9 In the current work, the size, volume fraction, and distribution of Al3Ni and Al11La3 phases are composition-dependent. As listed in Table I, with increasing La content, the volume fraction of Al11La3 shows an increasing tendency. Due to the brittle nature (Fig. 4), Al11La3 phase acts as the origin of microcrack at the high stress level, as described in Sec. III. E, which leads to alloys with the higher volume fraction of Al11La3 phase becoming strong but brittle (Fig. 5). The other intermetallic phase, Al3Ni, shows a unique distribution in the alloys. The role of Al3Ni in the deformation will be discussed in detail in the following section.
A. Finite element simulation
The local unitive direction of the Al3Ni phase is a typical structural feature of the alloys in this work. The Al3Ni phase is in a shape of short fiber. However, the distribution is distinguished from the other fiber reinforced composites, Reference Bauer30 such as the unidirectional short fiber reinforced composite and the short fiber with random direction reinforced composite. The Al11La3 phase precipitated as particles in the current alloys. Recently, the strengthening mechanisms of the dispersed particles in the Al alloys were well understood. Reference Dew-Hughes and Robertson31–Reference Hansen34 In this part, the deformation behaviors of the new kind of short fiber reinforced composite are discussed in detail through finite element simulations (FESs). The deformation mechanism was disclosed to depend not only on the fiber direction in each small area, but also on the interaction between the areas with different directions.
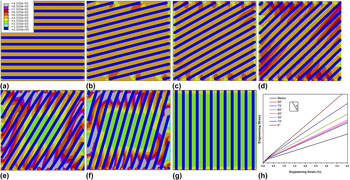
FES is used to understand the deformation mechanism of the composite reinforced by the short fiber with local unitive direction. The unit is 30 μm × 30 μm. The matrix is the binary Al90.5Ni9.5 alloy. Al3Ni phase is designed as rod shape with 1 μm in diameter and the spacing is 2.5 μm. The interface of the alloy is assumed to be continuous without fracture during deformation. And considering that the sample is in the bulk shape, it is assumed that the state of stress is plane strain. The parameters of Al3Ni phase refer to Ref. Reference Shi35. 4.5% strain was performed on the units. As shown in Fig. 10, the strain distribution and strengthening effect of the rod-like fibers are related to the fiber direction for the units with one direction of fiber. When the angle between the axial direction, i.e., the loading direction and the Al3Ni direction, is in the range of 90°–60°, the strain distributes homogeneously in the matrix. When the angle reaches 45°, the distribution of the strain starts to concentrate on the edge of the unit. As the angle becomes smaller, the strain concentration becomes more severe. For the units with 30°–0°, there is even a central region with low strain. The corresponding stress–strain curves are shown in Fig. 10(h). The units with 60° and 75° have the lowest strength among the samples. The strength becomes a little higher for the units with 90° and 45°. As the angle changes from 30° to 0°, the strength increases obviously. These results show that the units with 60°–75° can be easily and homogeneously deformed. It coincides with the experimental results of the Al88.5Ni9.5La2 alloy in Sec. III. D, in which the regions with high angle first plastically deformed, and are the most severe deformation part during the process. In addition, the simulation results also show that the regions with low angles have good strengthening effect.
Contour maps of the strain distribution of the unidirectional units obtained by FES. The included angles between axial direction and Al3Ni phase are (a) 90°, (b) 75°, (c) 60°, (d) 45°, (e) 30°, (f) 15°, and (g) 0°. (h) is the corresponding stress–strain curves.

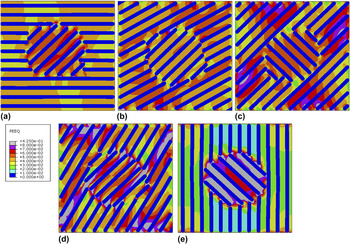
Besides the strain distribution of the unidirectional units, the interaction between the units with different directions was also studied. A particle with 45° was embedded in the aforementioned units. As shown in Fig. 11, after performing 4.5% strain on the units, the strain distribution is much different from that of the unidirectional ones. In the 30°/45° unit, the introduction of the 45° particle leads to the strain concentration, which is different from the homogeneous distribution in the unidirectional 30° unit. However, in the 60°/45° unit, the case is opposite, which is that the introduction of the 45° particle weakens the strain concentration. Whatever, there is a common feature in all the systems that the strain concentration lies in the easily deformed region and close to the edge. During deformation, when the material in the strain concentration position cannot bear the strain, it may be broken and induce the initiation of the microcrack. This agrees with the appearance of the microcrack in Al88.5Ni9.5La2 sample and the pores in Al85.5Ni9.5La5 alloy, which has been shown in detail in Sec. III. D.
Contour maps of the strain distribution of the bidirectional units obtained by FES: (a) 90°/45°, (b) 60°/45°, (c) 135°/45°, (d) 30°/45°, and (e) 0°/45°.

B. Deformation mechanisms
FES results show that the regions of Al3Ni phase with different local directions show different strengthening effect. The regions with 60°–75° can be easily deformed. Moreover, the strain concentrates on the edge of the easily deformed region, which easily results in the initiation of microcracks. It is coincident with the observations (Fig. 7) in the ductile Al88.5Ni9.5La2 alloy. In the Al85.5Ni9.5La5 alloy, which exhibits higher fracture strength, the break of Al11La3 phase probably acts as the initiation origin of microcrack. It is implied that the roles of Al3Ni and Al11La3 phases are different in the deformation process between Group A and Group B alloys. In the Al88.5Ni9.5La2 alloy with the lower strength, the Al11La3 phase is strong enough to act as dispersed hard particles to hinder the plastic deformation as shown in Fig. 7, which is beneficial to the enhancement of strength. The distribution of Al3Ni in the alloys makes the plastic strain heterogeneously spread in the sample, leading to local strain concentration, which initiates the microcrack. For the alloys with higher fracture strength, i.e., Al85.5Ni9.5La5 alloy, due to the stress concentration, the stress level may be high enough to reach the strength of the Al11La3 phase. Thus, the failure of Al11La3 phase results into the pores in the profiles, which becomes the origin of the cracks leading to the failure of the specimens.
V. CONCLUSION
A series of Al-based alloys were successfully synthesized in the Al–Ni–La system using a rapid solidification method. All the investigated Al–Ni–La alloys are comprised of three phases of f.c.c.-Al, Al3Ni, and Al11La3. The Al88.5Ni9.5La2 sample shows the combination of good plasticity and high strength. And the Al85.5Ni9.5La5 alloy has the highest strength of 1.01 GPa, with considerable plasticity. The experimental analysis and FESs illustrate the deformation mechanisms as follows:
-
(1) The Al3Ni phases with different directions have different strengthening effects. When the angles of the direction of Al3Ni phase to the loading direction are in the range of 60°–75°, the deformation takes place easily. When the angle is out of the range, the strengthening effect is enhanced. The highest strength is achieved for the angle of 0°.
-
(2) The units with Al3Ni phase in different directions interact with each other, causing the strain concentration in the easily deformed region and close to the edge. This becomes the damage mode of the ductile alloys such as the Al88.5Ni9.5La2 alloy.
-
(3) Compared with the Al3Ni phase, the Al11La3 phase is more brittle. When the stress level becomes high enough, the Al11La3 phase breaks and becomes the origin of the crack, eventually leading to the failure of the specimens.
ACKNOWLEDGMENTS
The authors gratefully acknowledge the financial support from the National Basic Research Program of China (Grant No. 2011CB606301) and the China Postdoctoral Science foundation (Grant No. 2012M520638).