1 Introduction
1.1 Background
The term ‘ocean waves’ typically evokes images of surface waves shaking ships during storms in the open ocean, or breaking rhythmically near the shore. However, much of the ocean wave action takes place far underneath the surface, and consists of surfaces of constant density being disturbed and modulated.
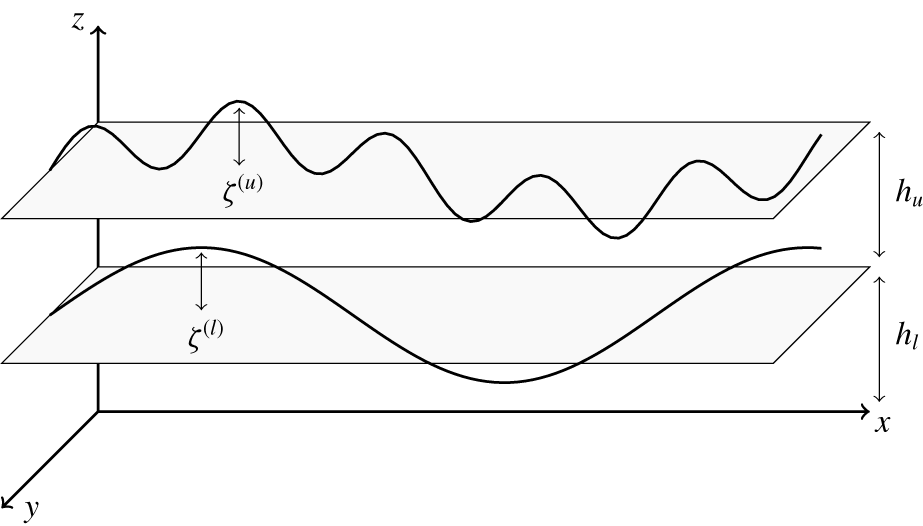
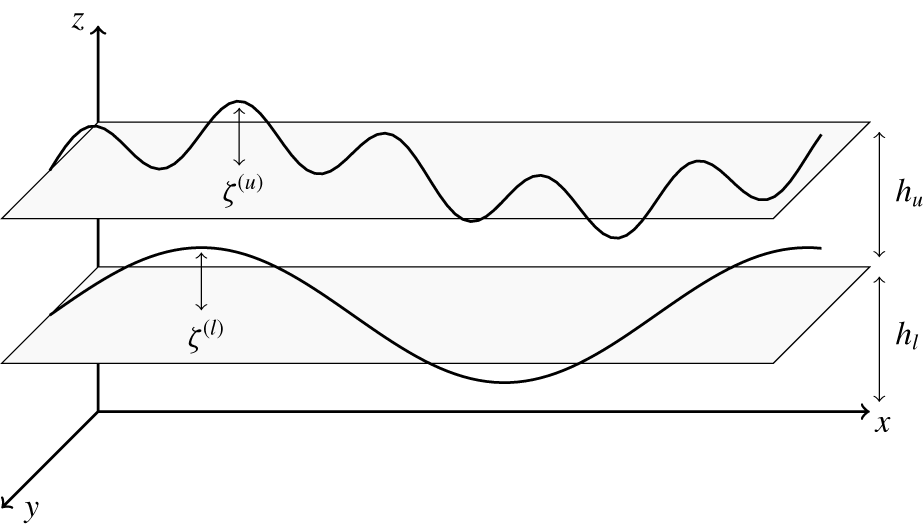
When wind blows over the ocean, it excites surface waves. These surface waves in turn excite internal waves. Therefore the coupling between surface and interfacial waves provides a key mechanism of coupling the atmosphere and the ocean. The simplest conceptual model describing such an interaction is a two-layer model (figure 1), with a lighter fluid with free surface being on top of a heavier fluid with a rigid bottom. This two-layer model has been actively studied in the last few decades from the angle of weakly nonlinear resonant interactions between surface and interfacial layers (Ball Reference Ball1964; Thorpe Reference Thorpe1966; Gargettt & Hughes Reference Gargettt and Hughes1972; Watson, West & Cohen Reference Watson, West and Cohen1976; Olbers & Herterich Reference Olbers and Herterich1979; Segur Reference Segur1980; Dysthe & Das Reference Dysthe and Das1981; Watson Reference Watson1989, Reference Watson1994; Alam Reference Alam2012; Constantin & Ivanov Reference Constantin and Ivanov2015; Tanaka & Wakayama Reference Tanaka and Wakayama2015; Olbers & Eden Reference Olbers and Eden2016).
The strength of such nonlinear interactions has been the subject of long debate. Earlier approaches include the calculations of Thorpe (Reference Thorpe1966) and Olbers & Herterich (Reference Olbers and Herterich1979). Most recently, Olbers & Eden (Reference Olbers and Eden2016) found the annual mean energy flux integrated globally over the oceans to be about 10-3 TW. Ball (Reference Ball1964) showed the existence of a closed curve of triad resonances for two-dimensional wave vectors corresponding to interactions between waves of all possible orientations. He emphasized the cases in which two counter-propagating surface waves drive an interfacial wave, and two counter-propagating interfacial waves drive a surface wave. Later, these classes of resonances were referred to as class I and class II interactions. In class I, two surface waves counter-propagate with roughly equal wavelength, with the interfacial wave having shorter wavelength. In class II, the interfacial waves counter-propagate, with the surface wave having roughly twice the frequency of the interfacial waves (Alam Reference Alam2012).
Schematic of the surface and interface with respect to mean displacements.
Chow (Reference Chow1983) analysed class I resonances for a two-layer model under the assumptions that the bottom layer is of infinite depth and the top layer is shallow. These assumptions allowed the formulation of the triad resonance condition in a more general way, namely that the group speed of a surface wave envelope matches the phase speed of the interfacial wave. Using this condition, Chow derived evolution equations for a surface wave train coupled to interfacial waves. He found a band of wavenumbers that are unstable, thus facilitating energy transfer from the surface waves to the interfacial waves. However, he found that the energy transfer rate was smaller than the transfer rate for resonant triad interactions.
Watson (Reference Watson1989) considered surface wave–interfacial wave interactions, taking into account both surface wave dissipation and broadening of the three wave resonances, using Wentzel–Kramers–Brillouin theory.
Alam (Reference Alam2012) considered resonances in the one-dimensional case with collinear waves. He discovered what are now called class III resonances, where the wavelength of the resonant interfacial wave is much longer than that of the two co-propagating surface waves, making it physically relevant in describing the formation of long interfacial waves. Alam showed that these resonances cause a cascade of resonant and near-resonant interactions between surface and interfacial waves and thus could be a viable energy exchange mechanism. He also obtained expressions for the amplitude growth of an interfacial wave in a system with a large number of interacting waves.
Tanaka & Wakayama (Reference Tanaka and Wakayama2015) considered the two-layer system and modelled numerically the primitive equations of motion in  $2+1$ dimensions (horizontal and vertical directions and time) for the case of a surface wave spectrum based on the Pierson–Moskowitz spectrum (Pierson & Moskowitz Reference Pierson and Moskowitz1964). Tanaka & Wakayama (Reference Tanaka and Wakayama2015) showed that an initially still interface experiences excitation with a flux of energy towards smaller wavenumbers. For the case of a large difference in density between layers, they noticed that the shape of the surface spectrum changes significantly. They noted that this cannot be explained by resonant wave interaction theory because resonant wave interaction theory predicts the existence of a critical surface wavenumber, below which there could not be any interactions. Consequently, there is a need of a theory not limited to only resonant interactions, but that which also includes near-resonant interactions.
Olbers & Eden (Reference Olbers and Eden2016) used an analytical framework that directly derives the flux of energy radiating downward from the mixed-layer base with a goal of providing a global map of the energy transfer to the interfacial wave field. They concluded that spontaneous wave generation, where two surface waves create an interfacial wave, becomes dominant over modulational interactions where a preexisting interfacial wave is modulated by a surface wave for wind speeds above  $10{-}15~\text{m}~\text{s}^{-1}$.
1.2 Overview of the paper
In this paper we derive from first principles wave turbulence theory for wave–wave interactions in the two-layer model. Our theory is based on the recently derived Hamiltonian structure for this system (Choi Reference Choi2019). We derive the kinetic equations describing weakly nonlinear energy transfers between waves. The theory includes both resonant and near-resonant wave–wave interactions, and allows a quantitative description of coupling between the atmosphere and the ocean.
The paper is organized as follows. In § 2 we discuss the governing equations of motion and Hamiltonian structure derived by Choi (Reference Choi2019) for the case of  $3+1$ dimensions. Notably, the Hamiltonian is expressed explicitly in terms of the interface variables, forming the base needed for our analysis.
In § 3 we derive a canonical transformation to diagonalize the quadratic part of the Hamiltonian to obtain the normal modes. Such a diagonalization reduces the system to an ensemble of waves which are free to leading order, thus making it amenable to wave turbulence theory as described in Zakharov, L’vov & Falkovich (Reference Zakharov, L’vov and Falkovich1992) and Nazarenko (Reference Nazarenko2011).
In § 4 we apply wave turbulence theory to obtain the system of kinetic equations governing the time evolution of the wave action spectrum of waves (‘number of waves’). Furthermore, we calculate the exact matrix elements (interaction cross-sections) governing such interactions. Our calculations are valid both on and near the resonant manifold.
In § 5 we test our theory by considering the model problem with the surface described by a single plane wave with frequency being the peak frequency of the JONSWAP spectrum (Hassleman et al. Reference Hassleman, Barnett, Bouws and Carlson1973). We obtain the Boltzmann rates and corresponding time scales of amplitude growth for excited interfacial waves. The frequencies of the excited interfacial waves are well within the experimental measurements given in buoyancy profiles of the ocean. Furthermore, we generalize the results in Alam (Reference Alam2012) by considering the general case where all wave vectors are two-dimensional and not necessarily collinear. Notably, for conditions of long surface swell waves, the dominant interactions occur between surface and interfacial waves which are oblique, a case also noted by Haney & Young (Reference Haney and Young2017). Inspired by Tanaka & Wakayama (Reference Tanaka and Wakayama2015), we also simulate the evolving spectra for the case when the surface is the one-dimensional JONSWAP spectrum and the interface is initially at rest.
In § 6 we conclude by summarizing our results and discussing future work.
2 Governing equations
2.1 Equations in physical space
We use a Cartesian coordinate system  $(\boldsymbol{x},z)$, with the
 $xy$ plane being the mean free surface and the
 $z$ axis being directed upward. We consider a two-layer model with the free surface on top and the interface between the layers. We denote the respective depths of the upper and lower layers by
 $h_{u},h_{l}$ and their densities by
 $\unicode[STIX]{x1D70C}_{u}$,
 $\unicode[STIX]{x1D70C}_{l}$, with the difference in density between layers being
 $\unicode[STIX]{x0394}\unicode[STIX]{x1D70C}=\unicode[STIX]{x1D70C}_{l}-\unicode[STIX]{x1D70C}_{u}$, where subscript ‘
 $u$’ refers to the upper layer and subscript ‘
 $l$’ to the lower layer. We assume the fluid is homogeneous, incompressible, immersible, inviscid and irrotational in both layers.
To derive the closed set of coupled equations for the surface velocity potential  $\unicode[STIX]{x1D6F9}^{(u)}(x,y,t)$ and displacement
 $\unicode[STIX]{x1D701}^{(u)}(x,y,t)$ and interfacial velocity potential
 $\unicode[STIX]{x1D6F9}^{(l)}(x,y,t)$ and displacement
 $\unicode[STIX]{x1D701}^{(l)}(x,y,t)$, we start from the Euler equations, incompressibility condition and kinematic boundary conditions for velocity and pressure continuity along the surface/interface. We then introduce a nonlinearity parameter
 $\unicode[STIX]{x1D716}$, the slope of the waves, and make a formal assumption that
 $\unicode[STIX]{x1D716}\ll 1$. This allows us to iterate the resulting equations for a solution representing a wavetrain with wavenumber
 $k$. This procedure was recently executed in Choi (Reference Choi2019), and leads to the following system of equations, truncated at the second order of the nonlinearity parameter:
 $$\begin{eqnarray}\displaystyle \dot{\unicode[STIX]{x1D701}}^{(u)} & = & \displaystyle \unicode[STIX]{x1D6FE}_{11}\unicode[STIX]{x1D6F9}^{(u)}+\unicode[STIX]{x1D6FE}_{12}\unicode[STIX]{x1D6F9}^{(l)}-\unicode[STIX]{x1D70C}_{u}\unicode[STIX]{x1D6FE}_{11}[\unicode[STIX]{x1D701}^{(u)}(\unicode[STIX]{x1D6FE}_{11}\unicode[STIX]{x1D6F9}^{(u)}+\unicode[STIX]{x1D6FE}_{12}\unicode[STIX]{x1D6F9}^{(l)})]\nonumber\\ \displaystyle & & \displaystyle -\,\unicode[STIX]{x0394}\unicode[STIX]{x1D70C}\unicode[STIX]{x1D6FE}_{21}[\unicode[STIX]{x1D701}^{(l)}(\unicode[STIX]{x1D6FE}_{21}\unicode[STIX]{x1D6F9}^{(u)}+\unicode[STIX]{x1D6FE}_{22}\unicode[STIX]{x1D6F9}^{(l)})]\nonumber\\ \displaystyle & & \displaystyle -\,\unicode[STIX]{x1D735}\boldsymbol{\cdot }(\unicode[STIX]{x1D701}^{(u)}\unicode[STIX]{x1D735}\unicode[STIX]{x1D6F9}^{(u)})/\unicode[STIX]{x1D70C}_{u}+\unicode[STIX]{x0394}\unicode[STIX]{x1D70C}(\unicode[STIX]{x1D70C}_{l}/\unicode[STIX]{x1D70C}_{u})\unicode[STIX]{x1D6FE}_{31}\unicode[STIX]{x1D735}\boldsymbol{\cdot }(\unicode[STIX]{x1D701}^{(l)}\unicode[STIX]{x1D6FE}_{31}\unicode[STIX]{x1D735}\unicode[STIX]{x1D6F9}^{(u)})\nonumber\\ \displaystyle & & \displaystyle -\,\unicode[STIX]{x1D70C}_{l}\unicode[STIX]{x1D6FE}_{31}\unicode[STIX]{x1D735}\boldsymbol{\cdot }(\unicode[STIX]{x1D701}^{(l)}\unicode[STIX]{x1D6FE}_{33}\unicode[STIX]{x1D735}\unicode[STIX]{x1D6F9}^{(l)}),\end{eqnarray}$$
 $$\begin{eqnarray}\displaystyle \dot{\unicode[STIX]{x1D701}}^{(l)} & = & \displaystyle \unicode[STIX]{x1D6FE}_{21}\unicode[STIX]{x1D6F9}^{(u)}+\unicode[STIX]{x1D6FE}_{22}\unicode[STIX]{x1D6F9}^{(l)}-\unicode[STIX]{x1D70C}_{u}\unicode[STIX]{x1D6FE}_{12}[\unicode[STIX]{x1D701}^{(u)}(\unicode[STIX]{x1D6FE}_{11}\unicode[STIX]{x1D6F9}^{(u)}+\unicode[STIX]{x1D6FE}_{12}\unicode[STIX]{x1D6F9}^{(l)})]\nonumber\\ \displaystyle & & \displaystyle -\,\unicode[STIX]{x0394}\unicode[STIX]{x1D70C}\unicode[STIX]{x1D6FE}_{22}[\unicode[STIX]{x1D701}^{(l)}(\unicode[STIX]{x1D6FE}_{21}\unicode[STIX]{x1D6F9}^{(u)}+\unicode[STIX]{x1D6FE}_{22}\unicode[STIX]{x1D6F9}^{(l)})]\nonumber\\ \displaystyle & & \displaystyle -\,\unicode[STIX]{x1D70C}_{l}\unicode[STIX]{x1D6FE}_{33}\unicode[STIX]{x1D735}\boldsymbol{\cdot }(\unicode[STIX]{x1D701}^{(l)}\unicode[STIX]{x1D6FE}_{31}\unicode[STIX]{x1D735}\unicode[STIX]{x1D6F9}^{(u)})-\unicode[STIX]{x1D70C}_{l}J\unicode[STIX]{x1D735}\boldsymbol{\cdot }(\unicode[STIX]{x1D701}^{(l)}J\unicode[STIX]{x1D735}\unicode[STIX]{x1D6F9}^{(l)})\nonumber\\ \displaystyle & & \displaystyle +\,\unicode[STIX]{x1D70C}_{u}\unicode[STIX]{x1D6FE}_{32}\unicode[STIX]{x1D735}\boldsymbol{\cdot }(\unicode[STIX]{x1D701}^{(l)}\unicode[STIX]{x1D6FE}_{32}\unicode[STIX]{x1D735}\unicode[STIX]{x1D6F9}^{(l)}),\end{eqnarray}$$
 $$\begin{eqnarray}\displaystyle \dot{\unicode[STIX]{x1D6F9}}^{(u)} & = & \displaystyle -\unicode[STIX]{x1D70C}_{u}g\unicode[STIX]{x1D701}^{(u)}+{\textstyle \frac{1}{2}}\unicode[STIX]{x1D70C}_{u}(\unicode[STIX]{x1D6FE}_{11}\unicode[STIX]{x1D6F9}^{(u)}+\unicode[STIX]{x1D6FE}_{12}\unicode[STIX]{x1D6F9}^{(l)})^{2}-{\textstyle \frac{1}{2}}(\unicode[STIX]{x1D735}\unicode[STIX]{x1D6F9}^{(u)})\boldsymbol{\cdot }(\unicode[STIX]{x1D735}\unicode[STIX]{x1D6F9}^{(u)})/\unicode[STIX]{x1D70C}_{u},\end{eqnarray}$$
 $$\begin{eqnarray}\displaystyle \dot{\unicode[STIX]{x1D6F9}}^{(l)} & = & \displaystyle -\unicode[STIX]{x0394}\unicode[STIX]{x1D70C}g\unicode[STIX]{x1D701}^{(l)}+{\textstyle \frac{1}{2}}\unicode[STIX]{x0394}\unicode[STIX]{x1D70C}(\unicode[STIX]{x1D6FE}_{21}\unicode[STIX]{x1D6F9}^{(u)}+\unicode[STIX]{x1D6FE}_{22}\unicode[STIX]{x1D6F9}^{(l)})^{2}+{\textstyle \frac{1}{2}}\unicode[STIX]{x0394}\unicode[STIX]{x1D70C}(\unicode[STIX]{x1D70C}_{l}/\unicode[STIX]{x1D70C}_{u})(\unicode[STIX]{x1D6FE}_{31}\unicode[STIX]{x1D735}\unicode[STIX]{x1D6F9}^{(u)})\boldsymbol{\cdot }(\unicode[STIX]{x1D6FE}_{31}\unicode[STIX]{x1D735}\unicode[STIX]{x1D6F9}^{(u)})\nonumber\\ \displaystyle & & \displaystyle -\,{\textstyle \frac{1}{2}}\unicode[STIX]{x1D70C}_{l}(J\unicode[STIX]{x1D735}\unicode[STIX]{x1D6F9}^{(l)})\boldsymbol{\cdot }(J\unicode[STIX]{x1D735}\unicode[STIX]{x1D6F9}^{(l)})+{\textstyle \frac{1}{2}}\unicode[STIX]{x1D70C}_{u}(\unicode[STIX]{x1D6FE}_{32}\unicode[STIX]{x1D735}\unicode[STIX]{x1D6F9}^{(l)})\boldsymbol{\cdot }(\unicode[STIX]{x1D6FE}_{32}\unicode[STIX]{x1D735}\unicode[STIX]{x1D6F9}^{(l)})\nonumber\\ \displaystyle & & \displaystyle -\,\unicode[STIX]{x1D70C}_{l}(\unicode[STIX]{x1D6FE}_{31}\unicode[STIX]{x1D735}\unicode[STIX]{x1D6F9}^{(u)})\boldsymbol{\cdot }(\unicode[STIX]{x1D6FE}_{33}\unicode[STIX]{x1D735}\unicode[STIX]{x1D6F9}^{(l)}),\end{eqnarray}$$
 $\unicode[STIX]{x1D6FE}_{ij}$ and
 $J$, whose Fourier kernels are given in appendix A.
2.2 Hamiltonian
We use the Fourier transformations of the interface variables for the two-layer system depicted in figure 1:
 $$\begin{eqnarray}\left.\begin{array}{@{}c@{}}\displaystyle \unicode[STIX]{x1D701}^{(j)}(\boldsymbol{x},t)=\int \hat{\unicode[STIX]{x1D701}}^{(j)}(\boldsymbol{k},t)\text{e}^{-\text{i}\boldsymbol{k}\boldsymbol{\cdot }\boldsymbol{x}}\,\text{d}\boldsymbol{k},\\ \displaystyle \unicode[STIX]{x1D6F9}^{(j)}(\boldsymbol{x},t)=\int \hat{\unicode[STIX]{x1D6F9}}^{(j)}(\boldsymbol{k},t)\text{e}^{-\text{i}\boldsymbol{k}\boldsymbol{\cdot }\boldsymbol{x}}\,\text{d}\boldsymbol{k}\quad \text{for }j\in \{u,l\}.\end{array}\right\}\end{eqnarray}$$
The equations of motion (2.1) can then be represented by canonically conjugated Hamilton’s equations for the Hamiltonian  $H$, given by Choi (Reference Choi2019):
 $$\begin{eqnarray}\displaystyle \frac{\unicode[STIX]{x2202}\hat{\unicode[STIX]{x1D701}}^{(j)}}{\unicode[STIX]{x2202}t}=\frac{\unicode[STIX]{x1D6FF}H}{{\unicode[STIX]{x1D6FF}\hat{\unicode[STIX]{x1D6F9}}^{(j)}}^{\ast }},\quad \frac{\unicode[STIX]{x2202}\hat{\unicode[STIX]{x1D6F9}}^{(j)}}{\unicode[STIX]{x2202}t}=-\frac{\unicode[STIX]{x1D6FF}H}{{\unicode[STIX]{x1D6FF}\hat{\unicode[STIX]{x1D701}}^{(j)}}^{\ast }},\quad j\in \{u,l\}. & & \displaystyle\end{eqnarray}$$
This is a generalization for two layers of the Hamiltonian formulation described in Zakharov (Reference Zakharov1968) for surface waves. Here the Hamiltonian,  $H$, is a sum of a quadratic Hamiltonian, describing linear non-interacting waves, and a cubic Hamiltonian, describing wave–wave interactions,
 $H=H_{2}+H_{3}$, where
 $$\begin{eqnarray}\displaystyle H_{2} & = & \displaystyle \frac{1}{2}\iint [\!h_{1}^{(1a)}\hat{\unicode[STIX]{x1D701}}_{1}^{(u)}\hat{\unicode[STIX]{x1D701}}_{2}^{(u)}+h_{1}^{(2a)}\hat{\unicode[STIX]{x1D6F9}}_{1}^{(u)}\hat{\unicode[STIX]{x1D6F9}}_{2}^{(u)}\nonumber\\ \displaystyle & & \displaystyle +\,h_{1}^{(3a)}\hat{\unicode[STIX]{x1D701}}_{1}^{(l)}\hat{\unicode[STIX]{x1D701}}_{2}^{(l)}+h_{1}^{(4a)}\hat{\unicode[STIX]{x1D6F9}}_{1}^{(l)}\hat{\unicode[STIX]{x1D6F9}}_{2}^{(l)}+h_{1,2}^{(5a)}\hat{\unicode[STIX]{x1D6F9}}_{1}^{(u)}\hat{\unicode[STIX]{x1D6F9}}_{2}^{(l)}\! ]\unicode[STIX]{x1D6FF}(\boldsymbol{k}_{1}+\boldsymbol{k}_{2})\,\text{d}\boldsymbol{k}_{1}\,\text{d}\boldsymbol{k}_{2},\end{eqnarray}$$
 $$\begin{eqnarray}\displaystyle H_{3} & = & \displaystyle \iiint [\!h_{123}^{(1)}\hat{\unicode[STIX]{x1D6F9}}_{1}^{(u)}\hat{\unicode[STIX]{x1D6F9}}_{2}^{(u)}\hat{\unicode[STIX]{x1D701}}_{3}^{(u)}+h_{123}^{(2)}\hat{\unicode[STIX]{x1D6F9}}_{1}^{(u)}\hat{\unicode[STIX]{x1D6F9}}_{2}^{(l)}\hat{\unicode[STIX]{x1D701}}_{3}^{(u)}+h_{123}^{(3)}\hat{\unicode[STIX]{x1D6F9}}_{1}^{(l)}\hat{\unicode[STIX]{x1D6F9}}_{2}^{(l)}\hat{\unicode[STIX]{x1D701}}_{3}^{(u)}\nonumber\\ \displaystyle & & \displaystyle \!+\,h_{123}^{(4)}\hat{\unicode[STIX]{x1D6F9}}_{1}^{(u)}\hat{\unicode[STIX]{x1D6F9}}_{2}^{(u)}\hat{\unicode[STIX]{x1D701}}_{3}^{(l)}+h_{123}^{(5)}\hat{\unicode[STIX]{x1D6F9}}_{1}^{(u)}\hat{\unicode[STIX]{x1D6F9}}_{2}^{(l)}\hat{\unicode[STIX]{x1D701}}_{3}^{(l)}+h_{123}^{(6)}\hat{\unicode[STIX]{x1D6F9}}_{1}^{(l)}\hat{\unicode[STIX]{x1D6F9}}_{2}^{(l)}\hat{\unicode[STIX]{x1D701}}_{3}^{(l)}\! ]\unicode[STIX]{x1D6FF}(\boldsymbol{k}_{1}+\boldsymbol{k}_{2}+\boldsymbol{k}_{3})\,\text{d}\boldsymbol{k}_{1}\,\text{d}\boldsymbol{k}_{2}\,\text{d}\boldsymbol{k}_{3},\nonumber\\ \displaystyle & & \displaystyle\end{eqnarray}$$
where the coupling coefficients  $h_{j}^{i}$ are given in appendix B. Here
 $k=|\boldsymbol{k}|$ denotes the wavenumber and we use the notation that subscripts represent vector arguments, i.e.
 $h_{ijl}\equiv h(\boldsymbol{k}_{i},\boldsymbol{k}_{j},\boldsymbol{k}_{l})$.
This Hamiltonian is expressed explicitly in terms of the variables at the surfaces of the fluids, and is a significant step forward over the Hamiltonian structure of the two-layer system derived in Ambrosi (Reference Ambrosi2000), where the implicit form of the Hamiltonian was obtained.
The Hamiltonian provides a firm theoretical foundation to develop the theory of weak nonlinear interactions of surface and interfacial waves. However, to describe the time evolution of the spectral energy density of the waves, the quadratic part of the Hamiltonian of the system (2.4) needs to be diagonalized, so that the linear part of the equations of motion corresponds to distinct non-interacting linear waves. In other words, we need to calculate the normal modes of the system. This task is done in the next section.
3 Canonical transformation to normal modes
In this paper we use the wave turbulence formalism (Kadomtsev Reference Kadomtsev1965; Benney & Saffmann Reference Benney and Saffmann1966; Newell Reference Newell1968; Benney & Newell Reference Benney and Newell1969; Zakharov et al. Reference Zakharov, L’vov and Falkovich1992; Nazarenko Reference Nazarenko2011) to derive the coupled set of kinetic equations, describing the spectral energy transfers in the coupled system of surface and interfacial waves. First we need to diagonalize the Hamiltonian equations of motion in wave action variables so that waves are free to leading order. This is done via two canonical transformations: the first being a transformation from interface variables to complex action density variables done in § 3.1, the second being a transformation to diagonalize the quadratic Hamiltonian, giving waves which are free to leading order, performed in § 3.2. The final form of the Hamiltonian in terms of the normal modes is also derived in § 3.2).
3.1 Transformation to complex field variable
We start from the surface variables for the Fourier image of displacement of the upper and lower layers  $\hat{\unicode[STIX]{x1D701}}_{\boldsymbol{k}}^{(i)}$ and the Fourier image of the velocity potential on upper and lower surfaces
 $\hat{\unicode[STIX]{x1D6F9}}_{\boldsymbol{k}}^{(i)}$, where
 $(i)$ denotes the layer, with
 $(u)$ being the upper layer and
 $(l)$ being the lower layer. We then perform a canonical transformation to complex action variables describing the complex amplitude of wave with wavenumber
 $\boldsymbol{k}$:
 $$\begin{eqnarray}\displaystyle \left.\begin{array}{@{}c@{}}\displaystyle \hat{\unicode[STIX]{x1D701}}_{\boldsymbol{k}}^{(u)}=\left(\frac{h_{\boldsymbol{k}}^{(2a)}}{4h_{\boldsymbol{k}}^{(1a)}}\right)^{1/4}(a_{\boldsymbol{k}}^{(u)}+a_{-\boldsymbol{k}}^{(u)\ast }),\quad \hat{\unicode[STIX]{x1D6F9}}_{\boldsymbol{k}}^{(u)}=\text{i}\left(\frac{h_{\boldsymbol{k}}^{(1a)}}{4h_{\boldsymbol{k}}^{(2a)}}\right)^{1/4}(a_{\boldsymbol{k}}^{(u)}-a_{-\boldsymbol{k}}^{(u)\ast }),\\ \displaystyle \hat{\unicode[STIX]{x1D701}}_{\boldsymbol{k}}^{(l)}=\left(\frac{h_{\boldsymbol{k}}^{(4a)}}{4h_{\boldsymbol{k}}^{(3a)}}\right)^{1/4}(a_{\boldsymbol{k}}^{(l)}+a_{-\boldsymbol{k}}^{(l)\ast }),\quad \hat{\unicode[STIX]{x1D6F9}}_{\boldsymbol{k}}^{(l)}=\text{i}\left(\frac{h_{\boldsymbol{k}}^{(3a)}}{4h_{\boldsymbol{k}}^{(4a)}}\right)^{1/4}(a_{\boldsymbol{k}}^{(l)}-a_{-\boldsymbol{k}}^{(l)\ast }).\end{array}\right\} & & \displaystyle \nonumber\end{eqnarray}$$
In these variables the Hamiltonian takes the form
 $$\begin{eqnarray}\displaystyle & \displaystyle H_{2}=\int [F_{\boldsymbol{k}}^{(1)}|a_{\boldsymbol{k}}^{(U)}|^{2}+F_{\boldsymbol{k}}^{(2)}|a_{\boldsymbol{k}}^{(L)}|^{2}+F_{\boldsymbol{k}}^{(3)}[(a_{\boldsymbol{k}}^{(U)}a_{-\boldsymbol{k}}^{(L)}-a_{\boldsymbol{k}}^{(U)}a_{\boldsymbol{k}}^{(L)\ast })+\text{c.c.}]]\,\text{d}\boldsymbol{k}, & \displaystyle\end{eqnarray}$$
 $$\begin{eqnarray}\displaystyle & \displaystyle H_{3}=\mathop{\sum }_{S_{1},S_{2},S_{3}\in \{U,L\}}\iiint \,\text{d}\boldsymbol{k}_{1}\,\text{d}\boldsymbol{k}_{2}\,\text{d}\boldsymbol{k}_{3}\hphantom{\unicode[STIX]{x1D60E}_{123}^{(S_{1}S_{2}S_{3})}a_{1}^{(S_{1})}a_{2}^{(S_{2})}a_{3}^{(S_{3})}(\unicode[STIX]{x1D6FF}_{1+2+3})+\text{c.c.}} & \displaystyle \nonumber\\ \displaystyle & \displaystyle \quad \times \,[(\unicode[STIX]{x1D61D}_{123}^{(S_{1}S_{2}S_{3})}a_{1}^{(S_{1})\ast }a_{2}^{(S_{2})\ast }a_{3}^{(S_{3})}\unicode[STIX]{x1D6FF}_{1+2-3}+\unicode[STIX]{x1D60E}_{123}^{(S_{1}S_{2}S_{3})}a_{1}^{(S_{1})}a_{2}^{(S_{2})}a_{3}^{(S_{3})}\unicode[STIX]{x1D6FF}_{1+2+3})+\text{c.c.}]. & \displaystyle\end{eqnarray}$$
This is the standard form of the wave turbulence Hamiltonian of the spatially homogeneous nonlinear system with two types of waves and with the quadratic nonlinearity. The corresponding canonical equations of motion assume standard canonical form (Zakharov et al. Reference Zakharov, L’vov and Falkovich1992):
 $$\begin{eqnarray}\displaystyle \text{i}\dot{a_{\boldsymbol{k}}}^{(U)}=\frac{\unicode[STIX]{x1D6FF}H}{\unicode[STIX]{x1D6FF}a_{\boldsymbol{k}}^{(U)\ast }},\quad \text{i}\dot{a_{\boldsymbol{k}}}^{(L)}=\frac{\unicode[STIX]{x1D6FF}H}{\unicode[STIX]{x1D6FF}a_{\boldsymbol{k}}^{(L)\ast }}. & & \displaystyle\end{eqnarray}$$
Here the coefficient functions are given by
 $$\begin{eqnarray}\displaystyle F_{\boldsymbol{k}}^{(1)}=\sqrt{h_{\boldsymbol{k}}^{(1a)}h_{\boldsymbol{k}}^{(2a)}},\quad F_{\boldsymbol{k}}^{(2)}=\sqrt{h_{\boldsymbol{k}}^{(3a)}h_{\boldsymbol{k}}^{(4a)}},\quad F_{\boldsymbol{k}}^{(3)}=-\frac{h_{\boldsymbol{k},-\boldsymbol{k}}^{(5)}}{4}\left[\frac{h_{\boldsymbol{k}}^{(1a)}h_{\boldsymbol{ k}}^{(3a)}}{h_{\boldsymbol{k}}^{(2a)}h_{\boldsymbol{k}}^{(4a)}}\right]^{1/4},\quad & & \displaystyle \nonumber\end{eqnarray}$$
with the matrix elements  $\unicode[STIX]{x1D61D}_{123}^{(S_{1}S_{2}S_{3})}$ and
 $\unicode[STIX]{x1D60E}_{123}^{(S_{1}S_{2}S_{3})}$ given in appendix C.
3.2 Hamiltonian in terms of normal mode amplitudes
We now need to diagonalize the quadratic part of the resulting Hamiltonian. We perform this task by finding a canonical transformation that would decouple linear waves of the Hamiltonian (3.1). In other words, we are seeking a canonical transformation to remove the term  $F_{\boldsymbol{k}}^{(3)}[(a_{\boldsymbol{k}}^{(U)}a_{-\boldsymbol{k}}^{(L)}-a_{\boldsymbol{k}}^{(U)}a_{\boldsymbol{k}}^{(L)\ast })+\text{c.c.}]$ from the Hamiltonian (3.1). The transformation is given by equation (C 5) of appendix C. As a result we obtain the normal modes of the system while maintaining the canonical structure of the equations of motion. Finding such a transformation to determine the normal modes of the system appears to be a non-trivial task, since we needed to solve an overdetermined system of nonlinear algebraic equations. Details of this procedure are explained in appendix C. Applying the transformation (C 5) to (2.4), the quadratic part of the Hamiltonian assumes the desired form
 $$\begin{eqnarray}\displaystyle H_{2}=\int [\tilde{\unicode[STIX]{x1D714}}_{\boldsymbol{k}}^{(S)}|c_{\boldsymbol{k}}^{(S)}|^{2}+\tilde{\unicode[STIX]{x1D714}}_{\boldsymbol{k}}^{(I)}|c_{\boldsymbol{k}}^{(I)}|^{2}]\,\text{d}\boldsymbol{k}, & & \displaystyle \nonumber\end{eqnarray}$$
where the superscripts  $S$ and
 $I$ correspond to the respective surface or interfacial normal modes.
The linear dispersion relationships of the surface and interfacial normal modes are given by
 $$\begin{eqnarray}\displaystyle & \displaystyle \tilde{\unicode[STIX]{x1D714}}_{\boldsymbol{k}}^{(I)}=\unicode[STIX]{x1D6FC}_{\boldsymbol{k}}\cosh 2\unicode[STIX]{x1D719}_{\boldsymbol{k}}+2\unicode[STIX]{x1D6FE}_{\boldsymbol{k}}\sinh 2\unicode[STIX]{x1D719}_{\boldsymbol{k}}, & \displaystyle\end{eqnarray}$$
 $$\begin{eqnarray}\displaystyle & \displaystyle \tilde{\unicode[STIX]{x1D714}}_{\boldsymbol{k}}^{(S)}=\unicode[STIX]{x1D6FD}_{\boldsymbol{k}}\cosh 2\unicode[STIX]{x1D713}_{\boldsymbol{k}}+2\unicode[STIX]{x1D701}_{\boldsymbol{k}}\sinh 2\unicode[STIX]{x1D713}_{\boldsymbol{k}}, & \displaystyle\end{eqnarray}$$
 $$\begin{eqnarray}\displaystyle H_{3} & = & \displaystyle \mathop{\sum }_{S_{1},S_{2},S_{3}\in \{S,I\}}\iiint \,\text{d}\boldsymbol{k}_{1}\,\text{d}\boldsymbol{k}_{2}\,\text{d}\boldsymbol{k}_{3}\nonumber\\ \displaystyle & & \displaystyle \times \,[(\unicode[STIX]{x1D611}_{123}^{(S_{1}S_{2}S_{3})}c_{1}^{(S_{1})\ast }c_{2}^{(S_{2})\ast }c_{3}^{(S_{3})}\unicode[STIX]{x1D6FF}_{1+2-3}+\unicode[STIX]{x1D613}_{123}^{(S_{1}S_{2}S_{3})}c_{1}^{(S_{1})}c_{2}^{(S_{2})}c_{3}^{(S_{3})}\unicode[STIX]{x1D6FF}_{1+2+3})+\text{c.c.}].\nonumber\end{eqnarray}$$
Here  $\unicode[STIX]{x1D611}_{123}^{(S_{1}S_{2}S_{3})}$ and
 $\unicode[STIX]{x1D613}_{123}^{(ijk)}$ are the interaction matrix elements, also called scattering cross-sections. These matrix elements describe the strength of the nonlinear coupling between wavenumbers of
 $\boldsymbol{k}_{1}$,
 $\boldsymbol{k}_{2}$ and
 $\boldsymbol{k}_{3}$ of the normal modes of types
 $S_{1}$,
 $S_{2}$ and
 $S_{3}$. Calculation of these matrix elements is a tedious but straightforward task completed in appendix D. An alternative, but equivalent, formulation is described in detail for both the resonant and near-resonant cases in Choi (Reference Choi2019). Knowledge of these matrix elements and the linear dispersion relations allows us to use the wave turbulence formalism to derive the kinetic equations describing the time evolution of the spectral energy density of interacting waves. This is done in the next section.
4 Statistical approach via wave turbulence theory
In wave turbulence the system is represented as a superposition of  $N$ large waves with complex amplitudes
 $c_{\boldsymbol{k}}^{(S)}(t)$,
 $c_{\boldsymbol{k}}^{(I)}(t)$ interacting with each other. In essence, the classical wave turbulence theory is a perturbation expansion of complex wave amplitudes in terms of the nonlinearity, yielding, at leading order, linear waves, with amplitudes slowly modulated at higher orders by resonant nonlinear interaction. This modulation leads to a resonant or near-resonant redistribution of the spectral energy density among length scales, and is described by a system of kinetic equations, the time evolution equations for the wave spectra of surface and interfacial waves, respectively:
 $$\begin{eqnarray}\displaystyle & \displaystyle n^{(S)}(\boldsymbol{k},t)\unicode[STIX]{x1D6FF}(\boldsymbol{k}-\boldsymbol{k}^{\prime })=\langle c_{\boldsymbol{k}}^{(S)}{c_{\boldsymbol{k}^{\prime }}^{(S)}}^{\ast }\rangle , & \displaystyle\end{eqnarray}$$
 $$\begin{eqnarray}\displaystyle & \displaystyle n^{(I)}(\boldsymbol{k},t)\unicode[STIX]{x1D6FF}(\boldsymbol{k}-\boldsymbol{k}^{\prime })=\langle c_{\boldsymbol{k}}^{(I)}{c_{\boldsymbol{k}^{\prime }}^{(I)}}^{\ast }\rangle , & \displaystyle\end{eqnarray}$$
 $\langle \cdots \rangle$ denotes an ensemble average over all possible realizations of the systems.
Wave turbulence theory has led to spectacular success in predicting spectral energy densities in the ocean, atmosphere and plasma (see Zakharov et al. (Reference Zakharov, L’vov and Falkovich1992) and Nazarenko (Reference Nazarenko2011) for reviews).
4.1 Kinetic equations
The kinetic equation is the classical analogue of the Boltzmann collision integral. The basic ideas for writing down the kinetic equation to describe how weakly interacting waves share their energies go back to Peierls. The modern theory has its origin in the works of Hasselmann, Benney and Saffmann, Kadomtsev, Zakharov, and Benney and Newell.
There are many ways of deriving the kinetic equation which are well understood and well studied (Benney & Saffmann Reference Benney and Saffmann1966; Zakharov et al. Reference Zakharov, L’vov and Falkovich1992; Choi, Lvov & Nazarenko Reference Choi, Lvov and Nazarenko2004, Reference Choi, Lvov and Nazarenko2005; Lvov & Nazarenko Reference Lvov and Nazarenko2004; Nazarenko Reference Nazarenko2011; Choi et al. Reference Choi, Lvov, Nazarenko and Pokorni2005). Here we use the slightly more general approach for the derivation of the kinetic equations, which allows not only for resonant, but also for near-resonant interactions, as was done in Lvov et al. (Reference Lvov, Lvov, Newell and Zakharov1997) and Lvov, Polzin & Yokoyama (Reference Lvov, Polzin and Yokoyama2012). We generalize Lvov et al. (Reference Lvov, Lvov, Newell and Zakharov1997, Reference Lvov, Polzin and Yokoyama2012) for the case of a system of two types of interacting waves, namely surface and interfacial waves. The resulting system of kinetic equations is
 $$\begin{eqnarray}\displaystyle {\dot{n}}^{(S_{0})}(\boldsymbol{k},t) & = & \displaystyle \mathop{\sum }_{S_{1},S_{2}\in \{S,I\}}\iint \,\text{d}\boldsymbol{k}_{1}\,\text{d}\boldsymbol{k}_{2}\times (\!|\unicode[STIX]{x1D611}_{012}^{(S_{0}S_{1}S_{2})}|^{2}f_{012}^{(S_{0}S_{1}S_{2})}\unicode[STIX]{x1D6FF}(\boldsymbol{k}-\boldsymbol{k}_{1}-\boldsymbol{k}_{2}){\mathcal{L}}_{\boldsymbol{k},\boldsymbol{k}_{1},\boldsymbol{k}_{2}}^{(S_{0}S_{1}S_{2})}\nonumber\\ \displaystyle & & \displaystyle -\,2|\unicode[STIX]{x1D611}_{102}^{(S_{1}S_{0}S_{2})}|^{2}f_{102}^{(S_{1}S_{0}S_{2})}\unicode[STIX]{x1D6FF}(\boldsymbol{k}_{1}-\boldsymbol{k}-\boldsymbol{k}_{2}){\mathcal{L}}_{\boldsymbol{k}_{1},\boldsymbol{k},\boldsymbol{k}_{2}}^{(S_{1}S_{0}S_{2})}\! ),\quad S_{0}\in \{S,I\},\end{eqnarray}$$
where  $f^{(S_{1}S_{2}S_{3})}$ is the three-wave kinetic equation kernel for two types of waves:
 $$\begin{eqnarray}\displaystyle f_{123}^{(S_{1}S_{2}S_{3})}=n_{1}^{(S_{1})}n_{2}^{(S_{2})}n_{3}^{(S_{3})}\left(\frac{1}{n_{1}^{(S_{1})}}-\frac{1}{n_{2}^{(S_{2})}}-\frac{1}{n_{3}^{(S_{3})}}\right). & & \displaystyle \nonumber\end{eqnarray}$$
The frequency-conserving Dirac delta function is replaced by its broadened version, the Lorenzian  ${\mathcal{L}}$:
 $$\begin{eqnarray}\displaystyle \left.\begin{array}{@{}c@{}}\displaystyle {\mathcal{L}}_{\boldsymbol{k},\boldsymbol{k}_{1},\boldsymbol{k}_{2}}^{(S_{1}S_{2}S_{3})}=\frac{\unicode[STIX]{x1D6E4}_{\boldsymbol{k}_{1},\boldsymbol{k}_{2},\boldsymbol{k}_{3}}^{(S_{1}S_{2}S_{3})}}{\left(\unicode[STIX]{x1D714}_{\boldsymbol{k}}^{(S_{1})}-\unicode[STIX]{x1D714}_{\boldsymbol{k}_{2}}^{(S_{2})}-\unicode[STIX]{x1D714}_{\boldsymbol{k}_{2}}^{(S_{2})}\right)^{2}+\left(\unicode[STIX]{x1D6E4}_{\boldsymbol{k},\boldsymbol{k}_{1},\boldsymbol{k}_{2}}^{(S_{1}S_{2}S_{3})}\right)^{2}},\\ \displaystyle \unicode[STIX]{x1D6E4}_{\boldsymbol{k}_{1},\boldsymbol{k}_{2},\boldsymbol{k}_{3}}^{(S_{1}S_{2}S_{3})}=\unicode[STIX]{x1D6FE}_{1}^{(S_{i})}+\unicode[STIX]{x1D6FE}_{2}^{(S_{i})}+\unicode[STIX]{x1D6FE}_{3}^{(S_{i})},\\ \displaystyle \unicode[STIX]{x1D6FE}_{\boldsymbol{k}}^{(S_{0})}=\mathop{\sum }_{S_{1},S_{2}\in \{S,I\}}\iint \,\text{d}\boldsymbol{k}_{1}\,\text{d}\boldsymbol{k}_{2} (\!|\unicode[STIX]{x1D611}_{012}^{(S_{0}S_{1}S_{2})}|^{2}(n_{1}^{(S_{1})}+n_{2}^{(S_{2})})\unicode[STIX]{x1D6FF}(\boldsymbol{k}-\boldsymbol{k}_{1}-\boldsymbol{k}_{2}){\mathcal{L}}_{\boldsymbol{k},\boldsymbol{k}_{1},\boldsymbol{k}_{2}}^{(S_{0}S_{1}S_{2})}\\ \displaystyle \quad -2|\unicode[STIX]{x1D611}_{102}^{(S_{1}S_{0}S_{2})}|^{2}(n_{1}^{(S_{1})}-n_{2}^{(S_{2})})\unicode[STIX]{x1D6FF}(\boldsymbol{k}_{1}-\boldsymbol{k}-\boldsymbol{k}_{2}){\mathcal{L}}_{\boldsymbol{k}_{1},\boldsymbol{k},\boldsymbol{k}_{2}}^{(S_{1}S_{0}S_{2})} ),\quad S_{0}\in \{S,I\}.\end{array}\right\} & & \displaystyle\end{eqnarray}$$
Here  $\unicode[STIX]{x1D6E4}_{\boldsymbol{k}_{1},\boldsymbol{k}_{2},\boldsymbol{k}_{3}}^{(j)}$ is the total broadening of a given resonance between wavenumbers
 $\boldsymbol{k}_{1},\boldsymbol{k}_{2},\boldsymbol{k}_{3}$, and
 $\unicode[STIX]{x1D6FE}_{i}^{(S_{i})}$ is the Boltzmann rate for wavevector
 $(\boldsymbol{k}_{i},S_{i})$.
The principal new feature of this system of kinetic equations is that instead of the resonant interactions taking place along Dirac delta functions, the near-resonances appear acting along the broadened resonant manifold that includes not only resonant, but also near-resonant interactions, as was done in Lvov et al. (Reference Lvov, Lvov, Newell and Zakharov1997, Reference Lvov, Polzin and Yokoyama2012).
The interpretation of this formula is the following. Nonlinear wave–wave interactions lead to a change of wave amplitude, which in turn makes the lifetime of the waves to be finite. Consequently, interactions can be near-resonant. A self-consistent evaluation of  $\unicode[STIX]{x1D6FE}_{\boldsymbol{k}}$ requires the iterative solution of (4.2) and (4.3) over the entire field. Indeed, one can see from (4.3) that the width of the resonance depends on the lifetime of an individual wave, which in turn depends on the resonance width over which wave interactions occur.
We define our characteristic time for interfacial wave growth to be  $\unicode[STIX]{x1D70F}_{i}^{(S_{i})}=-1/\unicode[STIX]{x1D6FE}_{i}^{(S_{i})}$, i.e. the
 $\text{e}$-scaling rate of the action density variable
 $n_{i}^{(S_{i})}$. Together (4.2)–(4.3) form a closed set of equations which can be iteratively solved to obtain the time evolution of the energy spectrum of surface and interfacial waves.
4.2 Three-wave resonances
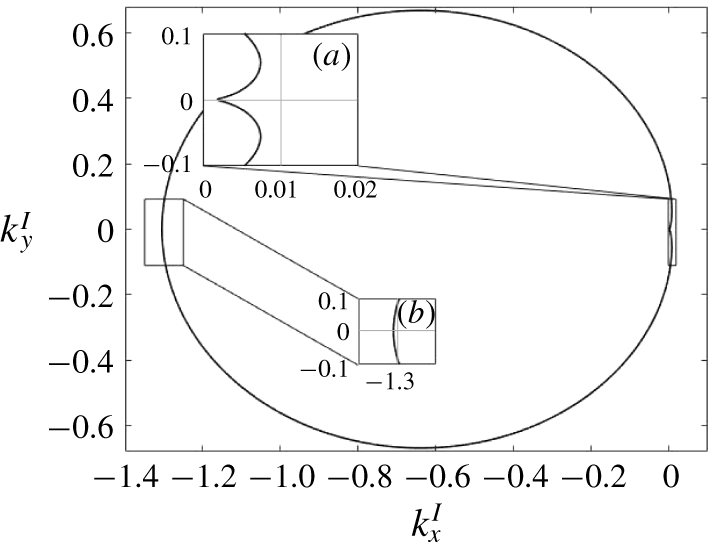
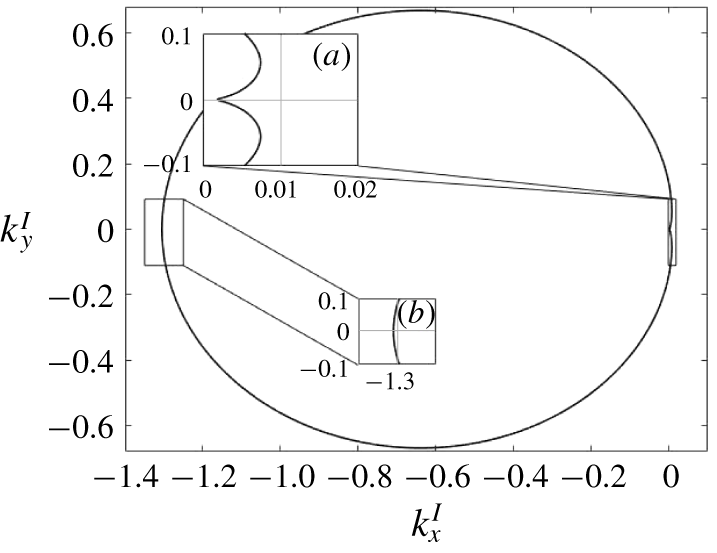
The resonant set of interfacial wavenumbers for fixed surface wavenumber  $\unicode[STIX]{x1D705}=(2\unicode[STIX]{x03C0}/10)~\text{m}^{-1}$. (a) Class III and surrounding resonances; (b) class I and surrounding resonances.
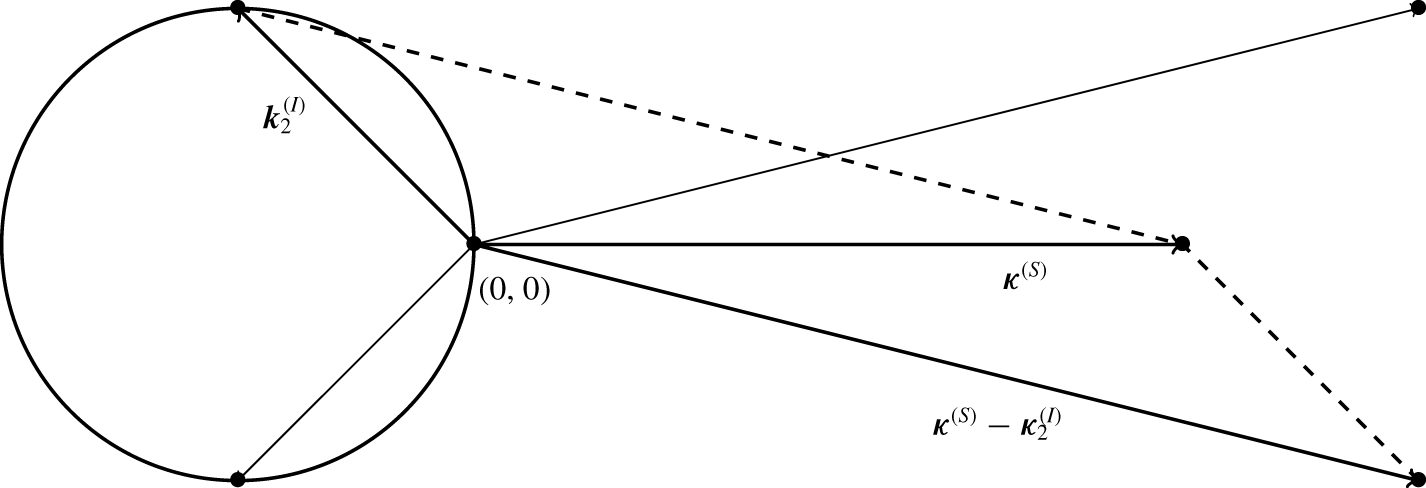
Schematic construction of three-wave resonances as determined by a fixed surface wave  $\unicode[STIX]{x1D73F}$ and the corresponding set of resonant interfacial waves, as done in Ball (Reference Ball1964). Two of such triads are depicted.

Wave turbulence theory considers resonant wave–wave interactions. The rationale for this is that out of all possible interactions of three wavenumbers it is only resonant and near-resonant interactions that lead to the effective irreversible energy exchange between wavenumbers. Consequently, we seek wavenumbers that satisfy resonances of the form
 $$\begin{eqnarray}\displaystyle & \displaystyle \boldsymbol{k}_{1}\pm \boldsymbol{k}_{2}\pm \boldsymbol{k}_{3}=0, & \displaystyle\end{eqnarray}$$
 $$\begin{eqnarray}\displaystyle & \displaystyle \unicode[STIX]{x1D714}_{1}^{(S_{1})}\pm \unicode[STIX]{x1D714}_{2}^{(S_{2})}\pm \unicode[STIX]{x1D714}_{3}^{(S_{3})}=0,\quad S_{1},S_{2},S_{3}\in \{S,I\}. & \displaystyle\end{eqnarray}$$
In figure 2 we plot an example of the two-dimensional resonant set as described in Ball (Reference Ball1964) and Thorpe (Reference Thorpe1966). We first fix the surface wavenumber  $\boldsymbol{k}_{1}^{S}$ to be a fixed, given number. We arbitrarily choose
 $\boldsymbol{k}_{1}^{S}=2\unicode[STIX]{x03C0}/10$, and calculate wavenumbers
 $\boldsymbol{k}_{2}^{I}$ and
 $\boldsymbol{k}_{3}^{S}$ so that the conditions
 $\boldsymbol{k}_{1}^{S}=\boldsymbol{k}_{2}^{I}+\boldsymbol{k}_{3}^{S}$ and
 $\unicode[STIX]{x1D714}_{1}^{(S)}=\unicode[STIX]{x1D714}_{2}^{(I)}+\unicode[STIX]{x1D714}_{3}^{(S)}$ are satisfied. We then plot the corresponding values of the interfacial wavenumber
 $\boldsymbol{k}_{2}^{I}$. Schematically, this construction process is depicted in figure 3.
The intercept in figure 2(a) corresponds to the case when the interfacial wave co-propagates in the direction of surface waves; this precisely corresponds to the class III resonances studied in Alam (Reference Alam2012). We note that in this case the interfacial waves excited are much longer and slower than the surface wave, because comparatively it takes much less energy to distort the interface between the layers than it does to lift and disturb the upper layer. In the interfacial wave case the heavier fluid is lifted in slightly less dense fluid, while for the surface waves the water is lifted into the air.
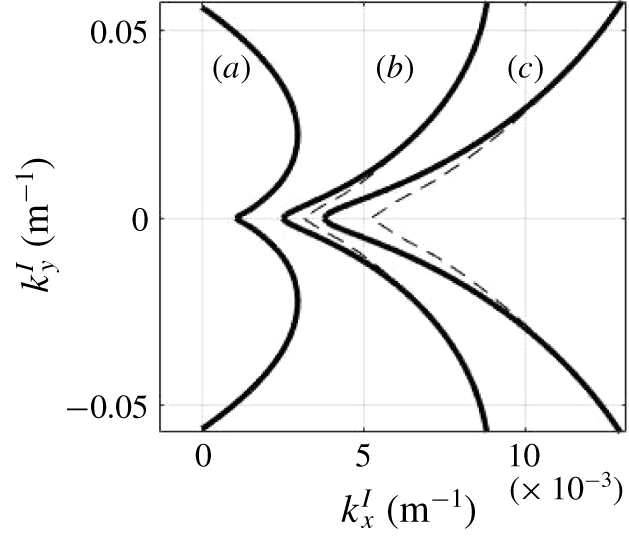
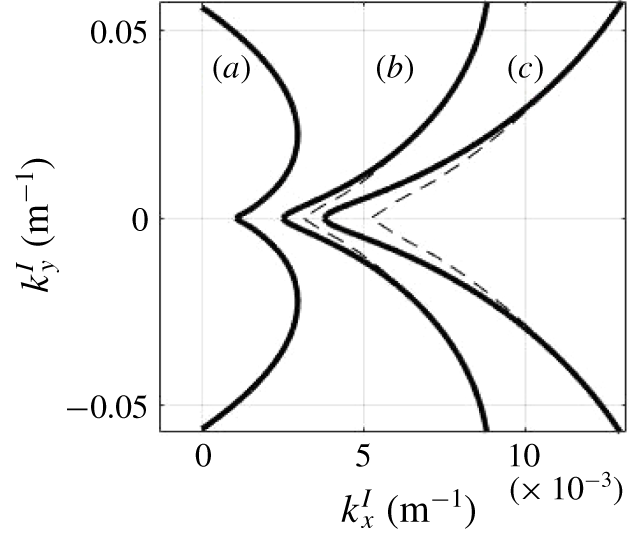
Similarly, the intercept in figure 2(b) corresponds to counter-propagating waves in class I resonance. Notably, the resonance curves are not scale-invariant; figure 4 depicts the resonance curves for the cases of fixed surface wavenumber  $\unicode[STIX]{x1D705}=(2j\unicode[STIX]{x03C0}/25)~\text{m}^{-1}$,
 $j=1,3,5$, with the dashed lines depicting the first resonance curve scaled by the respective factors of three and five. While the resonant manifold is approximately scale-invariant for large wavenumbers, scale invariance is particularly violated near the class III collinear resonance. This change in structure results in a different regime of dynamics for longer surface wavelengths, as we will see in § 5.1.
Resonances are not scale-invariant: the solid curve depicts interfacial wavenumbers in resonance when one surface wavenumber is fixed to be (a)  $\unicode[STIX]{x1D705}=(2\unicode[STIX]{x03C0}/25)~\text{m}^{-1}$, (b)
 $\unicode[STIX]{x1D705}=(3\times 2\unicode[STIX]{x03C0}/25)~\text{m}^{-1}$ and (c)
 $\unicode[STIX]{x1D705}=(5\times 2\unicode[STIX]{x03C0}/25)~\text{m}^{-1}$. The dashed curves correspond to scaling curve (a) by factors of 3 and 5.
5 Energy transfer in the JONSWAP spectrum
5.1 Surface plane wave
5.1.1 Formulation of the problem
Let us now consider a model problem of a single plane wave on the surface of the top layer and an interfacial layer that is at rest initially at  $t=0$. While this problem may seem to be oversimplified, it is motivated by real oceanographic scenarios. Indeed, when wind blows on top of the ocean, the spectral energy density of the generated surface gravity waves has a prominent narrow peak for a specific wavenumber. We denote this wavevector of the initial surface wave distribution by
 $\unicode[STIX]{x1D73F}$, and assume that the lower interface is undisturbed except for small-amplitude noise
 $\unicode[STIX]{x1D716}_{n}$. Such a choice corresponds to the initial conditions
 $$\begin{eqnarray}\displaystyle & \displaystyle n^{(S)}(\boldsymbol{k},t=0)=\tilde{A}\unicode[STIX]{x1D6FF}(\boldsymbol{k}-\unicode[STIX]{x1D73F}), & \displaystyle\end{eqnarray}$$
 $$\begin{eqnarray}\displaystyle & \displaystyle n^{(I)}(\boldsymbol{k},t=0)=O(\unicode[STIX]{x1D716}_{n}). & \displaystyle\end{eqnarray}$$
In physical space such choice corresponds to
 $$\begin{eqnarray}\displaystyle \unicode[STIX]{x1D701}_{1}(\boldsymbol{x},t=0)=A\cos (\unicode[STIX]{x1D73F}\boldsymbol{\cdot }\boldsymbol{x}-\unicode[STIX]{x1D714}_{\unicode[STIX]{x1D73F}}t),\quad \unicode[STIX]{x1D701}_{1}(\boldsymbol{x},t=0)=\unicode[STIX]{x1D716}_{n}. & & \displaystyle \nonumber\end{eqnarray}$$
In the calculations below, we take the surface wavenumber  $\unicode[STIX]{x1D73F}$ to correspond to the peak wavenumber of the JONSWAP spectrum (Hassleman et al. Reference Hassleman, Barnett, Bouws and Carlson1973). Here, the one-dimensional JONSWAP spectrum can be expressed in terms of
 $U_{19.5}$, the wind speed 19.5 m above the ocean surface, and is given by
 $$\begin{eqnarray}\displaystyle \left.\begin{array}{@{}c@{}}\displaystyle S(\unicode[STIX]{x1D714})=\frac{\unicode[STIX]{x1D6FC}g^{2}}{\unicode[STIX]{x1D714}^{5}}\exp \left(-\frac{5}{4}\left(\frac{\unicode[STIX]{x1D714}_{0}}{\unicode[STIX]{x1D714}}\right)^{4}\right)\unicode[STIX]{x1D6FE}^{r},\\ \displaystyle r=\exp \left(-\frac{(\unicode[STIX]{x1D714}-\unicode[STIX]{x1D714}_{0})^{2}}{2\unicode[STIX]{x1D70E}^{2}\unicode[STIX]{x1D714}_{0}^{2}}\right),\quad \unicode[STIX]{x1D714}_{0}=g/U_{19.5},\quad \unicode[STIX]{x1D70E}=\left\{\begin{array}{@{}ll@{}}0.07,\quad & \text{if }\unicode[STIX]{x1D714}\leqslant \unicode[STIX]{x1D714}_{0},\\ 0.09,\quad & \text{if }\unicode[STIX]{x1D714}>\unicode[STIX]{x1D714}_{0}.\end{array}\right.\end{array}\right\} & & \displaystyle\end{eqnarray}$$
Consequently, the peak wavenumber  $\unicode[STIX]{x1D73F}$ and wave amplitude
 $A$ that we use are determined solely by the speed of the wind. Due to the surface spectrum being unidirectional, the dominant energy exchange from the surface to interfacial spectrum occurs on and near the class III resonance (Alam Reference Alam2012).
Substituting (5.1) into (4.3), dropping terms of order  $\unicode[STIX]{x1D716}_{n}$ and keeping only the resonant and near-resonant terms, we obtain the following algebraic equations for the Boltzmann rates of the interfacial and surface wave fields at
 $t=0$:
 $$\begin{eqnarray}\displaystyle & \displaystyle \unicode[STIX]{x1D6FE}_{\boldsymbol{k}}^{(I)}(t=0)=-2\unicode[STIX]{x03C0}\tilde{A}|\unicode[STIX]{x1D611}^{(SIS)}(\unicode[STIX]{x1D73F},\boldsymbol{k},\unicode[STIX]{x1D73F}-\boldsymbol{k})|^{2}{\mathcal{L}}(\tilde{\unicode[STIX]{x1D714}}^{(S)}(\unicode[STIX]{x1D73F})-\tilde{\unicode[STIX]{x1D714}}^{(I)}(\boldsymbol{k})-\tilde{\unicode[STIX]{x1D714}}^{(S)}(\unicode[STIX]{x1D73F}-\boldsymbol{k})), & \displaystyle \nonumber\\ \displaystyle & \displaystyle \unicode[STIX]{x1D6FE}_{\boldsymbol{k}}^{(S)}(t=0)=2\unicode[STIX]{x03C0}\tilde{A}|\unicode[STIX]{x1D611}^{(SIS)}(\unicode[STIX]{x1D73F},\unicode[STIX]{x1D73F}-\boldsymbol{k},\boldsymbol{k})|^{2}{\mathcal{L}}(\tilde{\unicode[STIX]{x1D714}}^{(S)}(\unicode[STIX]{x1D73F})-\tilde{\unicode[STIX]{x1D714}}^{(I)}(\unicode[STIX]{x1D73F}-\boldsymbol{k})-\tilde{\unicode[STIX]{x1D714}}^{(S)}(\boldsymbol{k})),\quad \boldsymbol{k}\in R_{III}. & \displaystyle \nonumber\\ \displaystyle & & \displaystyle\end{eqnarray}$$
5.1.2 Unidirectional wave propagation
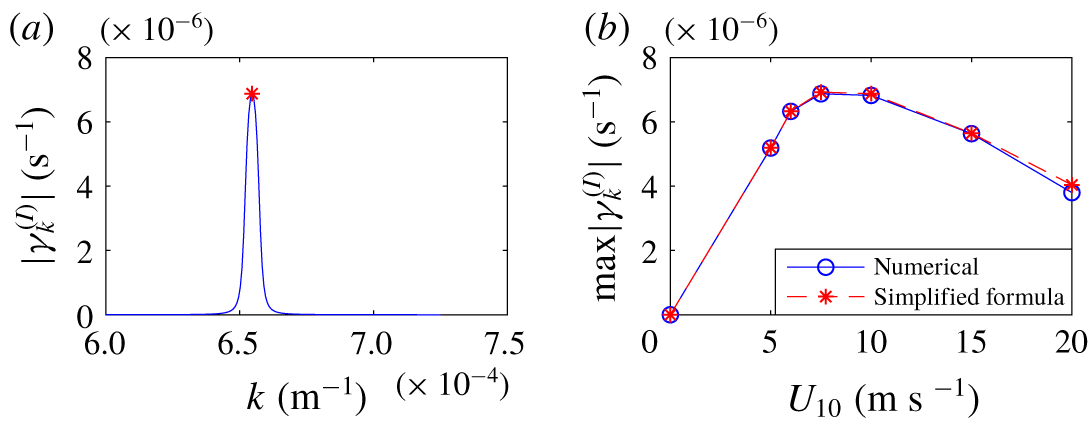
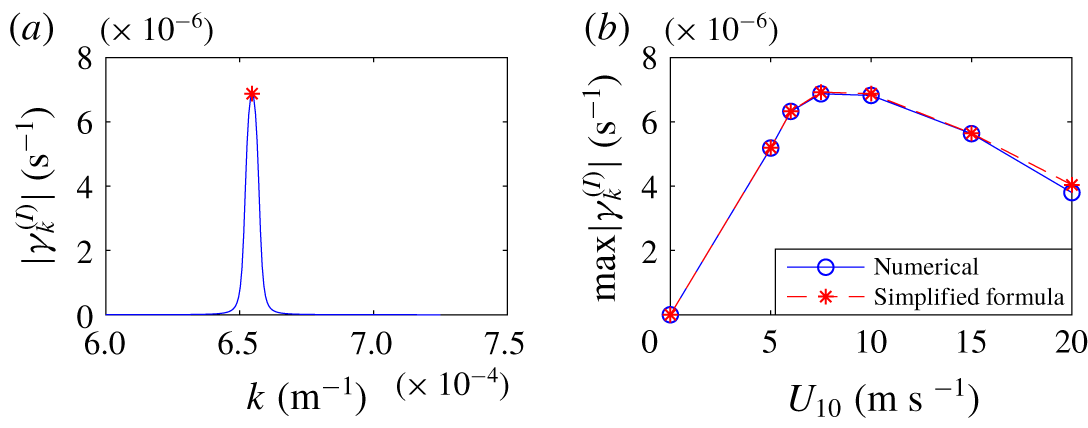
We now consider unidirectional wave propagation. We find the self-consistent value for  $\unicode[STIX]{x1D6FE}_{\boldsymbol{k}}^{(I)}$ by numerically solving the one-dimensional version of the algebraic equation (5.4). The numerical solution for the growth rate of interfacial waves collinear to the surface wave is shown in figure 5(a) for a surface wavenumber of
 $\unicode[STIX]{x1D73F}=(2\unicode[STIX]{x03C0}/19)~\text{m}^{-1}$. Here the results were obtained by iterating (5.4). The value of
 $\unicode[STIX]{x1D6FE}_{\boldsymbol{k}}^{(I)}$ appears to be narrowly peaked around the resonant frequency
 $\unicode[STIX]{x1D714}_{\boldsymbol{k}}^{(I)}=\unicode[STIX]{x1D714}_{\unicode[STIX]{x1D73F}}^{(S)}-\unicode[STIX]{x1D714}_{\unicode[STIX]{x1D73F}-\boldsymbol{k}}^{(S)}$. We now vary the value of the wind speed and plot the magnitude of the value of the peak of
 $\unicode[STIX]{x1D6FE}^{(I)}(\boldsymbol{k})$ as a function of the wind speed. Results are shown in figure 5(b). We see that for a wind speed of roughly
 $8~\text{m}~\text{s}^{-1}$ there is a much more effective transfer of energy to the interfacial waves than at lower or higher wind speeds. Interestingly, this wind speed is around that at which white capping starts to occur. Here the parameters used are
 $\unicode[STIX]{x1D70C}_{u}=1027~\text{kg}~\text{m}^{-3}$,
 $\unicode[STIX]{x0394}\unicode[STIX]{x1D70C}=1~\text{kg}~\text{m}^{-3}$,
 $h_{u}=800~\text{m}$ and
 $h_{l}=4000~\text{m}$. We can actually analytically estimate the amplitude of the peak using the following arguments. If we choose the interfacial wavenumber
 $\boldsymbol{k}_{0}$ so that the resonance condition is satisfied, i.e.
 $\unicode[STIX]{x1D714}_{\unicode[STIX]{x1D73F}}^{(S)}-\unicode[STIX]{x1D714}_{\unicode[STIX]{x1D73F}-\boldsymbol{k}_{0}}^{(S)}-\unicode[STIX]{x1D714}_{\boldsymbol{k}_{0}}^{(I)}=0$, and assume that
 $\unicode[STIX]{x1D6FE}_{\unicode[STIX]{x1D73F}}^{(S)},\unicode[STIX]{x1D6FE}_{\unicode[STIX]{x1D73F}-\boldsymbol{k}}^{(S)}\ll \unicode[STIX]{x1D6FE}_{\boldsymbol{k}}^{(I)}$, we obtain the following estimate for the growth rate of the resonant interfacial wavenumber
 $\boldsymbol{k}_{0}$:
 $$\begin{eqnarray}\displaystyle \unicode[STIX]{x1D6FE}_{\boldsymbol{k}_{0}}^{(I)}(t=0)=\sqrt{2\unicode[STIX]{x03C0}\tilde{A}}|\unicode[STIX]{x1D611}^{(SIS)}(\unicode[STIX]{x1D73F},\boldsymbol{k}_{0},\unicode[STIX]{x1D73F}-\boldsymbol{k}_{0})|. & & \displaystyle\end{eqnarray}$$
The amplitude of  $\unicode[STIX]{x1D6FE}$ found by this equation is shown as red dots in figure 5; the result agrees with the peak values given by iterating (5.4), plotted in blue.
(a) Comparison of numerical solution of (5.4) and the analytical value of the peak growth rate using (5.5) for a surface spectrum with wind speed of  $10~\text{m}~\text{s}^{-1}$. (b) Peak growth rate of interfacial waves versus the wind speed for various values of wind speed according to both formulas.
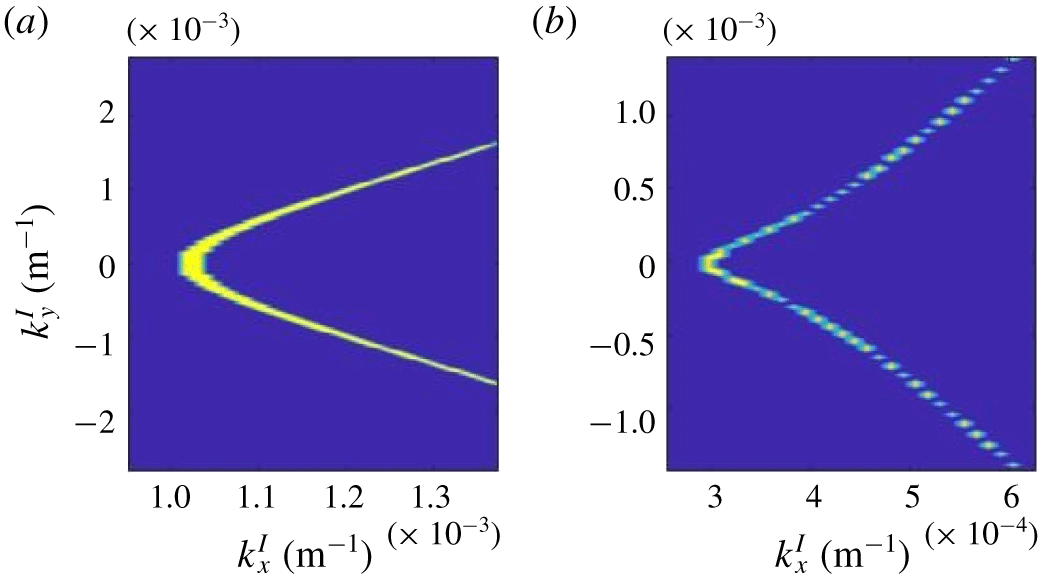
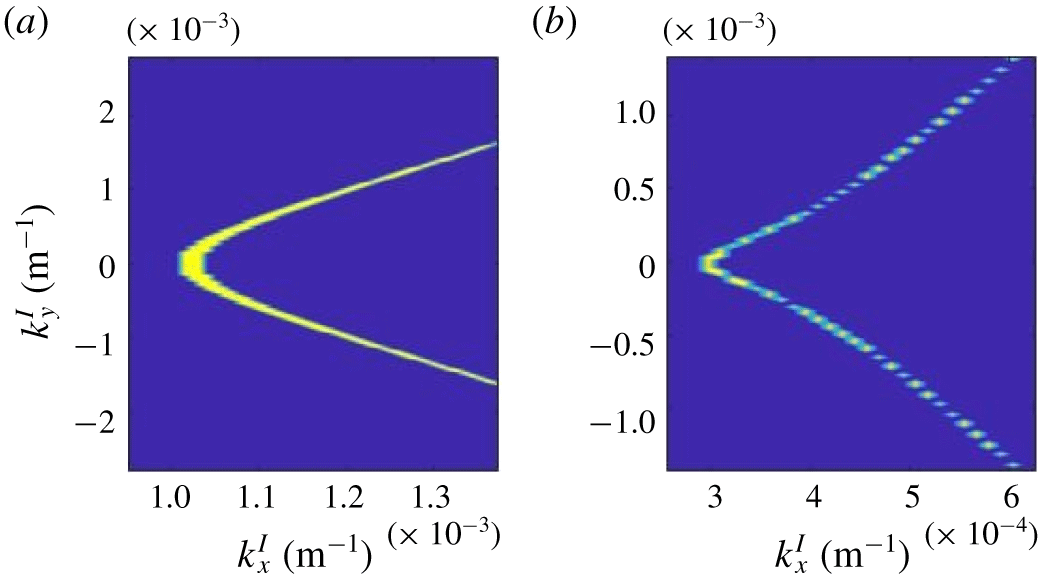
Now that we have numerically evaluated the resonance width function  $\unicode[STIX]{x1D6E4}$, we can visualize the broadening of the resonant manifold. So we broaden the resonant manifold (4.5) by allowing not only resonant, but also near-resonant interactions. We therefore replace resonant condition (4.5) by a more general condition:
 $$\begin{eqnarray}\displaystyle R_{III}=\{\boldsymbol{k}_{I}:|\tilde{\unicode[STIX]{x1D714}}^{(S)}(\unicode[STIX]{x1D73F})-\tilde{\unicode[STIX]{x1D714}}^{(I)}(\boldsymbol{k}_{I})-\tilde{\unicode[STIX]{x1D714}}^{(S)}(\unicode[STIX]{x1D73F}-\boldsymbol{k}_{I}))|<\unicode[STIX]{x1D6E4}_{\unicode[STIX]{x1D73F},\boldsymbol{k}_{I},\unicode[STIX]{x1D73F}-\boldsymbol{k}_{I}}^{(SIS)}\}. & & \displaystyle\end{eqnarray}$$
The results are depicted in in figure 6, for the cases of the surface being a plane wave of wavelength 20 and 80 m. This figure replaces figure 2(a) inset and figure 4. Here the amplitude of the plane wave is determined from the JONSWAP spectrum. We observe that the greatest broadening of the resonant curves occurs at and around the class III collinear resonance.
Resonance curves as plotted in figure 4 including physical width for (a)  $\unicode[STIX]{x1D706}=20~\text{m}$ surface spectrum and (b)
 $\unicode[STIX]{x1D706}=80~\text{m}$ surface spectrum.
5.1.3 Unidirectional surface wave can generate oblique interfacial waves
We now remove the constraint of surface and interfacial waves being collinear and consider the more general case of arbitrary angle between them. Indeed, we observe that (5.5) can be evaluated for resonant two-dimensional interfacial wavenumbers which are not necessarily collinear to  $\unicode[STIX]{x1D73F}$. Consequently, we calculate the peak growth rate for interfacial waves all along the resonance curve, of which the general shape is depicted in figure 2.
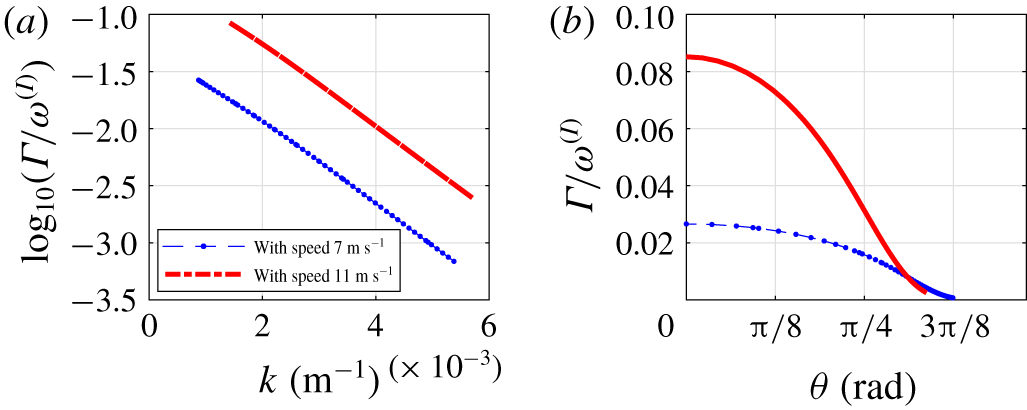
The ratio between the resonance width  $\unicode[STIX]{x1D6E4}_{\unicode[STIX]{x1D73F},\unicode[STIX]{x1D73F}-\boldsymbol{k}_{I},\boldsymbol{k}_{I}}^{(2)}$ and the frequency of the excited interfacial wave
 $\unicode[STIX]{x1D714}_{\boldsymbol{k}^{I}}^{(I)}$ for two different wind speeds, as a function of wavenumber and angle along the resonance curve.
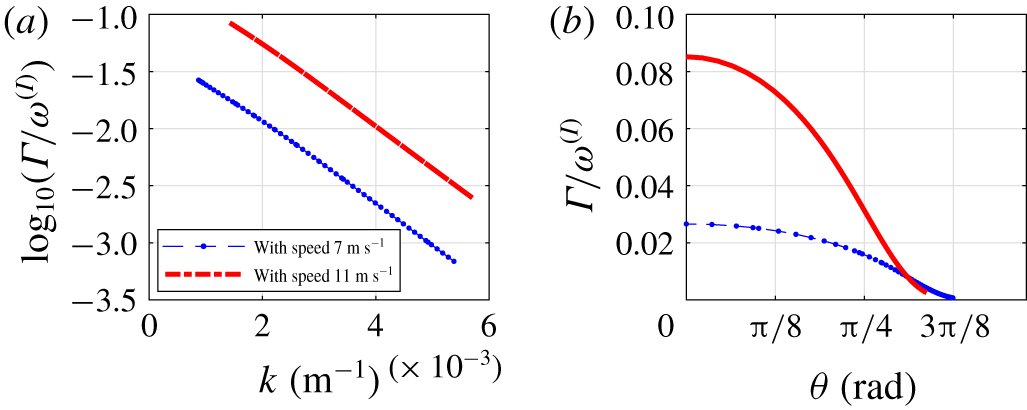
In figure 7 we plot the ratio of the resonance width and the frequency of the interfacial wave which is excited,  $\unicode[STIX]{x1D6E4}_{\unicode[STIX]{x1D73F},\boldsymbol{k}^{I},\unicode[STIX]{x1D73F}-\boldsymbol{k}_{I}}^{(SIS)}/\unicode[STIX]{x1D714}_{\boldsymbol{k}^{I}}^{(I)}$, along the entire resonance curve for wind speeds of
 $7$ and
 $10.7~\text{m}~\text{s}^{-1}$. We observe that for both wind speeds the low collinear wavenumbers experience the most resonance broadening, and that the resonance width decreases roughly exponentially as a function of wavenumber. Similarly, in figure 7 we also plot the ratio of resonance width and frequency as a function of the angle between the excited interfacial wavenumber and the fixed surface wavenumber, verifying that it is largest when the angle is small, though non-zero for other angles.
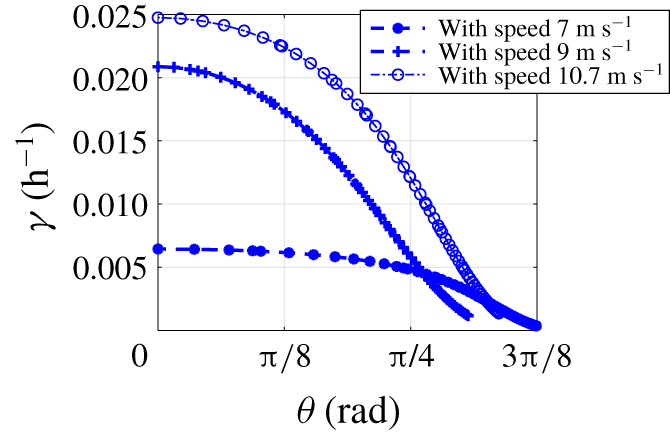
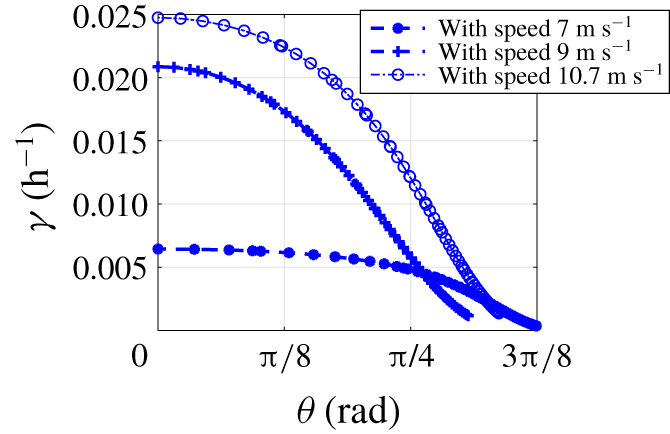
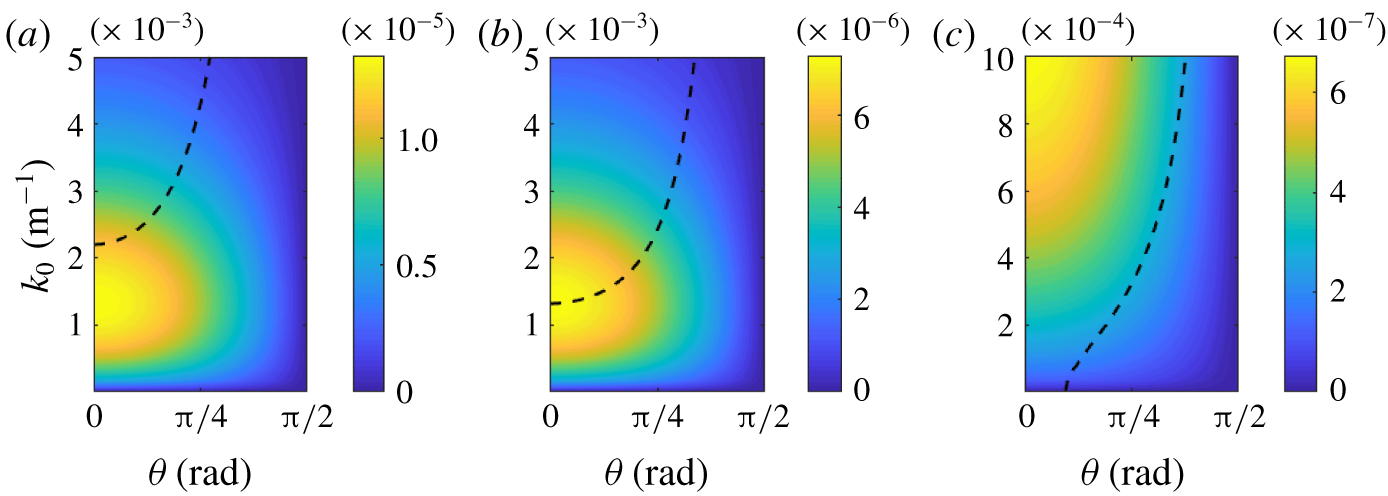
In figure 8 we plot the Boltzmann growth rate of interfacial wavenumbers along the two-dimensional resonance curve as a function of the angle between the interfacial wave and the fixed surface wave. We see that a band of angles is excited on a time scale similar to that of the peak collinear wave. Furthermore, as the wind speed increases, the band of excited angles becomes broader, so in addition to the collinear waves in the direction of the wind speed, oblique waves are generated as well, making the mechanism of transfer of energy from the wind to the internal waves much more effective.
The excitation rate,  $\unicode[STIX]{x1D6FE}_{\boldsymbol{k}}^{(I)}$, plotted as a function of
 $\unicode[STIX]{x1D703}$, the angle between interfacial wave
 $\boldsymbol{k}$ and surface wave
 $\unicode[STIX]{x1D73F}$.
5.2 Analysis of matrix element
The matrix element  $\unicode[STIX]{x1D611}^{(SSI)}(\unicode[STIX]{x1D73F},\unicode[STIX]{x1D73F}+\boldsymbol{k}_{I},\boldsymbol{k}_{I})$ with the resonant values of
 $k_{I}$ overlaid on top. Surface wavelength is (a)
 $\unicode[STIX]{x1D706}=8~\text{m}$, (b)
 $\unicode[STIX]{x1D706}=14.5~\text{m}$ and (c)
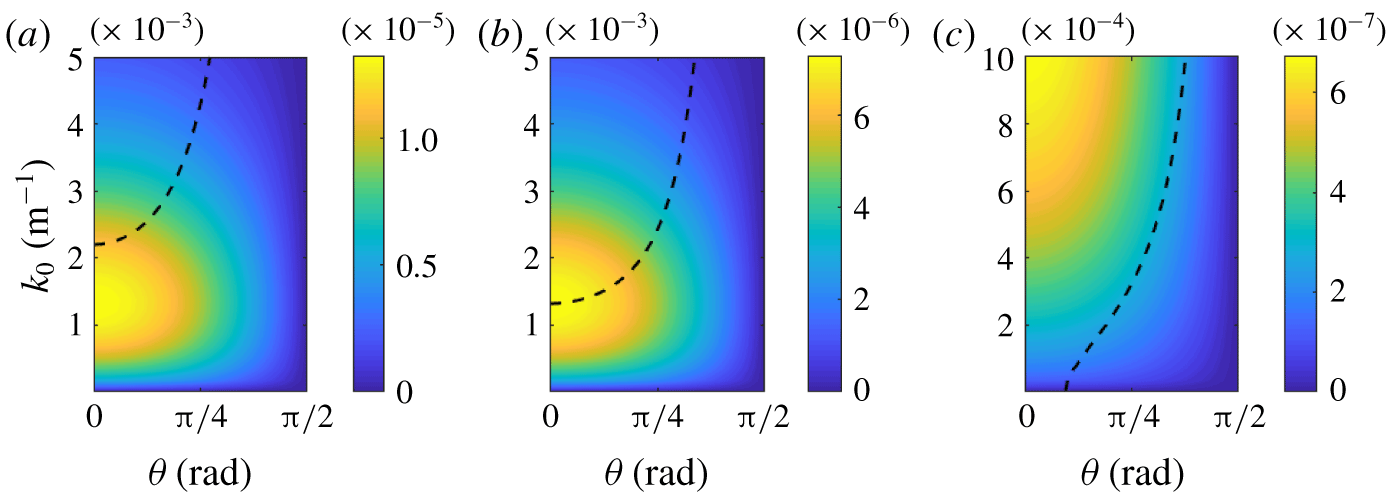
 $\unicode[STIX]{x1D706}=150~\text{m}$. We see a transition into a regime in which collinear resonances are no longer dominant, i.e. as the surface waves grow in wavelength the resonant curve crosses a peak spatial frequency in which energy transfer is most efficient.
The principal new feature of this paper is that we provide a first-principles derivation of the magnitude of the strength of interactions between surface and interfacial waves. The value of such an interaction is called the matrix element, or interaction cross-section in wave turbulence theory. In figure 9 we plot the interaction coefficient  $\unicode[STIX]{x1D611}^{(SIS)}$ which governs the interaction strength along resonances of the form depicted in figure 2 for the cases of surface wavelengths
 $\unicode[STIX]{x1D706}=8$, 14.5 and 150 m. Here we fix the second surface wavenumber so that the resonance condition on wavenumber (4.4) is satisfied, plotting
 $\unicode[STIX]{x1D611}^{(SIS)}(\unicode[STIX]{x1D73F}+\boldsymbol{k}_{I},\boldsymbol{k}_{I},\unicode[STIX]{x1D73F})$ as a function of the free wavenumber
 $\boldsymbol{k}_{I}$. The overlaid white curve shows the resonant values of
 $\boldsymbol{k}_{I}$ determined by the resonance condition on frequency. Combined, the contour plot shows the interaction strength, with the resonance curve showing where interactions are restricted to occur. Notably, the interaction coefficient is approximately scale-invariant, as the structure remains nearly the same for the case of surface waves with wavelength 9 m and surface swell waves with wavelength 150 m. In contrast, the shape of the resonance curve experiences changes dependent on the magnitude of the surface wavenumbers, meaning that varying regimes occur depending on where the resonance curve lies with respect to the interaction coefficient. For a surface wavelength of approximately
 $\unicode[STIX]{x1D706}=14.5$ m, the resonance curve aligns with the maximum value of the matrix element, as seen in figure 9(b). In this regime, interactions as a whole seem most efficient. Further beyond this range the collinear resonance becomes less dominant, and for long surface wavelengths, as in the case when
 $\unicode[STIX]{x1D706}=150$ m, the maximum growth rate is along non-collinear interfacial waves, as seen in figure 9(c).
5.3 Excitation of interfacial waves by the JONSWAP surface wave spectrum, kinetic approach
5.3.1 Collinear waves
The main motivation for this paper is to predict the transfer of energy from wind-generated surface waves to the depth of the ocean. Here we fix the spectrum of the surface waves to be the JONSWAP spectrum in the  $x$ direction and homogeneous in the
 $y$ direction for a wind speed of
 $15~\text{m}~\text{s}^{-1}$. We assume that initially there are no interfacial waves, i.e.
 $n^{(I)}(\boldsymbol{k},t=0)=0$. To calculate the growth rates, we iterate formula (4.3) until a self-consistent value is obtained. We perform iterations until an iterate is within
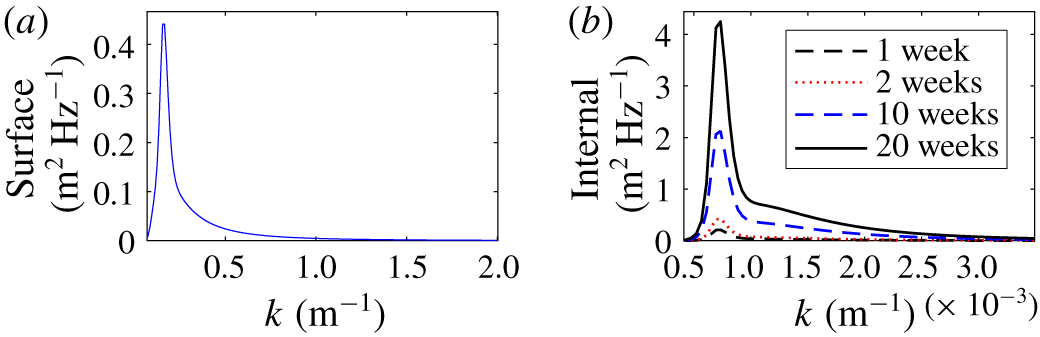
 $10^{-8}$ of the previous iterate. After obtaining self-consistent values for the growth rates of each wavenumber, we then evolve in time equations (4.2) and plot the resulting spectrum of the interfacial waves as a function of time in figure 10. Here the interfacial waves with wavelengths of less than 10 m are damped, the typical 10 m cutoff for internal wave breaking. We see that the surface wave spectrum excites interfacial waves on a time scale of days. Furthermore, the relative growth of the interfacial wave spectrum slows down over a period of 20 weeks, with no visual difference between week 19 and week 20 other than near the peak frequency.
(a) The fixed surface wave JONSWAP spectrum. (b) The interfacial wave spectrum over the course of 20 weeks, where  $n_{\boldsymbol{k}}^{(I)}(t=0)=0$ initially.

It appears that the spectral energy density of interfacial waves is a ‘resonant reflection’ of the spectra of the surface waves. Indeed, the spectrum in figure 10 is defined solely by class III resonances with the surface waves, and contributions from the interfacial wave interactions are sub-dominant. It therefore appears that the interactions between the interfacial waves are not an effective mechanism for the redistribution of energy in the interfacial waves, at least for the parameters chosen here. Spectral energy transfers in the field of internal waves have been studied extensively (Muller, Henyey & Pomphrey Reference Muller, Henyey and Pomphrey1986; Lvov & Tabak Reference Lvov and Tabak2001, Reference Lvov and Tabak2004; Lvov, Polzin & Tabak Reference Lvov, Polzin and Tabak2004; Lvov & Yokoyama Reference Lvov and Yokoyama2009; Lvov et al. Reference Lvov, Tabak, Polzin and Yokoyama2010; Polzin & Lvov Reference Polzin and Lvov2011, Reference Polzin and Lvov2017). It is now understood that spectral energy transfer in internal waves is dominated by the special class of non-local wave–wave interactions, called induced diffusion. This mechanism is absent in our model, since it is a two-layer system.
5.4 Simulation of growth rates for continuous two-dimensional surface spectrum
For the case when the surface spectrum is a more general two-dimensional spectrum, we resort to numerically iterating (4.3). Here we consider the two-dimensional version of (5.3), the JONSWAP spectrum. Introducing simple angular dependence via a directional spreading function as described in Janssen (Reference Janssen2004), we consider
 $$\begin{eqnarray}n^{(S)}(k,\unicode[STIX]{x1D703})=A\cos ^{2}\unicode[STIX]{x1D703}\times S(\unicode[STIX]{x1D714}_{\boldsymbol{ k}}^{(S)})\frac{\text{d}\unicode[STIX]{x1D714}_{\boldsymbol{k}}}{\text{d}\boldsymbol{k}},\quad -\frac{\unicode[STIX]{x03C0}}{2}\leqslant \unicode[STIX]{x1D703}\leqslant \frac{\unicode[STIX]{x03C0}}{2},\end{eqnarray}$$
where the spectrum is renormalized so that the total energy is the same as in the one-dimensional case, i.e.  $A=\iint \cos ^{2}\unicode[STIX]{x1D703}S(\unicode[STIX]{x1D714})\,\text{d}\unicode[STIX]{x1D714}\,\text{d}\unicode[STIX]{x1D703}/\!\int S(\unicode[STIX]{x1D714})\,\text{d}\unicode[STIX]{x1D714}$. We now substitute (5.8) into (4.3) and find the self-consistent solution for
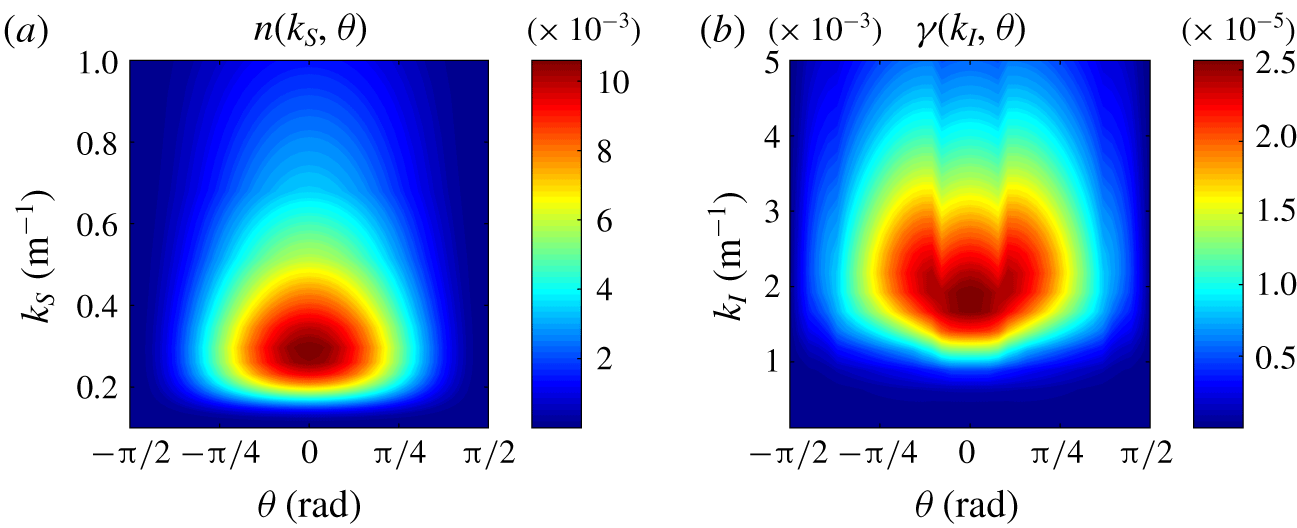
 $\unicode[STIX]{x1D6FE}^{(I)}(k,\unicode[STIX]{x1D714})$; the results are shown in figure 11.
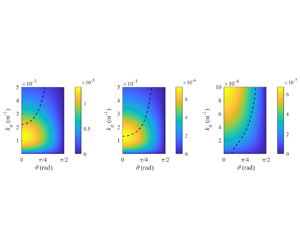
(a) Fixed surface spectrum and (b) simulated growth rate of interfacial wave spectrum for a wind speed of  $5~\text{m}~\text{s}^{-1}$.

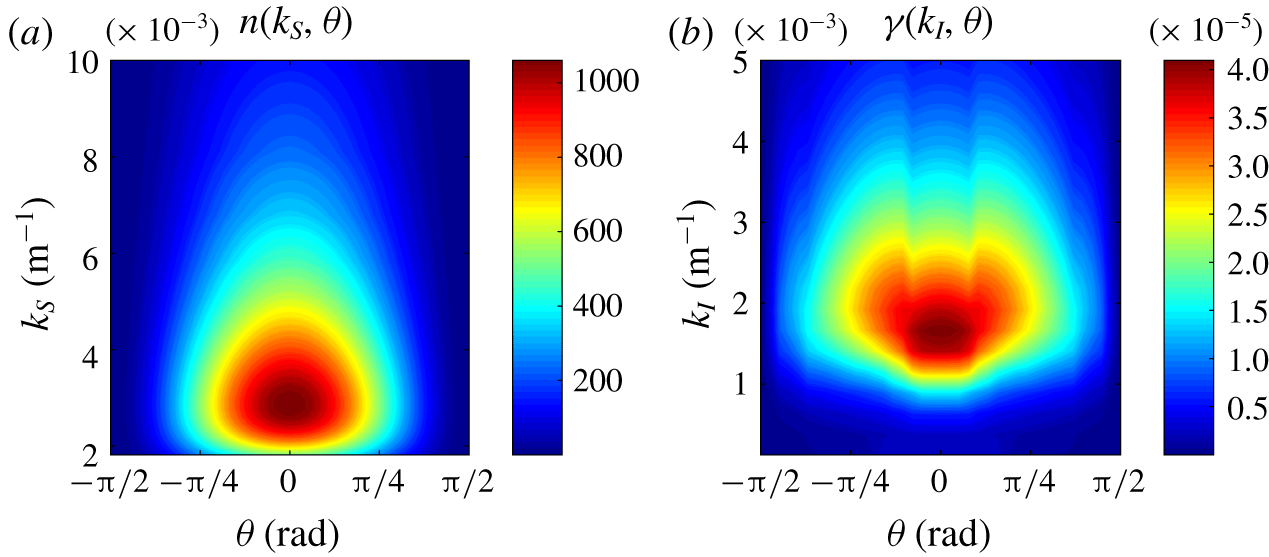
We obtain self-consistent values for the growth rate of interfacial waves excited for the case of a two-dimensional Pierson–Moskowitz spectrum corresponding to a wind speed of  $5~\text{m}~\text{s}^{-1}$ in figure 11 and
 $50~\text{m}~\text{s}^{-1}$ in figure 12. Note that while these two representations may look similar, the scales of the figures are different. Higher wind speed generates a much larger band width of excited wavenumbers, and the growth rates are higher. Notably, the structure of the growth rate of interfacial waves does not match the structure of the surface spectrum. There is a peak interfacial wave analogous to the peak of the surface spectrum, but there are three lobes corresponding to interactions where long surface waves are in resonance with oblique interfacial waves.
(a) Fixed surface spectrum and (b) simulated growth rate of interfacial wave spectrum for a hurricane wind speed of  $50~\text{m}~\text{s}^{-1}$.

Having calculated matrix element  $\unicode[STIX]{x1D611}_{123}^{(SIS)}$, and the growth rates of internal waves as a function of their wavenumber
 $k$ and direction
 $\unicode[STIX]{x1D703}$, we are now in a position to simulate the full evolving two-dimensional interfacial wave spectrum governed by (4.2). This is the subject of future work.
6 Discussion
In the present paper we revisit the problem of the coupling of surface gravity waves and interfacial waves in a two-layer system. We use the recently developed Hamiltonian structure of the system (Choi Reference Choi2019) and systematically develop wave turbulence theory that describes the time evolution of the spectral energy density of waves. To achieve this goal, we first need to diagonalize the quadratic part of the Hamiltonian. It appears to be a non-trivial task, which we perform using a series of two canonical transformations. We end up with a highly non-trivial overdetermined system of equations, which we solve, thus finding normal modes of the system. We therefore set up a stage for developing wave turbulence kinetic equations that describe nonlinear spectral energy transfers between surface and interfacial waves.
We then derive wave turbulence kinetic equations for the time evolution of the spectral energy densities of such a two-layer system. Our kinetic equation allows not only resonant, but also near-resonant interactions. We revisit the question of possible three-wave resonances, and confirm that for normal sea conditions the resonant picture developed in Ball (Reference Ball1964), Thorpe (Reference Thorpe1966) and Alam (Reference Alam2012) holds. Interestingly, the resonance condition still holds even for hurricane wind speeds and the case of long surface swell; for long surface wavelengths, the characteristic wavelength of the collinear interfacial waves becomes much longer. This leads to resonant non-collinear interactions being dominant, as evidenced by numerically studying the coupling coefficient.
The kinetic equation allows us to estimate the time scales of excitation of interfacial waves by a single plane surface wave. We find that under the assumption of the magnitude of the interfacial waves being small, the growth rate is of the order of hours. Notably, we consider resonant interfacial waves in all directions, seeing that the growth rate is maximized for class III collinear resonance and decreases with growing angle. By using surface frequencies and amplitudes estimated by the JONSWAP spectrum, we see a nonlinear threshold of roughly 9 m s-1 where energy transfer becomes more effective, perhaps corresponding to conditions where the surface waves transition into white capping.
We also consider the case when the spectrum of surface waves is given by the continuous set of frequencies described in the JONSWAP spectrum. We numerically solve the system of kinetic equations, and find that interfacial waves are generated at a characteristic time scale of days, and they eventually will reach a steady state at a characteristic time of months.
Our future work will be focused on investigating in more detail the interactions of interfacial and surface waves for the case of strong wind, without limiting ourselves to collinear vectors. We also will attempt to use observations of internal waves and surface waves for quantitative comparison with results given by the kinetic equation. Lastly, we will attempt to generalize our kinetic equation to three or more layers of the fluid.
Acknowledgements
The authors are grateful Dr K. L. Polzin, Professor W. Choi and Professor G. Kovacic for multiple useful discussions. J.Z. and Y.V.L. acknowledge support from NSF OCE grant 1635866. Y.V.L. acknowledges support from ONR grant N00014-17-1-2852.
Declaration of interests
The authors report no conflict of interest.
Appendix A. Non-local operator (Choi Reference Choi2019)
Here we list the components of the non-local operator and interaction matrix elements derived in Choi (Reference Choi2019). These operators are constructed by multiplying the Fourier transform of the quantity by the kernels given below, then calculating the inverse Fourier transform. The Fourier kernels of operators as a function of wavenumber  $k$, derived by Choi (Reference Choi2019), are
 $$\begin{eqnarray}\displaystyle & \displaystyle \unicode[STIX]{x1D611}_{k}=\frac{1}{\unicode[STIX]{x1D70C}_{u}\tanh (h_{u}k)\tanh (h_{l}k)+\unicode[STIX]{x1D70C}_{l}}, & \displaystyle \nonumber\\ \displaystyle & \displaystyle \unicode[STIX]{x1D6FE}_{11,k}=k\unicode[STIX]{x1D611}_{k}[(\unicode[STIX]{x1D70C}_{l}/\unicode[STIX]{x1D70C}_{u})\tanh (h_{u}k)+\tanh (h_{l}k)],\quad \unicode[STIX]{x1D6FE}_{12,k}=\unicode[STIX]{x1D6FE}_{21,k}=k\unicode[STIX]{x1D611}_{k}\operatorname{sech}(h_{u}k)\tanh (h_{l}k), & \displaystyle \nonumber\\ \displaystyle & \displaystyle \unicode[STIX]{x1D6FE}_{22,k}=k\unicode[STIX]{x1D611}_{k}\tanh (h_{l}k),\quad \unicode[STIX]{x1D6FE}_{30,k}=\unicode[STIX]{x1D611}_{k},\quad \unicode[STIX]{x1D6FE}_{31,k}=\operatorname{sech}(h_{u}k)\unicode[STIX]{x1D611}_{k}, & \displaystyle \nonumber\\ \displaystyle & \displaystyle \unicode[STIX]{x1D6FE}_{32,k}=\unicode[STIX]{x1D611}_{k}\tanh (h_{u}k)\tanh (h_{l}k),\quad \unicode[STIX]{x1D6FE}_{33,k}=\unicode[STIX]{x1D611}_{k}(1+\tanh (h_{u}k)\tanh (h_{l}k)). & \displaystyle \nonumber\end{eqnarray}$$
Appendix B. Matrix elements in Fourier space (Choi Reference Choi2019)
The coupling coefficients of the quadratic and cubic Hamiltonians from Choi (Reference Choi2019) are given by
 $$\begin{eqnarray}\displaystyle & \displaystyle h^{(1a)}(\boldsymbol{k})=\unicode[STIX]{x1D70C}_{u}g, & \displaystyle \nonumber\\ \displaystyle & \displaystyle h^{(2a)}(\boldsymbol{k})=\frac{(\unicode[STIX]{x1D70C}_{l}/\unicode[STIX]{x1D70C}_{u})k\tanh (h_{u}k)+k\tanh (h_{l}k)}{\unicode[STIX]{x1D70C}_{u}\tanh (h_{u}k)\tanh (h_{l}k)+\unicode[STIX]{x1D70C}_{l}}, & \displaystyle \nonumber\\ \displaystyle & \displaystyle h^{(3a)}(\boldsymbol{k})=\unicode[STIX]{x0394}\unicode[STIX]{x1D70C}g, & \displaystyle \nonumber\\ \displaystyle & \displaystyle h^{(4a)}(\boldsymbol{k})=\frac{k\tanh (h_{l}k)}{\unicode[STIX]{x1D70C}_{u}\tanh (h_{u}k)\tanh (h_{l}k)+\unicode[STIX]{x1D70C}_{l}}, & \displaystyle \nonumber\\ \displaystyle & \displaystyle h^{(5a)}(\boldsymbol{k}_{1},\boldsymbol{k}_{2})=\frac{k_{1}\tanh (h_{l}k_{1})\operatorname{sech}(h_{u}k_{1})}{\unicode[STIX]{x1D70C}_{u}\tanh (h_{u}k_{1})\tanh (h_{l}k_{1})+\unicode[STIX]{x1D70C}_{l}}+\frac{k_{2}\tanh (h_{l}k_{2})\operatorname{sech}(h_{u}k_{2})}{\unicode[STIX]{x1D70C}_{u}\tanh (h_{u}k_{2})\tanh (h_{l}k_{2})+\unicode[STIX]{x1D70C}_{l}}, & \displaystyle \nonumber\\ \displaystyle & \displaystyle h_{123}^{(1)}=-\frac{1}{2}(\boldsymbol{k}_{1}\boldsymbol{\cdot }\boldsymbol{k}_{2})/\unicode[STIX]{x1D70C}_{u} & \displaystyle \nonumber\\ \displaystyle & \displaystyle \quad -\frac{1}{2}k_{1}k_{2}\frac{(\unicode[STIX]{x1D70C}_{l}\tanh (h_{u}k_{1})+\unicode[STIX]{x1D70C}_{u}\tanh (h_{l}k_{1}))(\unicode[STIX]{x1D70C}_{l}\tanh (h_{u}k_{2})+\unicode[STIX]{x1D70C}_{u}\tanh (h_{l}k_{2}))}{\unicode[STIX]{x1D70C}_{u}(\unicode[STIX]{x1D70C}_{u}\tanh (h_{u}k_{1})\tanh (h_{l}k_{1})+\unicode[STIX]{x1D70C}_{l})(\unicode[STIX]{x1D70C}_{u}\tanh (h_{u}k_{2})\tanh (h_{l}k_{2})+\unicode[STIX]{x1D70C}_{l})}, & \displaystyle \nonumber\\ \displaystyle & \displaystyle h_{123}^{(2)}=-k_{1}k_{2}\frac{\operatorname{sech}(h_{u}k_{2})\tanh (h_{l}k_{2})(\unicode[STIX]{x1D70C}_{l}\tanh (h_{u}k_{1})+\unicode[STIX]{x1D70C}_{u}\tanh (h_{l}k_{1}))}{(\unicode[STIX]{x1D70C}_{u}\tanh (h_{u}k_{1})\tanh (h_{l}k_{1})+\unicode[STIX]{x1D70C}_{l})(\unicode[STIX]{x1D70C}_{u}\tanh (h_{u}k_{2})\tanh (h_{l}k_{2})+\unicode[STIX]{x1D70C}_{l})}, & \displaystyle \nonumber\\ \displaystyle & \displaystyle h_{123}^{(3)}=-\frac{1}{2}\unicode[STIX]{x1D70C}_{u}k_{1}k_{2}\frac{\operatorname{sech}(h_{u}k_{1})\operatorname{sech}(h_{u}k_{2})\tanh (h_{l}k_{1})\tanh (h_{l}k_{2})}{(\unicode[STIX]{x1D70C}_{u}\tanh (h_{u}k_{1})\tanh (h_{l}k_{1})+\unicode[STIX]{x1D70C}_{l})(\unicode[STIX]{x1D70C}_{u}\tanh (h_{u}k_{2})\tanh (h_{l}k_{2})+\unicode[STIX]{x1D70C}_{l})},\quad & \displaystyle \nonumber\\ \displaystyle & \displaystyle h_{123}^{(4)}=-\frac{1}{2}\unicode[STIX]{x0394}\unicode[STIX]{x1D70C}\frac{\operatorname{sech}(h_{u}k_{1})\operatorname{sech}(h_{u}k_{2})}{(\unicode[STIX]{x1D70C}_{u}\tanh (h_{u}k_{1})\tanh (h_{l}k_{1})+\unicode[STIX]{x1D70C}_{l})(\unicode[STIX]{x1D70C}_{u}\tanh (h_{u}k_{2})\tanh (h_{l}k_{2})+\unicode[STIX]{x1D70C}_{l})} & \displaystyle \nonumber\\ \displaystyle & \displaystyle \quad \times \,[-(\unicode[STIX]{x1D70C}_{l}/\unicode[STIX]{x1D70C}_{u})(\boldsymbol{k}_{1}\boldsymbol{\cdot }\boldsymbol{k}_{2})+k_{1}k_{2}\tanh (h_{l}k_{1})\tanh (h_{l}k_{2})], & \displaystyle \nonumber\\ \displaystyle & \displaystyle h_{123}^{(5)}=-\frac{\operatorname{sech}(h_{u}k_{1})}{(\unicode[STIX]{x1D70C}_{u}\tanh (h_{u}k_{1})\tanh (h_{l}k_{1})+\unicode[STIX]{x1D70C}_{l})(\unicode[STIX]{x1D70C}_{u}\tanh (h_{u}k_{2})\tanh (h_{l}k_{2})+\unicode[STIX]{x1D70C}_{l})} & \displaystyle \nonumber\\ \displaystyle & \displaystyle \quad \times \,[\unicode[STIX]{x0394}\unicode[STIX]{x1D70C}\hspace{2.22198pt}k_{1}k_{2}\tanh (h_{l}k_{1})\tanh (h_{l}k_{2})+\unicode[STIX]{x1D70C}_{l}(1+\tanh (h_{u}k_{2})\tanh (h_{l}k_{2}))(\boldsymbol{k}_{1}\boldsymbol{\cdot }\boldsymbol{k}_{2})],\quad & \displaystyle \nonumber\\ \displaystyle & \displaystyle h_{123}^{(6)}=-\frac{1}{2(\unicode[STIX]{x1D70C}_{u}\tanh (h_{u}k_{1})\tanh (h_{l}k_{1})+\unicode[STIX]{x1D70C}_{l})(\unicode[STIX]{x1D70C}_{u}\tanh (h_{u}k_{2})\tanh (h_{l}k_{2})+\unicode[STIX]{x1D70C}_{l})} & \displaystyle \nonumber\\ \displaystyle & \displaystyle \quad \times [\!\unicode[STIX]{x0394}\unicode[STIX]{x1D70C}\hspace{2.22198pt}k_{1}k_{2}\tanh (h_{l}k_{1})\tanh (h_{l}k_{2}) & \displaystyle \nonumber\\ \displaystyle & \displaystyle \quad +\,(\unicode[STIX]{x1D70C}_{l}-\unicode[STIX]{x1D70C}_{u}\tanh (h_{u}k_{1})\tanh (h_{u}k_{2})\tanh (h_{l}k_{1})\tanh (h_{l}k_{2}))(\boldsymbol{k}_{1}\boldsymbol{\cdot }\boldsymbol{k}_{2})\!]. & \displaystyle \nonumber\end{eqnarray}$$
Appendix C. Canonical transformation
C.1 Linear transformation
The linearized equations of motion for
 $$\begin{eqnarray}\displaystyle \left(\begin{array}{@{}c@{}}\boldsymbol{u}\\ \boldsymbol{ v}\end{array}\right)=\left(\begin{array}{@{}c@{}}\unicode[STIX]{x1D701}^{(1)}\\ \unicode[STIX]{x1D701}^{(2)}\\ \unicode[STIX]{x1D6F9}^{(1)}\\ \unicode[STIX]{x1D6F9}^{(2)}\end{array}\right) & & \displaystyle \nonumber\end{eqnarray}$$
can be written in the form
 $$\begin{eqnarray}\displaystyle \left(\begin{array}{@{}c@{}}\dot{\boldsymbol{u}}\\ \dot{\boldsymbol{v}}\end{array}\right)=\left(\begin{array}{@{}cc@{}}O_{2\times 2} & G_{2\times 2}\\ M_{2\times 2} & O_{2\times 2}\end{array}\right)\left(\begin{array}{@{}c@{}}\boldsymbol{u}\\ \boldsymbol{ v}\end{array}\right). & & \displaystyle \nonumber\end{eqnarray}$$
We seek a canonical transformation to normal modes of the system. The condition of the linear transformation to be canonical is that it is representable as
 $$\begin{eqnarray}\displaystyle \left(\begin{array}{@{}c@{}}\dot{\boldsymbol{u}}\\ \dot{\boldsymbol{v}}\end{array}\right)=\left(\begin{array}{@{}cc@{}}O_{2\times 2} & I_{2\times 2}\\ -I_{2\times 2} & O_{2\times 2}\end{array}\right)\left(\begin{array}{@{}c@{}}\boldsymbol{u}\\ \boldsymbol{ v}\end{array}\right), & & \displaystyle \nonumber\end{eqnarray}$$
with  $G$ and
 $M$ such that each are diagonalizable via unitary similarity transformations. However, for the system under consideration this is not possible, and we substitute a more general linear transformation in the complex action variables of the form (Zakharov et al. Reference Zakharov, L’vov and Falkovich1992)
 $$\begin{eqnarray}\displaystyle & \displaystyle a_{k}^{(U)}=\unicode[STIX]{x1D618}_{\boldsymbol{k}}^{(1)}c_{\boldsymbol{k}}^{(I)}+\unicode[STIX]{x1D618}_{\boldsymbol{k}}^{(2)}c_{-\boldsymbol{k}}^{(I)\ast }+\unicode[STIX]{x1D618}_{\boldsymbol{k}}^{(3)}c_{\boldsymbol{k}}^{(S)}+\unicode[STIX]{x1D618}_{k}^{(4)}c_{-\boldsymbol{k}}^{(S)\ast }, & \displaystyle\end{eqnarray}$$
 $$\begin{eqnarray}\displaystyle & \displaystyle a_{k}^{(L)}=\unicode[STIX]{x1D618}_{\boldsymbol{k}}^{(5)}c_{\boldsymbol{k}}^{(I)}+\unicode[STIX]{x1D618}_{\boldsymbol{k}}^{(6)}c_{-\boldsymbol{k}}^{(I)\ast }+\unicode[STIX]{x1D618}_{\boldsymbol{k}}^{(7)}c_{\boldsymbol{k}}^{(S)}+\unicode[STIX]{x1D618}_{k}^{(8)}c_{-\boldsymbol{k}}^{(S)\ast }. & \displaystyle\end{eqnarray}$$
 $$\begin{eqnarray}\displaystyle & \displaystyle \left.\begin{array}{@{}c@{}}\displaystyle |\unicode[STIX]{x1D618}_{\boldsymbol{k}}^{(1)}|^{2}-|\unicode[STIX]{x1D618}_{\boldsymbol{k}}^{(2)}|^{2}+|\unicode[STIX]{x1D618}_{\boldsymbol{k}}^{(3)}|^{2}-|\unicode[STIX]{x1D618}_{\boldsymbol{k}}^{(4)}|^{2}=1,\\ \displaystyle |\unicode[STIX]{x1D618}_{\boldsymbol{k}}^{(5)}|^{2}-|\unicode[STIX]{x1D618}_{\boldsymbol{k}}^{(6)}|^{2}+|\unicode[STIX]{x1D618}_{\boldsymbol{k}}^{(7)}|^{2}-|\unicode[STIX]{x1D618}_{\boldsymbol{k}}^{(8)}|^{2}=1,\end{array}\right\} & \displaystyle\end{eqnarray}$$
 $$\begin{eqnarray}\displaystyle & \displaystyle \left.\begin{array}{@{}c@{}}\displaystyle \unicode[STIX]{x1D618}_{\boldsymbol{k}}^{(1)}\unicode[STIX]{x1D618}_{\boldsymbol{k}}^{(5)\ast }+\unicode[STIX]{x1D618}_{\boldsymbol{k}}^{(3)}\unicode[STIX]{x1D618}_{\boldsymbol{k}}^{(7)\ast }=\unicode[STIX]{x1D618}_{\boldsymbol{k}}^{(2)}\unicode[STIX]{x1D618}_{\boldsymbol{k}}^{(6)\ast }+\unicode[STIX]{x1D618}_{\boldsymbol{k}}^{(4)}\unicode[STIX]{x1D618}_{\boldsymbol{k}}^{(8)\ast },\\ \displaystyle \unicode[STIX]{x1D618}_{\boldsymbol{k}}^{(1)}\unicode[STIX]{x1D618}_{-\boldsymbol{k}}^{(6)}+\unicode[STIX]{x1D618}_{\boldsymbol{k}}^{(3)}\unicode[STIX]{x1D618}_{-\boldsymbol{k}}^{(8)}=\unicode[STIX]{x1D618}_{k}^{(2)}\unicode[STIX]{x1D618}_{-\boldsymbol{k}}^{(5)}+\unicode[STIX]{x1D618}_{k}^{(4)}\unicode[STIX]{x1D618}_{-\boldsymbol{k}}^{(7)},\end{array}\right\} & \displaystyle\end{eqnarray}$$
 $$\begin{eqnarray}\displaystyle & \displaystyle \left.\begin{array}{@{}c@{}}\displaystyle \unicode[STIX]{x1D618}_{\boldsymbol{k}}^{(1)}\unicode[STIX]{x1D618}_{-\boldsymbol{k}}^{(2)}+\unicode[STIX]{x1D618}_{\boldsymbol{k}}^{(3)}\unicode[STIX]{x1D618}_{-\boldsymbol{k}}^{(4)}=\unicode[STIX]{x1D618}_{-\boldsymbol{k}}^{(1)}\unicode[STIX]{x1D618}_{\boldsymbol{k}}^{(2)}+\unicode[STIX]{x1D618}_{-\boldsymbol{k}}^{(3)}\unicode[STIX]{x1D618}_{\boldsymbol{k}}^{(4)},\\ \displaystyle \unicode[STIX]{x1D618}_{\boldsymbol{k}}^{(5)}\unicode[STIX]{x1D618}_{-\boldsymbol{k}}^{(6)}+\unicode[STIX]{x1D618}_{\boldsymbol{k}}^{(7)}\unicode[STIX]{x1D618}_{-\boldsymbol{k}}^{(8)}=\unicode[STIX]{x1D618}_{-\boldsymbol{k}}^{(5)}\unicode[STIX]{x1D618}_{\boldsymbol{k}}^{(6)}+\unicode[STIX]{x1D618}_{-\boldsymbol{k}}^{(7)}\unicode[STIX]{x1D618}_{\boldsymbol{k}}^{(8)}.\end{array}\right\} & \displaystyle\end{eqnarray}$$
 $c_{\boldsymbol{k}}^{\ast }C_{\boldsymbol{k}}$,
 $c_{\boldsymbol{k}}C_{-\boldsymbol{k}}$,
 $c_{\boldsymbol{k}}c_{-\boldsymbol{k}}$ and
 $C_{\boldsymbol{k}}C_{-\boldsymbol{k}}$ and their complex conjugates vanish, which leads to the additional conditions
 $$\begin{eqnarray}\displaystyle & \displaystyle \unicode[STIX]{x1D714}_{\boldsymbol{k}}^{(1)}(\unicode[STIX]{x1D618}_{\boldsymbol{k}}^{(1)}\unicode[STIX]{x1D618}_{\boldsymbol{k}}^{(3)\ast }+\unicode[STIX]{x1D618}_{-\boldsymbol{k}}^{(2)\ast }\unicode[STIX]{x1D618}_{-\boldsymbol{k}}^{(4)})+\unicode[STIX]{x1D714}^{(2)}(\unicode[STIX]{x1D618}_{\boldsymbol{k}}^{(5)}\unicode[STIX]{x1D618}_{\boldsymbol{k}}^{(7)\ast }+\unicode[STIX]{x1D618}_{-\boldsymbol{k}}^{(6)\ast }\unicode[STIX]{x1D618}_{-\boldsymbol{k}}^{(8)}) & \displaystyle \nonumber\\ \displaystyle & \displaystyle \quad +\,F_{\boldsymbol{k}}[(\unicode[STIX]{x1D618}_{\boldsymbol{k}}^{(1)}-\unicode[STIX]{x1D618}_{-\boldsymbol{k}}^{(2)\ast })(\unicode[STIX]{x1D618}_{-\boldsymbol{k}}^{(8)}-\unicode[STIX]{x1D618}_{\boldsymbol{k}}^{(7)\ast })+(\unicode[STIX]{x1D618}_{\boldsymbol{k}}^{(3)\ast }-\unicode[STIX]{x1D618}_{-\boldsymbol{k}}^{(4)})(\unicode[STIX]{x1D618}_{-\boldsymbol{k}}^{(6)\ast }-\unicode[STIX]{x1D618}_{\boldsymbol{k}}^{(5)})]=0, & \displaystyle\end{eqnarray}$$
 $$\begin{eqnarray}\displaystyle & \displaystyle \unicode[STIX]{x1D714}_{\boldsymbol{k}}^{(1)}(\unicode[STIX]{x1D618}_{\boldsymbol{k}}^{(1)}\unicode[STIX]{x1D618}_{\boldsymbol{k}}^{(4)\ast }+\unicode[STIX]{x1D618}_{-\boldsymbol{k}}^{(2)\ast }\unicode[STIX]{x1D618}_{-\boldsymbol{k}}^{(3)})+\unicode[STIX]{x1D714}_{\boldsymbol{k}}^{(2)}(\unicode[STIX]{x1D618}_{\boldsymbol{k}}^{(5)}\unicode[STIX]{x1D618}_{\boldsymbol{k}}^{(8)\ast }+\unicode[STIX]{x1D618}_{-\boldsymbol{k}}^{(6)\ast }\unicode[STIX]{x1D618}_{-\boldsymbol{k}}^{(7)}) & \displaystyle \nonumber\\ \displaystyle & \displaystyle \quad +\,F_{\boldsymbol{k}}[(\unicode[STIX]{x1D618}_{\boldsymbol{k}}^{(5)}-\unicode[STIX]{x1D618}_{-\boldsymbol{k}}^{(6)\ast })(\unicode[STIX]{x1D618}_{-\boldsymbol{k}}^{(3)}-\unicode[STIX]{x1D618}_{\boldsymbol{k}}^{(4)\ast })+(\unicode[STIX]{x1D618}_{-\boldsymbol{k}}^{(7)}-\unicode[STIX]{x1D618}_{\boldsymbol{k}}^{(8)\ast })(\unicode[STIX]{x1D618}_{\boldsymbol{k}}^{(1)}-\unicode[STIX]{x1D618}_{-\boldsymbol{k}}^{(2)\ast })]=0, & \displaystyle\end{eqnarray}$$
 $$\begin{eqnarray}\displaystyle & \displaystyle \unicode[STIX]{x1D714}_{\boldsymbol{k}}^{(1)}\unicode[STIX]{x1D618}_{\boldsymbol{k}}^{(1)}\unicode[STIX]{x1D618}_{\boldsymbol{k}}^{(2)\ast }+\unicode[STIX]{x1D714}_{\boldsymbol{k}}^{(2)}\unicode[STIX]{x1D618}_{\boldsymbol{k}}^{(5)}\unicode[STIX]{x1D618}_{\boldsymbol{k}}^{(6)\ast }+F_{\boldsymbol{k}}[\unicode[STIX]{x1D618}_{\boldsymbol{k}}^{(1)}(\unicode[STIX]{x1D618}_{-\boldsymbol{k}}^{(5)}-\unicode[STIX]{x1D618}_{\boldsymbol{k}}^{(6)\ast })+\unicode[STIX]{x1D618}_{\boldsymbol{k}}^{(2)\ast }(\unicode[STIX]{x1D618}_{-\boldsymbol{k}}^{(6)\ast }-\unicode[STIX]{x1D618}_{\boldsymbol{k}}^{(5)})]=0,\qquad & \displaystyle\end{eqnarray}$$
 $$\begin{eqnarray}\displaystyle & \displaystyle \unicode[STIX]{x1D714}_{\boldsymbol{k}}^{(1)}\unicode[STIX]{x1D618}_{\boldsymbol{k}}^{(3)}\unicode[STIX]{x1D618}_{\boldsymbol{k}}^{(4)\ast }+\unicode[STIX]{x1D714}_{\boldsymbol{k}}^{(2)}\unicode[STIX]{x1D618}_{\boldsymbol{k}}^{(7)}\unicode[STIX]{x1D618}_{\boldsymbol{k}}^{(8)\ast }+F_{\boldsymbol{k}}[\unicode[STIX]{x1D618}_{\boldsymbol{k}}^{(3)}(\unicode[STIX]{x1D618}_{-\boldsymbol{k}}^{(7)}-\unicode[STIX]{x1D618}_{\boldsymbol{k}}^{(8)\ast })+\unicode[STIX]{x1D618}_{\boldsymbol{k}}^{(4)\ast }(\unicode[STIX]{x1D618}_{-\boldsymbol{k}}^{(8)\ast }-\unicode[STIX]{x1D618}_{\boldsymbol{k}}^{(7)})]=0.\qquad & \displaystyle\end{eqnarray}$$
We note that these conditions give a transformation of a form analogous to that of the Bogoliubov–Valatin transformation widely used to diagonalize Hamiltonians in quantum mechanics (Bogoljubov Reference Bogoljubov1958; Valatin Reference Valatin1958).
We solve for the coefficients of the transformation – the full system (C 2a)–(C 3d) – to obtain the Hamiltonian of the system in diagonal form. This system contains eight complex and two real nonlinear coupled equations for eight complex unknowns, which makes this task non-trivial. It might seem that the the system is overdetermined; yet it turns out this is not the case. Namely, under the additional assumption that
 $$\begin{eqnarray}\unicode[STIX]{x1D618}_{\boldsymbol{k}}^{(i)},\quad i=1,2\ldots ,8\text{ are real even functions of }\boldsymbol{k},\end{eqnarray}$$
equations (C 2c) are trivially satisfied. We then are left with six complex equations and two real equations for eight complex unknowns. We obtain a particular solution to (C 2a)–(C 3d):
 $$\begin{eqnarray}\displaystyle \left.\begin{array}{@{}c@{}}\displaystyle a_{\boldsymbol{k}}^{(U)}=\sin \unicode[STIX]{x1D703}[(\cosh \unicode[STIX]{x1D719})c_{\boldsymbol{k}}^{(I)}+(\sinh \unicode[STIX]{x1D719})c_{-\boldsymbol{k}}^{(I)\ast }]+\cos \unicode[STIX]{x1D703}[(\cosh \unicode[STIX]{x1D713})c_{\boldsymbol{k}}^{(S)}+(\sinh \unicode[STIX]{x1D713})c_{-\boldsymbol{k}}^{(S)\ast }],\\[4.0pt] \displaystyle a_{\boldsymbol{k}}^{(L)}=\cos \unicode[STIX]{x1D703}[(\unicode[STIX]{x1D6FC}\cosh \unicode[STIX]{x1D719}+\unicode[STIX]{x1D6FD}\sinh \unicode[STIX]{x1D719})c_{\boldsymbol{k}}^{(I)}+(\unicode[STIX]{x1D6FC}\sinh \unicode[STIX]{x1D719}+\unicode[STIX]{x1D6FD}\cosh \unicode[STIX]{x1D719})c_{-\boldsymbol{k}}^{(I)\ast }]\\[4.0pt] \displaystyle \hphantom{a_{\boldsymbol{k}}^{(L)}=}-\sin \unicode[STIX]{x1D703}[(\unicode[STIX]{x1D6FC}\cosh \unicode[STIX]{x1D713}+\unicode[STIX]{x1D6FD}\sinh \unicode[STIX]{x1D713})c_{\boldsymbol{k}}^{(S)}+(\unicode[STIX]{x1D6FC}\sinh \unicode[STIX]{x1D713}+\unicode[STIX]{x1D6FD}\cosh \unicode[STIX]{x1D713})c_{-\boldsymbol{k}}^{(S)\ast }].\end{array}\right\}\quad & & \displaystyle\end{eqnarray}$$
Here  $\unicode[STIX]{x1D6FC},\unicode[STIX]{x1D6FD},\unicode[STIX]{x1D703},\unicode[STIX]{x1D719}$ and
 $\unicode[STIX]{x1D713}$ are given by (C 7)–(C 14). Additional detailed analyses show that the general solution has an additional six complex random phases, which are taken here to be zero. Non-zero phases alter the phases of
 $c_{\boldsymbol{k}}^{(S)}$ and
 $c_{\boldsymbol{k}}^{(I)}$, but do not change the corresponding linear dispersion relationships or the strength of coupling of the normal modes.
We emphasize that the transformation is expressed in closed form in terms of  $\unicode[STIX]{x1D714}_{\boldsymbol{k}}^{(1)},\unicode[STIX]{x1D714}_{\boldsymbol{k}}^{(2)}$ and
 $F_{\boldsymbol{k}}$, and that this approach works for a general system with two types of interacting waves and quadratic coupling term.
C.2 Transformation coefficients
Define the following functions:
 $$\begin{eqnarray}\displaystyle C_{\boldsymbol{k}}^{(1)}=-\frac{F_{\boldsymbol{k}}^{(1)}+F_{\boldsymbol{ k}}^{(2)}}{2\sqrt{F_{\boldsymbol{k}}^{(1)}F_{\boldsymbol{k}}^{(2)}}},\quad C_{\boldsymbol{k}}^{(2)}=-\frac{F_{\boldsymbol{k}}^{(1)}-F_{\boldsymbol{ k}}^{(2)}}{2\sqrt{F_{\boldsymbol{k}}^{(1)}F_{\boldsymbol{k}}^{(2)}}},\quad \unicode[STIX]{x1D703}_{\boldsymbol{k}}=\frac{1}{2}\arctan \left[\frac{-4F_{\boldsymbol{k}}^{(3)}\sqrt{F_{\boldsymbol{ k}}^{(1)}F_{\boldsymbol{k}}^{(2)}}}{{F_{\boldsymbol{k}}^{(1)}}^{2}-{F_{\boldsymbol{k}}^{(2)}}^{2}}\right], & & \displaystyle \nonumber\\ \displaystyle & & \displaystyle \nonumber\end{eqnarray}$$
 $$\begin{eqnarray}\displaystyle & \displaystyle \unicode[STIX]{x1D707}_{\boldsymbol{k}}=F_{\boldsymbol{k}}^{(2)}C_{\boldsymbol{k}}^{(1)}C_{\boldsymbol{k}}^{(2)}\cos ^{2}\unicode[STIX]{x1D703}_{\boldsymbol{k}}+F_{\boldsymbol{k}}^{(3)}(C_{\boldsymbol{k}}^{(1)}-C_{\boldsymbol{k}}^{(2)})\sin \unicode[STIX]{x1D703}_{\boldsymbol{k}}\cos \unicode[STIX]{x1D703}_{\boldsymbol{k}}, & \displaystyle \nonumber\\ \displaystyle & \displaystyle \unicode[STIX]{x1D70E}_{\boldsymbol{k}}=F_{\boldsymbol{k}}^{(2)}C_{\boldsymbol{k}}^{(1)}C_{\boldsymbol{k}}^{(2)}\sin ^{2}\unicode[STIX]{x1D703}_{\boldsymbol{k}}-F_{\boldsymbol{k}}^{(3)}(C_{\boldsymbol{k}}^{(1)}-C_{\boldsymbol{k}}^{(2)})\sin \unicode[STIX]{x1D703}_{\boldsymbol{k}}\cos \unicode[STIX]{x1D703}_{\boldsymbol{k}}. & \displaystyle \nonumber\end{eqnarray}$$
Then we obtain
 $$\begin{eqnarray}\displaystyle & \displaystyle \unicode[STIX]{x1D6FC}_{\boldsymbol{k}}=F_{\boldsymbol{k}}^{(1)}\sin ^{2}\unicode[STIX]{x1D703}_{\boldsymbol{k}}+F_{\boldsymbol{k}}^{(2)}({C_{\boldsymbol{k}}^{(1)}}^{2}+{C_{\boldsymbol{k}}^{(2)}}^{2})\cos ^{2}\unicode[STIX]{x1D703}_{\boldsymbol{k}}-2F_{\boldsymbol{k}}^{(3)}(C_{\boldsymbol{k}}^{(1)}-C_{\boldsymbol{k}}^{(2)})\sin \unicode[STIX]{x1D703}_{\boldsymbol{k}}\cos \unicode[STIX]{x1D703}_{\boldsymbol{k}},\quad & \displaystyle\end{eqnarray}$$
 $$\begin{eqnarray}\displaystyle & \displaystyle \unicode[STIX]{x1D6FD}_{\boldsymbol{k}}=F_{\boldsymbol{k}}^{(1)}\cos ^{2}\unicode[STIX]{x1D703}+F_{\boldsymbol{k}}^{(2)}({C_{\boldsymbol{k}}^{(1)}}^{2}+{C_{\boldsymbol{k}}^{(2)}}^{2})\sin ^{2}\unicode[STIX]{x1D703}_{\boldsymbol{k}}+2F_{\boldsymbol{k}}^{(3)}(C_{\boldsymbol{k}}^{(1)}-C_{\boldsymbol{k}}^{(2)})\sin \unicode[STIX]{x1D703}_{\boldsymbol{k}}\cos \unicode[STIX]{x1D703}_{\boldsymbol{k}},\quad & \displaystyle\end{eqnarray}$$
 $$\begin{eqnarray}\displaystyle \unicode[STIX]{x1D719}_{\boldsymbol{k}}=\frac{1}{2}\tanh ^{-1}\left(-\frac{2\unicode[STIX]{x1D707}_{\boldsymbol{k}}}{\unicode[STIX]{x1D6FC}_{\boldsymbol{k}}}\right),\quad \unicode[STIX]{x1D713}_{\boldsymbol{k}}=\frac{1}{2}\tanh ^{-1}\left(-\frac{2\unicode[STIX]{x1D70E}_{\boldsymbol{k}}}{\unicode[STIX]{x1D6FD}_{\boldsymbol{k}}}\right). & & \displaystyle\end{eqnarray}$$
Thus for the Hamiltonian to be diagonalizable we have the condition that
 $$\begin{eqnarray}\displaystyle -1<-\frac{2\unicode[STIX]{x1D707}_{\boldsymbol{k}}}{\unicode[STIX]{x1D6FC}_{\boldsymbol{k}}}<1,\quad -1<-\frac{2\unicode[STIX]{x1D70E}_{\boldsymbol{k}}}{\unicode[STIX]{x1D6FD}_{\boldsymbol{k}}}<1. & & \displaystyle \nonumber\end{eqnarray}$$
Appendix D. Matrix elements for normal mode interactions
Define the following functions written in terms of the matrix elements from Choi (Reference Choi2019):
 $$\begin{eqnarray}f_{k}^{(1)}=\sqrt{[h_{k}^{(1a)}]^{-1}h_{k}^{(2a)}},\quad f_{k}^{(2)}=\sqrt{[h_{k}^{(3a)}]^{-1}h_{k}^{(4a)}}.\end{eqnarray}$$
Then the matrix elements before applying the canonical transformation (C 5) are
 $$\begin{eqnarray}\unicode[STIX]{x1D60E}_{123}^{(1)}=-\frac{h_{123}^{(1)}}{2}\sqrt{\frac{f_{3}^{(1)}}{2f_{1}^{(1)}f_{2}^{(1)}}},\quad \unicode[STIX]{x1D60E}_{123}^{(2)}=-\frac{h_{123}^{(2)}}{2}\sqrt{\frac{f_{3}^{(1)}}{2f_{1}^{(1)}f_{2}^{(2)}}},\end{eqnarray}$$
 $$\begin{eqnarray}\unicode[STIX]{x1D60E}_{123}^{(3)}=-\frac{h_{123}^{(3)}}{2}\sqrt{\frac{f_{3}^{(1)}}{2f_{1}^{(2)}f_{2}^{(2)}}},\quad \unicode[STIX]{x1D60E}_{123}^{(4)}=-\frac{h_{123}^{(4)}}{2}\sqrt{\frac{f_{3}^{(2)}}{2f_{1}^{(1)}f_{2}^{(1)}}},\end{eqnarray}$$
 $$\begin{eqnarray}\unicode[STIX]{x1D60E}_{123}^{(5)}=-\frac{h_{123}^{(5)}}{2}\sqrt{\frac{f_{3}^{(2)}}{2f_{1}^{(1)}f_{2}^{(2)}}},\quad \unicode[STIX]{x1D60E}_{123}^{(6)}=-\frac{h_{123}^{(6)}}{2}\sqrt{\frac{f_{3}^{(2)}}{2f_{1}^{(2)}f_{2}^{(2)}}},\end{eqnarray}$$
 $$\begin{eqnarray}\left.\begin{array}{@{}c@{}}\displaystyle \unicode[STIX]{x1D61D}_{k}^{(1)}=\unicode[STIX]{x1D60E}_{12-3}^{(1)}-\unicode[STIX]{x1D60E}_{1-32}^{(1)}-\unicode[STIX]{x1D60E}_{-321}^{(1)},\\ \displaystyle \unicode[STIX]{x1D61D}_{k}^{(2)}=\unicode[STIX]{x1D60E}_{12-3}^{(2)}-\unicode[STIX]{x1D60E}_{1-32}^{(2)}-\unicode[STIX]{x1D60E}_{-321}^{(2)},\ldots ,\\ \unicode[STIX]{x1D61D}_{k}^{(i)}=\unicode[STIX]{x1D60E}_{12-3}^{(i)}-\unicode[STIX]{x1D60E}_{1-32}^{(i)}-\unicode[STIX]{x1D60E}_{-321}^{(i)},\quad \text{for }j=1,2,3,\ldots ,6.\end{array}\right\}\end{eqnarray}$$
To calculate the matrix elements after applying transformation (C 5) we make use of the following permutation operator to shorten notation:
 $$\begin{eqnarray}\displaystyle \unicode[STIX]{x1D617}_{ijk}^{123}G=\mathop{\sum }_{i\neq j\neq k}\unicode[STIX]{x1D60E}_{ijk}, & & \displaystyle \nonumber\end{eqnarray}$$
where the summation is taken for  $i,j,k\in \{1,2,3\}$. Furthermore, to shorten expressions involving products of the transformation coefficients (C 1b) we use the shorthand notation
 $\unicode[STIX]{x1D618}^{ijk}\equiv \unicode[STIX]{x1D618}_{1}^{(i)}\unicode[STIX]{x1D618}_{2}^{(j)}\unicode[STIX]{x1D618}_{3}^{(k)},\;i,j,k=1,2,3,\ldots ,8$.
We obtain the coupling coefficients
 $$\begin{eqnarray}\displaystyle \unicode[STIX]{x1D611}_{123}^{(S_{1}I_{2}S_{3})} & = & \displaystyle \unicode[STIX]{x1D618}^{342}\unicode[STIX]{x1D617}_{ijk}^{1-2-3}\unicode[STIX]{x1D60E}^{(1)}+(\unicode[STIX]{x1D618}^{386}\unicode[STIX]{x1D617}_{ij1}^{1-2-3}+\unicode[STIX]{x1D618}^{746}\unicode[STIX]{x1D617}_{ij-2}^{1-2-3}+\unicode[STIX]{x1D618}^{782}\unicode[STIX]{x1D617}_{ij-3}^{1-2-3})\unicode[STIX]{x1D60E}^{(3)}\nonumber\\ \displaystyle & & \displaystyle +\,(\unicode[STIX]{x1D618}^{742}\unicode[STIX]{x1D617}_{ij1}^{1-2-3}+\unicode[STIX]{x1D618}^{382}\unicode[STIX]{x1D617}_{ij-2}^{1-2-3}+\unicode[STIX]{x1D618}^{346}\unicode[STIX]{x1D617}_{ij-3}^{1-2-3})\unicode[STIX]{x1D60E}^{(4)}\nonumber\\ \displaystyle & & \displaystyle +\,\unicode[STIX]{x1D618}^{786}\unicode[STIX]{x1D617}_{ijk}^{1-2-3}\unicode[STIX]{x1D60E}^{(6)}+(\unicode[STIX]{x1D618}^{442}\unicode[STIX]{x1D617}_{ij-1}^{-1-2-3}+\unicode[STIX]{x1D618}^{332}\unicode[STIX]{x1D617}_{ij2}^{12-3}+\unicode[STIX]{x1D618}^{341}\unicode[STIX]{x1D617}_{ij3}^{1-23})\unicode[STIX]{x1D61D}^{(1)}\nonumber\\ \displaystyle & & \displaystyle +\,(\unicode[STIX]{x1D618}^{486}\unicode[STIX]{x1D617}_{ij-1}^{-1-2-3}+\unicode[STIX]{x1D618}^{736}\unicode[STIX]{x1D617}_{ij2}^{12-3}+\unicode[STIX]{x1D618}^{781}\unicode[STIX]{x1D617}_{ij3}^{1-23})\unicode[STIX]{x1D61D}^{(3)}\nonumber\\ \displaystyle & & \displaystyle +\,(\unicode[STIX]{x1D618}^{842}\unicode[STIX]{x1D617}_{ij-1}^{-1-2-3}+\unicode[STIX]{x1D618}^{372}\unicode[STIX]{x1D617}_{ij2}^{12-3}+\unicode[STIX]{x1D618}^{345}\unicode[STIX]{x1D617}_{ij3}^{1-23})\unicode[STIX]{x1D61D}^{(4)}\nonumber\\ \displaystyle & & \displaystyle +\,(\unicode[STIX]{x1D618}^{886}\unicode[STIX]{x1D617}_{ij-1}^{-1-2-3}+\unicode[STIX]{x1D618}^{776}\unicode[STIX]{x1D617}_{ij2}^{12-3}+\unicode[STIX]{x1D618}^{785}\unicode[STIX]{x1D617}_{1j3}^{1-23})\unicode[STIX]{x1D61D}^{(6)},\end{eqnarray}$$
 $$\begin{eqnarray}\displaystyle \unicode[STIX]{x1D611}_{123}^{(I_{1}I_{2}I_{3})} & = & \displaystyle \unicode[STIX]{x1D618}^{112}\unicode[STIX]{x1D617}_{ijk}^{1-2-3}\unicode[STIX]{x1D60E}^{(1)}+(\unicode[STIX]{x1D618}^{386}\unicode[STIX]{x1D617}_{ij1}^{1-2-3}+\unicode[STIX]{x1D618}^{746}\unicode[STIX]{x1D617}_{ij-2}^{1-2-3}+\unicode[STIX]{x1D618}^{782}\unicode[STIX]{x1D617}_{ij-3}^{1-2-3})\unicode[STIX]{x1D60E}^{(3)}\nonumber\\ \displaystyle & & \displaystyle +\,(\unicode[STIX]{x1D618}^{742}\unicode[STIX]{x1D617}_{ij1}^{1-2-3}+\unicode[STIX]{x1D618}^{382}\unicode[STIX]{x1D617}_{ij-2}^{1-2-3}+\unicode[STIX]{x1D618}^{346}\unicode[STIX]{x1D617}_{ij-3}^{1-2-3})\unicode[STIX]{x1D60E}^{(4)}\nonumber\\ \displaystyle & & \displaystyle +\,\unicode[STIX]{x1D618}^{786}\unicode[STIX]{x1D617}_{ijk}^{1-2-3}\unicode[STIX]{x1D60E}^{(6)}+(\unicode[STIX]{x1D618}^{442}\unicode[STIX]{x1D617}_{ij-1}^{-1-2-3}+\unicode[STIX]{x1D618}^{332}\unicode[STIX]{x1D617}_{ij2}^{12-3}+\unicode[STIX]{x1D618}^{341}\unicode[STIX]{x1D617}_{ij3}^{1-23})\unicode[STIX]{x1D61D}^{(1)}\nonumber\\ \displaystyle & & \displaystyle +\,(\unicode[STIX]{x1D618}^{486}\unicode[STIX]{x1D617}_{ij-1}^{-1-2-3}+\unicode[STIX]{x1D618}^{736}\unicode[STIX]{x1D617}_{ij2}^{12-3}+\unicode[STIX]{x1D618}^{781}\unicode[STIX]{x1D617}_{ij3}^{1-23})\unicode[STIX]{x1D61D}^{(3)}\nonumber\\ \displaystyle & & \displaystyle +\,(\unicode[STIX]{x1D618}^{842}\unicode[STIX]{x1D617}_{ij-1}^{-1-2-3}+\unicode[STIX]{x1D618}^{372}\unicode[STIX]{x1D617}_{ij2}^{12-3}+\unicode[STIX]{x1D618}^{345}\unicode[STIX]{x1D617}_{ij3}^{1-23})\unicode[STIX]{x1D61D}^{(4)}\nonumber\\ \displaystyle & & \displaystyle +\,(\unicode[STIX]{x1D618}^{886}\unicode[STIX]{x1D617}_{ij-1}^{-1-2-3}+\unicode[STIX]{x1D618}^{776}\unicode[STIX]{x1D617}_{ij2}^{12-3}+\unicode[STIX]{x1D618}^{785}\unicode[STIX]{x1D617}_{1j3}^{1-23})\unicode[STIX]{x1D61D}^{(6)}.\end{eqnarray}$$