Nomenclature
- AIP
-
Aeronautical Information Publication
- ATCo
-
Air Traffic Controller
- ATM
-
air traffic management
- CDM
-
collaborative decision-making
- CDP
-
common departure path
- EP
-
entry point
- FAF
-
final approach fix
- FAP
-
final approach path
- FCFS
-
first come first served
- HP
-
hot point
- IAT
-
inter-arrival time
- IATA
-
inter-arrival time of consecutive arrivals
- IATD
-
inter-arrival time of consecutive departures
- LTBA
-
Atatürk International Airport
- LTFJ
-
Sabiha Gökçen International Airport
- LTFM
-
Istanbul International Airport
- PMS
-
point merge system
- ROT
-
runway occupancy time
- ROTA
-
runway occupancy time for arrivals
- ROTD
-
runway occupancy time for departures
- TMA
-
terminal manoeuvring area
1.0 Introduction
The aviation industry has been rapidly growing and the number of passengers has been increasing annually [1]. Despite the severe impact of the COVID-19 pandemic on the civil aviation industry, air travel demand has been steadily growing [Reference Truong2]. In parallel with this growth, air traffic becomes more intense, and airlines, airports and ATM units take various measures to meet this increasing demand. However, as a result of the developments in the aviation industry, ATM has also become quite complex. In particular, the presence of airports located in metroplex airspace near large cities further complicates this challenge. Therefore, it is imperative to devise effective solutions to manage air traffic in metroplex airspace.
Metroplex airspace includes multiple airports close to each other, whose arrival and departure operations are highly interdependent, and a complex network of air traffic flows, typically within a metropolitan area. Airports in the metroplex airspace have a complex interaction with each other due to their proximity and the high volume of air traffic. In order to effectively manage the air traffic in metroplex airspace, it is necessary to conduct detailed analyses of the capacities of both the airspace and the airports within it. This includes determining the current capacities of the runways and routes in the metroplex airspace and projecting the future capacities by adding new facilities. Additionally, the capacities of the airspace and runways should be compared to assess whether they are balanced. If the runway capacity is lower than the airspace capacity, it can lead to congestion and delays, as air traffic controllers may have to limit the number of aircraft taking off or landing at the airport. Conversely, if the runway capacity is higher than the route capacity, it can lead to underutilisation of the airport capacity [Reference De Neufville and Odoni3]. By conducting these analyses and taking strategic steps to increase capacity, the aviation industry can better manage the complex air traffic in the metroplex airspace and meet the growing demand.
Istanbul is a rapidly growing metropolitan area that serves as a critical hub for international travel, trade and commerce between Europe and Asia. As such, the city has become a major player in the global aviation industry, with its airports handling millions of passengers and thousands of flights each year. Istanbul’s airports serve as gateways for both domestic and international passengers, making the city a significant player in the global aviation industry.
Atatürk (LTBA), Sabiha Gökçen (LTFJ) and Istanbul (LTFM) are among the busiest airports in the world and are located within the city’s metroplex airspace. LTBA, located on the European side of Istanbul, was the primary airport serving the city until the opening of LTFJ on the Asian side in 2001. Since then, both airports have experienced significant growth, with LTFM, the newest and largest airport in the city, opening in 2019 to serve as the primary gateway to Istanbul and the wider region. The three main airports in Istanbul are located at varying distances from each other. LTFM and LTFJ are approximately 63 km (34 nm) apart in a straight line. LTFM and LTBA are situated at a distance of about 35 km (19 nm) from each other, while LTFJ and LTBA are separated by approximately 42 km (23 nm). These distances are calculated based on geographical coordinates, representing the aerial distances. The passenger traffic and total aircraft movements obtained from the General Directorate of State Airports Authority (GDSAA) reveal significant insights into the air traffic at these key hubs. LTBA accommodates annual passenger traffic of approximately 68.4 m and manages 464,646 aircraft movements that include both commercial and cargo operations. LTFJ facilitated approximately 36.62 m passengers across 167,175 total flights. LTFM follows with around 75.80m passengers and 374,861 aircraft movements. These figures emphasise the dynamic nature of air travel in Istanbul [4]. With high-density air traffic and multiple airports located in close proximity, ATM has become a significant challenge in Istanbul’s metroplex airspace, making the determination of ATM and capacity a critical issue for stakeholders in the aviation industry. In this study, we aim to determine the runway and route capacities of these airports using Monte Carlo simulation, which can provide valuable insights into how to better manage the complex air traffic in Istanbul’s metroplex airspace.
Monte Carlo simulation is a mathematical method used to model and analyse complex systems. It involves generating random numbers to simulate the possible outcomes of a situation and then using statistical techniques to analyse the results. This method can be used in a wide range of fields, including finance [Reference Chen and Hong5, Reference Chopra, Tyagi, Popli and Pandey6], science and engineering [Reference Amar7, Reference Bang Huseby, Vanem and Natvig8], medical physics [Reference Carrier, Archambault, Beaulieu and Roy9–Reference Sarrut, Arbor, Baudier, Borys, Etxebeste, Fuchs and Maigne12], statistical physics [Reference Condon and Ogielski13–Reference Landau, Tsai and Exler15] and risk assessment [Reference Baghal and Khodashenas16–Reference Stroeve, Blom and (Bert) Bakker20] to evaluate the probability of different outcomes and to make predictions about the future behaviour of the system. Besides, it has been applied to address the impact of high-speed rail on air travel demand [Reference Hong and Najmi21] and to assess the impact of the integration of continuous climb operations on Air Traffic Controller (ATCo) workload by evaluating different combinations of operational modules [Reference Pérez-Castán, Asensio, Rodríguez-Sanz, Ho-Huu, Sanz, Comendador and Valdés22]. The simulation was also used in some analyses, such as predicting carbon emission trends in Ref. [Reference Liu, Hang, Wang and Zhou23] and performing a sensitivity analysis to understand the impact of operational uncertainties on the departure sequencing process in Ref. [Reference Feuser Fernandes and Müller24].
Several studies have presented airport and airspace operations with the Monte Carlo simulation. Visintini et al. presented a framework for conflict resolution in air traffic control that considers uncertainty using a stochastic simulator. This optimises an expected value criterion to limit the probability of conflict through an iterative procedure based on the Markov chain Monte Carlo. Their approach aims to bring the advantages of Monte Carlo techniques, such as flexibility and problem-solving complexity to conflict resolution in terminal manoeuvring areas (TMA) and approach sectors [Reference Visintini, Glover, Lygeros and Maciejowski25]. Hu et al. first analysed the degree of airport capacity utilisation of 239 China’s civil airports in 2019. They then predicted capacity utilisation trends of these airports in 2025 and 2035 using Monte Carlo simulation [Reference Hu, Feng, Witlox, Zhang and Connor26].
One of the preliminary studies to determine the runway capacity using Monte Carlo was made by Pitfield and Jerrard. They conducted simulations of three different scenarios to determine the unconstrained capacity and delay at the Rome Fiumicino International Airport when operating under different runway configurations. In their study, the inter-arrival time (IAT) between operations was equal to the sum of the wake turbulence separation and runway occupation time [Reference Pitfield and Jerrard27]. In this case, a larger number of departure aircraft could operate as the IAT was greater than the required safety separation. Thus, the number of departure aircraft was nearly equal to the number of arrival aircraft with low delays. However, the results showed a decrease in the total number of departures and a significant increase in delays during intersecting runway operations. In the study conducted to estimate the existing runway capacities of multiple airports in the London airspace [Reference Irvine, Budd and Pitfield28], the relative effect on airport capacity in the airspace was analysed in the case of the additional runways and the construction of a new hub airport. This paper used the Monte Carlo simulation to analyse five proposals for addressing future airport capacity in London and the South East of England. The IAT was equal to the wake turbulence separation. The results provided comparable figures for current and potential future capacities at individual airports and across the three main London airports. In both studies, the randomised variable was only the traffic mix at the airport. In the first study, the final approach speed of aircraft was constant for all categories, but in the second study, it varied according to the category. Zhong et al. performed the simulation to estimate runway capacity and assess the impact of thunderstorms on delays. The variables were the traffic mix and the order in which arrival or departure occurs. They compared thunderstorm-induced delays with the average delay of the corresponding reference days and found that it contributed to ∼5
 $\%$
of the total delay [Reference Zhong, Varun and Lin29]. Hirata et al. developed an analytical model for estimating runway capacity for airports with multiple crossing runways, considering the interaction of the three runways. The model uses Monte-Carlo Simulation to compute the practical capacity curve of the runway system with varying arrival/departure mix. Additionally, the impact of the sequencing of departure/arrival aircraft with respect to wake turbulence category was analysed using a more heuristic model that accounts for the practical feasibility of arrival spacing on the final approach [Reference Hirata, Shimizu and Yai30]. Wang and Zhao analysed several factors affecting the maximum capacity for parallel two runways. Using the Monte Carlo method, the randomness of factors such as runway allocation, aircraft type allocation, take-off or landing type allocation, fix point allocation and flight sequence was simulated. The capacity was then calculated by computing the departure or arrival time of each flight recursively based on the principle of discrete event systems [Reference Wang and Zhao31].
The simulation was also used to study potentially conflicting ground movements, including towed aircraft, on the congested taxiway at an international airport [Reference Pitfield, Brooke and Jerrard32]. The simulation approach adopted by the authors resolved the taxiing conflicts by controlling aircraft to wait at designated holding points.
Our study aims to conduct detailed analyses of the capacities of both the airport and surrounding airspace in a metroplex area and to compare them to identify any differences or limitations. We use Monte Carlo simulation to determine the ultimate and practical capacities of the airport and surrounding airspace. To achieve this aim, we define the traffic mix and runway occupancy time (ROT) at the airport, and traffic distribution at airspace entry points as the randomised variables. Moreover, we consider the speed differences in the final approach line when calculating the IAT of consecutive arrivals (IATA), and the speed differences along the common flight path after take-off when calculating the IAT of consecutive departures (IATD). By determining the current capacities of the runways and routes in the metroplex airspace, and projecting the future capacities by adding new facilities, we aim to provide insights into effectively managing air traffic in the metroplex airspace.
The specifications of our study can be summarised as follows:
-
The capacities of both the airports and the surrounding airspace were determined using Monte Carlo simulation.
-
The study defines ROT and traffic distribution at airspace entry points as well as traffic mix as randomised variables.
-
The speed differences in the final approach line are considered when calculating IATA.
-
The speed differences along the common flight path after take-off are also considered when calculating the IATD.
2.0 Method
The airport and airspace capacity, which reflects the quantity of air transport service systems reflected by the possible number of aircraft movements, can be estimated using several fast-time simulation models such as SIMMOD [33–Reference Wang, Zhang and Xu38], ARENA [Reference Cetek and Cetek39, Reference Peng, Wei and Jun-Qing40], CAST [41], TAAM [Reference Bazargan, Fleming and Subramanian42, 43], AirTOP [44] and RAMS [45, Reference Majumdar and Polak46]. A comprehensive overview of these tools and techniques is provided in the literature [Reference Mumayiz47, Reference Zografos and Madas48]. In this study, we utilise Monte Carlo simulation, which has proven to be equally as convenient as these models, in order to estimate the ultimate and practical capacity of an airport and surrounding airspace in a given period and under certain conditions. The ultimate capacity is the maximum number of operations obtained by enforcing the safety requirements under ideal conditions of constant demand for service. The practical capacity is the maximum number of operations obtained by enforcing the safety requirements under condition when the maximum delay of each operation does not exceed a level prescribed in advance [Reference Horonjeff, McKelvey, Sproule and Young49, Reference Janić50]. The analytical models, simulation models and empirical models are generally used to analyse ultimate and practical runway capacities. Analytical models encompass time-space analysis as well as mathematical queueing models [Reference Horonjeff, McKelvey, Sproule and Young49–Reference Ashford, Mumayiz and Wright51].
In Monte Carlo simulation, random numbers are generated to handle the uncertainties of variables in the system. For this, each variable is assigned a random number based on the predefined probability distributions in the simulation. Thanks to the simplicity and flexibility of simulation, different results for the repeated random samples of variables are computed and averaged together [Reference Zhong, Varun and Lin29]. In this study, we define the traffic mix and ROT at the airport, and traffic distribution at airspace entry points as the randomised variables. These variables directly affect the airport and airspace capacities and delays.
The traffic mix consists of different types of aircraft allocated to wake turbulence categories. These categories are set according to the maximum take-off mass of aircraft as Heavy (136,000kg or more), Medium (7,000–136,000kg) and Light (7,000kg or less). The heavier aircraft create more turbulence and therefore require more separation than lighter aircraft to maintain safety requirements as given in Tables 1 and 2 for arrivals and departures, respectively [52]. For this reason, the separations between consecutive aircraft directly affect the capacity of an airport in a specified time window.
Separation distances (
 ${d_{ij}}$
) between consecutive arrival
 $i$
and
 $j$
(nm) [52]

Wake turbulence separation times (
 ${t_{ij}}$
) between consecutive departure
 $i$
and j (sec.) [52]

The ROT of leading aircraft affects the arrival and departure times of trailing aircraft [Reference Zhong, Varun and Lin29]. The runway occupancy time for arrivals (ROTA) is defined as the time spent by aircraft between the runway threshold and the runway exit point. The runway occupancy time for departures (ROTD) is equal to the time from the moment the aircraft crosses the holding stop bar until it flies over the opposite threshold. The ROT depends on the runway configurations and properties, aircraft categories due to different landing speeds and weights, operation techniques and reaction times of pilots, weather conditions, etc [Reference Pavlin, Zuzic and Pavicic53]. Because these factors can lead to different ROTs for each operation, they affect the operation times and delays and thus airport capacity. Therefore, in this study, we randomised the ROT of each aircraft and specified different probabilities of ROTA and ROTD for arrival and departure operations according to aircraft categories. In the simulation, we assigned a random probability number (
 $p$
) to determine ROT for each operation using the Equation (1), which considers the minimum (
 $RO{T_{min}}$
) and maximum (
 $RO{T_{max}}$
) occupancy times based on the predefined minimum (
 ${p_{min}}$
) and maximum (
 ${p_{max}}$
) time probabilities.
 \begin{align}ROT = RO{T_{min}} + \frac{{RO{T_{max}} - RO{T_{min}}}}{{{p_{max}} - {p_{min}}}}.\left( {p - {p_{min}}} \right)\end{align}
The other variable randomised in the study is the traffic distribution at airspace entry points around the airport. The locations and numbers of entry points are determined at the airspace design stage. Some of these fixed entry points may have higher traffic rates than others, which causes significant congestion and delays on routes. In addition, the aircraft arriving on routes associated with these fixed entry points with higher traffic distribution rates can cause significant traffic congestion and delays at intersection points. Therefore, we randomised the traffic rates at airspace entry points as it directly affects the airspace capacity.
2.1 Operations on final approach path and runway
A Monte Carlo simulation example of arrival operations on the runway is given in Table 3. A random number between 0-1 is assigned for each aircraft to represent its probability. Based on this assigned number, the categories of the aircraft are determined based on the predetermined category distributions. Subsequently, the required separation distances between consecutive arrival aircraft are provided for each aircraft based on the values given in Table 1. The simulation is carried out with flight times, and therefore, these distances are converted into times by considering the final approach speeds of the aircraft as shown in the next column. Additional random probability numbers between 0-1 are assigned and the ROTA times of the arrival aircraft are determined by using Equation (1).
Operations on final approach path and runway of arrivals

In the calculation of IATA, we should consider not only the safety margins between operations but also the speed differences along the final approach path (FAP). For the cases that the speed of leading aircraft (
 ${v_i}$
) or trailing aircraft (
 ${v_j}$
) is greater during the common FAP distance (
 ${l_{fap}}$
), the IATA values can be calculated as described below [Reference Janić50]:
 \begin{align}IATA = \left\{ \begin{array}{l@{\quad}l}\dfrac{l_{fap} + d_{ij}}{v_j} - \dfrac{l_{fap}}{v_i} & for\ {v_i} \gt {v_j}\\[15pt]\max \left[ \dfrac{d_{ij}}{v_j},ROT{A_i} \right] & for\;{v_i} \le {v_j}\;\end{array} \right.\end{align}
The simulation starts at time 0, and it is assumed that the first aircraft is at the runway threshold at this moment. The next aircraft follows the first one with the necessary IATA. For example, when the first aircraft is at the runway threshold, it will take 167 seconds for the second aircraft to reach the runway threshold. After reaching the runway threshold, the aircraft will vacate the runway at the end of the ROTA. Arrivals are simulated before departures due to the priority of inbound aircraft. This described process is repeated to simulate one hour of ultimate operations. For this reason, the process is stopped when the time reaches 3,600 seconds and the total number of operations is obtained. The number of arrival aircraft that have passed the runway threshold but have not yet vacated the runway within these seconds is not counted in the total number.
Operations on runway and departure common path of departures

A Monte Carlo simulation example of departure operations is given in Table 4. Aircraft categories and runway occupation times are determined the same way as for arrivals. The required time separations between consecutive aircraft are provided for each departure based on the values given in Table 2. When calculating the IATD of consecutive aircraft, besides the safety separations of the aircraft, the speed differences along the common departure path (CDP) should be considered. IADT values can be calculated as described in Equation (3) [Reference Janić50], considering the cases that the speed of the leading aircraft (
 ${v_i}$
) or the trailing aircraft (
 ${v_j}$
) is greater along the CDP (
 ${l_{cdp}}$
). After 3,600 seconds, the process is stopped and the total departures are counted. Aircraft that have started their take-off but have not vacated the runway within these seconds are not counted in the total number.
 \begin{align}IATD = \left\{ \begin{array}{l@{\quad}l}{t_{ij}} & for\;{v_i} \gt {v_j}\\[9pt]\max \left[ {{t_{ij}},{t_{ij}} + ROT{D_i} - ROT{D_j} - {l_{dcp}}\left( {\dfrac{1}{{{v_j}}} - \dfrac{1}{{{v_{}}}}} \right)} \right] & for\;{v_i} \le {v_j}\;\end{array} \right.\end{align}
In the simulation, the times when the runway was used and empty were determined for each of both arrival and departure operations. However, in the case of mixed operations, the priority is arrivals. For this reason, departure operations occurred when the runway was sufficiently empty. Then, the delays of the departures were calculated. As the arrivals were operating very tightly, the runway was left empty very few times. For this reason, the delays of departure aircraft showed a cumulative increase and the average delay time reached greater numbers. However, this is reasonable as the runway is effectively fully utilised and we are concerned with ultimate capacity.
2.2 Operations on airspace
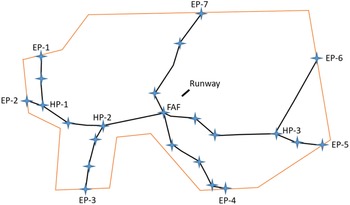
In this study, a Monte Carlo simulation of the operations in the airspace surrounding the airport (referred to as TMA) was also carried out. A general TMA structure is given in Fig. 1. Arrival aircraft enter TMA from predefined entry points (EPs) and levels and reach the final approach fix (FAF) by following the routes defined in the flight charts. They descend according to the levels they should be at the points on their route. Besides the speed differences at all levels according to the aircraft categories, the flight level and flight speed restrictions specified in the flight charts are considered in the simulation. Required safety separations between aircraft are guaranteed at intersection points (called hot points – or HPs) and FAF. The first come, first served (FCFS) principle has been adopted at all intersections. Aircraft using the same route were not allowed to overtake each other. The results of a sample simulation study are given in Table 5.
A general TMA route structure.

Operations on arrival routes within TMA

The Monte Carlo simulation technique is utilised to model the inherent uncertainties and variability within airspace operations. The simulation process initiates with the randomisation of critical parameters that significantly influence airspace operations. The categories of arrivals and EP distributions are subjected to a randomisation process, governed by predefined probabilities. The difference between the entry times of the arrivals entering from the same point to the TMA is at least as much as the minimum radar separation. The estimated arrival times at HP (HP Est) and FAF (FAF Est) are calculated using the route distances and flight speeds. The times at HPs and FAF of aircraft are then reassigned to meet the minimum safety requirements. The assigned HP times (HP Asgn) and FAF time (FAF Asgn) are presented in Table 5. These times indicate when the aircraft should be at these points. The simulation is stopped when the difference between the assigned FAF times of the first and last aircraft reaches 3,600 seconds. The total number of flights in this period has been determined. In addition, delay analyses are performed by calculating the differences between the assigned times and the targeted times.
After the departure aircraft vacates the runway, they leave the TMA from certain points by using the departure routes defined for them in the flight charts. Departures start with a single route and split into multiple routes. In addition, the routes of departures do not intersect with the routes of arrivals. Departures do not receive delays as they do not overtake other arrivals and departures. For this reason, the total number of flights in the airspace for departure aircraft is considered equal to the total number of departures on the runway.
3.0 Data
3.1 Traffic mix and traffic distributions at TMA entry points
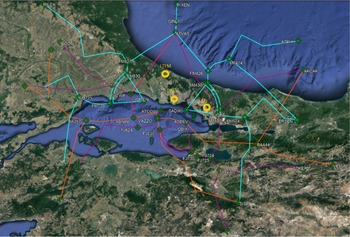
The simulation study was carried out for three major international airports in the Istanbul metroplex. These are LTBA, LTFJ and LTFM international airports. The entry points and route structures to the TMA for arrival operations at these airports are shown in Fig. 2 in orange, fuchsia and cyan colours, respectively. The route structure of LTFJ and LTFM is the point merge system (PMS). Each airport has 7 entry points [54]. For the dates 17–20 August 2018, Eurocontrol Demand Data Repository (DDR) traffic data was analysed and the traffic distribution rates at the entry points were determined as given in Table 6 [55]. There are common TMA entry points for the three airports and common fixes through their arrival routes. However, the flight levels required by the aircraft at these points are different for each airport. In addition, it is seen that the routes are divided into two after the ATVAS and ERSEN points. During the simulation, it is assumed that the traffic at these points is divided equally. In addition, the traffic distribution rates of LTBA and LTFJ on these dates were analysed. Live traffic data on flightradar24 were used to determine traffic rates of LTFM. As a result of the analysed and organised data, the traffic distribution rates are obtained as given in Table 7.
The average traffic distributions of TMA entry points

Traffic mix of airports (
 $\%$
)

TMA entry points and arrival routes of LTBA, LTFJ and LTFM.

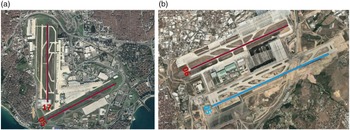
The LTBA has two runways 05/23 and 17/35 in open-V configuration [54]. Runways 05 and 17 were used in the simulation due to the prevailing wind directions and frequency of use (Fig. 3(a)). Departures were performed on runway 17, while arrivals were performed on both runways. Currently, the airport continues to operate as a single runway (05/23), especially for cargo and private flights. Afterward, it is planned to be completely closed to flights.
Ground layout of (a) LTBA and (b) LTFJ (runway 05/23 is planned to build).

The LTFJ is one of the busiest airports with a single runway 06/24 [54]. When the traffic data are examined, the average number of flights per day is approximately 700. Runway 06 was used in the simulation due to the prevailing wind directions and frequency of use (Fig. 3(b)). With the opening of runway 05, which is still under construction, the airport will have two independent runways. It is expected that the density of the LTFJ will gradually increase as LTBA is closed to flights.
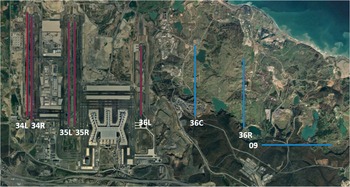
As seen in Fig. 4, LTFM currently has five runways: 34L/16R, 34R/16L, 35L/17R, 35R/17L and 36L/18R. However, 34L/16R and 34R/16L and 35L/17R and 35R/17L are dependent runways. For this reason, they are considered as a single runway in the simulation and called runways 34 and 35 [Reference Dönmez, Çetek and Kaya56]. In the future, it is planned to build 09/27 and 36C/18C runways to the airport. The construction of runway 36R/18L is the final stage of the airport. Runways 09, 34, 35, 36L, 36C and 36R were used in the simulation due to the prevailing wind directions and frequency of use.
Ground layout of LTFM (runways 36C/18C, 36R/18L and 09/27 are planned to build).

3.2 Separation minima
All aircraft generate wake vortices as a function of lift generation, which may affect another aircraft and cause an incident. For this reason, the wake turbulence separation between aircraft has to be ensured by the values given in Tables 1 and 2 in Section 3. Besides the wake turbulence separation minima on the FAP and runway, aircraft should be separated on routes using minimum radar separation distance. This distance is specified as 5 nm within TMAs in the regulations. The distance-based separation rules can be transformed into time-based separation rules by including the aircraft approach speeds in the calculation.
3.3 Aircraft speeds
The average speed values between the FAF and the runway threshold of the aircraft along the FAP are given in Table 8. While calculating the IAT times between successive aircraft, these speed values were used to convert the distances to time. Values given by manufacturers as ‘approach speeds’ are defined as 1.3 times the stall speed at maximum landing weight in the landing configuration [Reference Janić50].
Final approach path nominal airspeeds (knots)

Operational speeds in the airspace were determined by considering the flight level and speed restrictions specified in the flight charts. Considering these values determined for fixes, average flight speeds along the routes were calculated. Route distances were converted to times in calculations using these speeds.
3.4 Common arrival/departure path
When calculating the required IAT times between aircraft, the common route distances are also considered. Thus, the required safety separations will not be violated due to airspeed differences along these common paths. The distances of paths to be used by the operations at the three airports are given in Table 9. The distances may vary for different runways at LTFM.
Common approach and departure path distances (nm)

The cumulative probabilities of ROTA (sec)

3.5 Runway occupancy time
One of the variables randomised in the study is the ROT of the aircraft. The probabilities of the ROT for certain value ranges have been determined for different aircraft categories. The ROTA and cumulative probabilities of arrival aircraft are given in Table 10, and the ROTD and cumulative probabilities of departure aircraft are presented in Table 11. In arrival operations, the time required for aircraft to vacate the runway is longer for larger aircraft. Since the required ROTD for medium and heavy aircraft is very close to each other, it is accepted the same in the simulation. According to the values given in the tables, ROT times are assigned by using Equation (1) given in Chapter 3. These times also affect the IATA and IATD times of aircraft given in Equations (2) and (3).
The cumulative probabilities of ROTD (sec)

Scenarios of runway configuration

4.0 Scenario Planning
In order to determine the runway capacities of the airports in Istanbul, four different scenarios were defined as given in Table 12. These scenarios also consist of sub-scenarios such as a, b and c. The purpose of creating sub-scenarios is to show how the use of runways in different modes affects airport total capacity and capacity changes over time. Scenario-1 shows the airport and the runways used in the near past. These scenarios, which represent the period before 2019, include LTBA and LTFJ. Later, with the opening of LTFM, the number of airports increased to three. Thus, Scenario-2 was defined to represent the current situation. It is envisaged that in the near future, the second runway (05) will be opened at LTFJ and runways 09 and 36C at LTFM. Thus, the total number of runways in the TMA structure will be eight. Scenario-3 was created to represent this situation. Later, with the completion of the final phase of the LTFM, the total number of runways will be six as shown in Scenario-4. In order to show the changes in capacity values when these runways are used in different configurations, three different sub-scenarios were created. However, LTBA is not included in this scenario as it is foreseen that the airport will be completely closed to flights in the future. In final form, there will be a total of eight runways in Istanbul TMA.
In the future, with the closure of LTBA to flights, it is expected that heavy category flights will shift here with the opening of the second runway to LTFJ. For this reason, in Scenario-3 and Scenario-4, representing future situations, the ratio of heavy aircraft in the LTFJ traffic distribution is accepted as 20
 $\%$
. Thus, it was possible to show that the change in the traffic distribution rate how affects the capacity.
5.0 Ultimate capacities of runway operations
Table 13 shows the simulation results of two runways at LTBA. Runway 05 is used in mixed mode operations, while runway 17 only departures. According to the table, the total ultimate hour capacity is around 109 movements for this runway configuration. The number of arrivals ranged from 47 to 51 with a mean of around 49 and departures from 8 to 13 with a mean of around 12 on runway 05. The average number of departures is around 49 on runway 17. In addition, the delays of departures in mixed mode operation are calculated. The minimum delay of departures ranged from 0.8 to 13.9 min with a mean of 242 min. Suitable gaps must be found between the arriving traffic in which to slot in departures. Therefore, the minimum delay of aircraft has a wide range.
Simulation results of LTBA

The simulation results for LTFJ are given in Table 14. According to the scenarios given in Table 12, runway 05 and runway 06 can only be used in landing and take-off configurations, respectively, as well as both runways can be used in mixed operation mode. The total ultimate hour capacity is around 117 movements for mixed-mode runway configurations. When runways 05 and 06, however, are used for only arrival and departure operations, respectively, then the number of arrivals and departures will be around 51 and 55.
Simulations for runway 06 and runway 05 at LTFJ

Simulations for runway 34 and runway 35 at LTFM

Simulations for runway 36L and runway 36C at LTFM

The rate of heavy aircraft (20
 $\%$
) on runway 05, which will be opened in the future, is considered higher than on runway 06. In this case, there was a decrease in the total number of arrivals, while the total number of departures increased. Because, as the number of heavy arrival aircraft increases, there are more slots for departures to perform their operations. In addition, as the slot rate increased, there was a significant decrease of approximately 5 minutes in the delays of departures. And, there has been a decrease in the number of delayed aircraft and minimum delay rates. This resulted in an increase in capacity.
LTFM simulation results are presented in Tables 15, 16 and 17. Accordingly, the total capacities of runways 34, 35 and 36L in the current state of mixed operation mode are approximately 59, 58 and 57, respectively. In this case, the total runway capacity is 174. If runway 34 is used for arrivals only and runway 35 only for departures, the total number of landings and take-offs is approximately 49 and 50, respectively. Since it is closer to the terminal building, it is accepted that the 36L runway can be used for departures in scenarios. If all category aircraft are allowed to operate on this runway, a total of 51 departures can be performed, while if only heavy category aircraft are allowed to take off, the total number of departures is 41. The average delays of departures for runways 34, 35 and 36L were approximately 24, 21 and 22 minutes, respectively. The reason for the high delays is that priority is always given to the arrivals and the departures can only be performed between the arrivals with enough slots.
Simulations for runway 36R and runway 09 at LTFM

For the 09, 36C and 36R runways to be opened in the future, the heavy aircraft rate is accepted as 30
 $\%$
. Since runways 36C and 36R are far from the terminal building, it has been considered that they can be used for arrival operations only as well as in mixed operations. In this case, the capacity is approximately 46 and 45 for runways 36C and 36R, respectively. Due to the increase in the number of heavy aircraft, the number of landings, which was about 48 for heavy aircraft with a rate of 24
 $\%$
, decreased to these values. However, as the number of heavy arrival aircraft increases, there are more slots for departures to perform their operations. Besides, there has been a decrease in the number of delayed aircraft and minimum delay rates. It is foreseen that runway 09 will be allocated only for departures. If all category aircraft can perform operations on this runway, the capacity will be approximately 47, while it will be 60 if only medium category aircraft operations are performed.
The scenarios given in the study show how the airport capacities in the Istanbul metroplex will change over time. While LTBA will be completely closed to flights, new runways will be added to LTFJ and LTFM. The individual effects of these changes on the total capacity are examined separately. As shown in Table 18, the reduction rate in the total capacity will be 20.5
 $\%$
with the complete closure of LTBA to flights. Table 19 shows that opening the second runway at LTFJ almost doubles the airport’s capacity and increases the total capacity of Istanbul metroplex airports by 20.2
 $\%$
. Thus, the decrease in the total capacity resulting from the closure of LTBA will be compensated by this new runway to be opened. Table 20 shows that there will be almost a 94
 $\%$
change in the airport’s capacity with the building of three new runways to LTFM. Table 20 shows that building three new runways at LTFM will increase the capacity by 93.7
 $\%$
and the total capacity of Istanbul metroplex airports by 55.8
 $\%$
.
Comparison of capacity without LTBA

Comparison of LTBA’s future capacity versus the current situation

Comparison of LTFM’s future capacity versus current situation

Table 21 shows the capacities of the airports according to the runway configurations in the scenarios. In scenario 1, which shows the past capacity values, the total runway capacities of LTBA, which has two runways, of which one is used entirely for departures, and LTFJ, which has a single runway with mixed mod, are determined as 167. Today (Scenario 2), LTBA serves with a single runway and LTFM serves with three runways. If runways 34 and 35 are used in segregated mode, the total capacity of LTFM is 155, while it is 174 if they are used in mixed mode. As given in Table 22, a capacity increase of up to 75
 $\%$
has occurred today.
Airport ultimate capacities for scenarios

Comparison of scenarios

In Scenario 3, which represents the near future, with the addition of one new runway to LTFJ and two new runways to LTFM, an increase in capacity by 173
 $\%$
will occur compared to the past (Table 22). In Scenario 3a the runways are used in segregated mode at both airports, and in Scenario 3b the cases in mixed mode are represented. Thus, 29 more manoeuvres are achieved in mixed mode. In Scenario 4, it is envisaged that LTBA will be closed in the future and the final phase of LTFM will be completed and have six runways. As seen in Tables 21 and 22, the decrease in total capacity with the closure of LTBA will be compensated with the completion of LTFM.
The four runways of LTFM are represented in Scenario 4a, two runways in Scenario 4b are used in segregated mode and they are used in mixed mode in Scenario 4c. Consequently, as the number of runways used in mixed mode increases, the capacity increases.
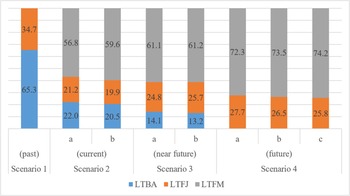
Figure 5 shows the ratios of airports in total capacity for different scenarios. With the opening of new runways and in the case of using runways in segregated or mixed mode, the changes in the total capacity ratios are given as percentages in the figure.
Percentages of airport capacities for scenarios.

6.0 Ultimate capacities of airspace operations
The analyses presented in this section are conducted on the foundation of the detailed Monte Carlo simulation outlined in Section 2.2. This simulation method is employed to model uncertainties and variations inherent in airspace operations. These analyses reflect the dynamic and uncertain nature of air traffic, as provided by the Monte Carlo simulation detailed in Section 2.2. The results emphasise the critical relationship between existing routes, runway capacity and the anticipated growth in arrival numbers.
The simulation process involves the randomisation of arrival categories and entry point distributions based on predefined probabilities. The differences in arrival times for aircraft entering from the same entry points are calculated meticulously to comply with minimum radar separation standards. Moreover, the simulation calculates estimated arrival times at HPs and the FAF by considering route distances and flight speeds. These estimated times are subsequently adjusted to meet safety requirements, resulting in assigned HP and FAF times.
The airspace simulation results of LTBA, LTFJ and LTFM are given in Tables 23, 24 and 25, respectively. The values in the tables show the average delay values in minutes at the hotspot and FAF points (ATCOS, OBIXI, IMREN and SADIK). The delay values at the FAF points increased cumulatively as all aircraft were finally collected at these points.
LTBA airspace simulations

LTFJ airspace simulations

LTFM airspace simulations

According to the airspace simulation results, the ultimate capacity values on the runway and the ultimate capacity of arrival operations obtained with the existing routes are given in Tables 26 and 27, respectively. When the ultimate values on the runway and in the airspace are compared, it is seen that the capacity of the existing routes in the airspace for LTBA and LTFJ is below the runway capacity. In the case that two runways of LTFM are used in segregated mode and one runway is used in mixed mode (Scenario 2a), the airspace capacity covers the runway capacity, while in case all runways are used in mixed mode (Scenario 2b), the capacity of the existing routes remains below the runway capacity. As a result, the arrival routes of these three airports located in the Istanbul metroplex can serve up to a certain ultimate number. In addition, the ultimate value of arrivals, which is up to 244 today, is expected to increase to 335 in the future.
Number of arrivals on runways

Number of arrivals in airspace for current situation

7.0 Practical capacities of runway and airspace operations
In a significant phase of this study, a detailed evaluation was undertaken to calculate the practical capacities on the runways and in the airspace of LTBA, LTFJ and LTFM airports. This assessment is essential for understanding how operational dynamics describe under real-world conditions. Runway capacity calculations considered the interactions between arrival and departure operations. Initially, predefined runway usage plans for each airport were considered. These plans involved different runway configurations. Understanding how aircraft interact along arrival routes is crucial for calculating practical capacities in airspace. Monte Carlo simulation was employed to determine runway capacity and airspace practical capacity under various scenarios. This analysis section provides a more detailed description of the calculation processes for practical capacities on runways and in airspace, allowing for a deeper focus on these critical aspects of the study.
Aircraft not exceeding a certain delay value can be included in the practical capacity. In the report announced by Eurocontrol, the average delay per flight to Europe is 14.7 and 16.4 min for arrivals and departures, respectively [Reference Zhong, Varun and Lin29]. Practical runway capacity values obtained by considering these values are shared for the three airports.
Table 28 shows the simulation results of two runways at LTBA for practical runway capacities. Runway 05 is used in mixed mode operations, while runway 17 only departures. According to the table, the total practical capacity for this runway configuration is approximately 102 movements. The number of arrivals ranged from 47 to 51 with a mean of around 49 and departures from 1 to 8 with a mean of around 4 on runway 05. The average number of departures is around 49 on runway 17. In addition, the delays of departures in mixed mode operation are calculated. The average delay of departures ranged from 4.8 to 13.9 min with a mean of 8.7 min.
Simulation results of LTBA for practical runway capacities

Simulation results of LTFJ for practical runway capacities

The simulation results of LTFJ for practical runway capacities are given in Table 29. The total practical capacity is around 108 movements for mixed-mode runway configurations. The calculated delays of departures in mixed mode operation at runway 06 and runway 05 are given in the table. The average delay for departures on runway 06 ranged from 1 to 14.9 min, with a mean delay of 8.7 min. In contrast, on runway 05, the average departure delay ranged from 3.7 to 12.5 min, with an identical mean delay of 8.7 min.
Practical runway capacity simulations for runway 34 and runway 35 at LTFM

LTFM simulation results are presented in Tables 30, 31 and 32. Accordingly, the total practical capacities of runways 34, 35, 36L, 36C and 36R in the current state of mixed operation mode are approximately 51, 52, 52, 49 and 49, respectively. It is foreseen that runway 09 will be allocated only for departures. If all category aircraft can perform operations on this runway, the capacity will be approximately 47. In this case, the total practical capacity of LTFM is 300. Practical runway capacity values obtained by considering these values are shared in Tables 33, 34 and 35 for the three airports.
Practical runway capacity simulations for runway 36L and runway 36C at LTFM

Practical runway capacity simulations for runway 36R and runway 09 at LTFM

The total practical capacity values of the airports for the scenarios formed to represent the past, current and future are shared in Table 36. According to the table, there is a 6.4
 $\%$
difference between ultimate capacity and practical capacity for LTBA. In case LTFJ has a single runway, the difference is 2.8
 $\%$
, while it has a double runway, the difference is 7.3
 $\%$
. For LTFM, this difference varies between 9.2
 $\%$
and 41.3
 $\%$
with an average of 25.3
 $\%$
for different scenarios.
Table 37 provides the practical capacity values obtained for the existing routes in the airspace. For LTBA and LTFJ, the difference between the practical runway capacities and airspace capacities is 40
 $\%$
and 31
 $\%$
, respectively, in the current situation. If LTFM is used in segregated mode (Scenario 2a), the difference is 13.5
 $\%$
. However, if all three runways are used in mixed mode as in Scenario 2b, the difference increases to 42.4
 $\%$
.
Practical runway capacities for LTBA

Practical runway capacities for LTFJ

Practical runway capacities for LTFM

Airport practical capacities for scenarios

Airspace practical capacities

8.0 Discussion and conclusion
Through the use of Monte Carlo simulation, we have determined the ultimate and practical capacities of the airport and surrounding airspace with different scenarios and compared them to identify any differences or limitations. In the simulation, a range of variables, including traffic mix, runway occupancy time, and traffic distribution at airspace entry points, were defined as randomised variables. Additionally, we considered the speed differences of different aircraft types along the common flight paths when calculating inter-arrival times of consecutive operations.
The study scenarios outline the anticipated alterations in airport capacities within the Istanbul metroplex over time. While Atatürk Airport is set to undergo a complete cessation of flights, new runways will be built for Sabiha Gökçen and Istanbul Airport. The distinct impacts of these modifications on total capacity are individually analysed. The overall capacity is expected to decrease by 20.5
 $\%$
due to the full closure of Atatürk Airport to flights. Introducing a second runway at Sabiha Gökçen is projected to nearly double the airport’s capacity, contributing to a 20.2
 $\%$
augmentation in the total capacity of Istanbul metroplex airports. Consequently, the decline in overall capacity resulting from the closure of Atatürk Airport is foreseen to be compensated by adding this new runway. The construction of three new runways at Istanbul Airport is anticipated to bring about an approximately 94
 $\%$
alteration in the airport’s capacity. The establishment of three new runways at Istanbul Airport is forecasted to raise the capacity by 93.7
 $\%$
, leading to a 55.8
 $\%$
surge in the total capacity of Istanbul metroplex airports.
When evaluating the capacity shares of airports in Istanbul, it is observed that Atatürk Airport has reduced its historical share from 65.3
 $\%$
to 20.5
 $\%$
in the present day. With the closure of Atatürk Airport in Scenarios 3 and 4, this share is expected to reach zero. Sabiha Gökçen Airport, on the other hand, had a share of 34.7
 $\%$
from the past to the present, but it has increased this share to 27.7
 $\%$
in Scenario 4. This indicates that Sabiha Gökçen Airport may play a more significant role in future air traffic. Istanbul Airport has consistently increased its share, starting from 56.8
 $\%$
, and it is expected to further raise it to 74.2
 $\%$
in Scenario 4. This highlights the growing impact of Istanbul Airport as the main hub in the region. These percentage shares assist us in understanding the role of airports in Istanbul’s overall aviation infrastructure and the changes in their roles over time.
In the study, the capacity changes of the airports in Istanbul Metroplex were examined by determining the past, present and future capacity values. When we compared the total runway and airspace capacities for current scenarios, it was observed that the airspace capacity was another bottleneck. The analysis suggests that the arrival routes of the three airports in the Istanbul metroplex can serve up to a certain ultimate number. Thus, it was concluded that it is important to handle both runway and airspace improvements together. There are ongoing Single European Sky ATM Research (SESAR) projects related to this conclusion, such as Airport Airside and Runway Throughput (AART – PJ.02) and Integrated TMA, Airport and Runway Operations/Optimised Airspace Users Operations (ITARO -PJ.37/OAUO PJ.07) [57].
The simulation also projected the future capacities of the runway and airspace with the addition of new facilities. The results suggest that the metroplex airspace will continue to face significant capacity challenges in the future, especially as demand for air travel continues to grow. The addition of new facilities will provide some relief, but it is clear that more comprehensive strategies considering airport and airspace operations together are needed to manage the increasing volume of air traffic in the region effectively.
One possible solution is to use of time-based separation. Thus, by considering the speed differences of the aircraft, safety separation is adjusted more accurately and significant improvements are provided in the delays. In our study, we considered the speed differences only along the common flight paths when calculating inter-arrival times. As a result, time-based separation can be used for both arrival and departure operations to increase capacity [57].
Reducing the radar separations might be considered as another improvement for the airspace capacity. By reducing the radar separation within the TMA, we can increase the capacity as more aircraft enter and exit the airspace. Currently, if the radar separation for Istanbul Airport is taken as 3 nm instead of 5 nm, the airspace capacity has been obtained by Monte Carlo simulation that it increased to 146. Thus, if all runways are used in mixed mode, as in Scenario 2b, the airspace capacity will cover the total number of arrivals (obtained as 144).
Improving air traffic control procedures, on the other hand, might increase both runway and airspace capacities. Implementing more efficient air traffic control procedures such as streamlining flight paths, optimising approach and departure patterns, and increasing the use of automation tools can help reduce delays and increase TMA capacity. In the Istanbul metroplex, LTFJ and LTFM have PMS. It has been observed that airports with this system have larger route capacities, especially LTFM with parallel PMS. The expansion of the scope of PMS within the airspace may be one of the solutions. PMS not only delivers a more efficient arrival route structure in the terminal airspace but it can be applied to the extended terminal airspace area for pre-sequencing traffic [58]. However, these are the situations that need to be simulated in detail and are the subject of another study.
The other solution is to introduce a collaborative decision-making (CDM) system that can optimise the flow of traffic across the metroplex airspace. Such a system would allow airport operators, airlines and air traffic control authorities to share data and coordinate their operations more efficiently. This would help to reduce delays, increase capacity and improve the overall safety of the airspace.
In conclusion, the results of this study provide valuable insights for stakeholders in the aviation industry to effectively manage air traffic in the metroplex airspace. With the use of Monte Carlo simulation, we have identified the factors that impact airport and airspace capacities and delays and provided recommendations for improving the capacity and reducing delays. By implementing these recommendations, the metroplex airspace can better meet the growing demand for air travel and support the economic growth of the region.
Acknowledgements
This research received no specific grant from any funding agency in public, commercial or non-profit sectors.