I. INTRODUCTION
Inspection of archaeological materials (e.g., metals, paints, claws, teeth, stones, bones, skins, etc.) is often an intricate task due to fabrication history, the composite chemical and structural alterations that are caused by the alloying, annealing, and working processes of production, as well as by post-manufactured conditions. For centuries, archaeologists have been seeking to use methods that can yield detailed quantitative and accurate interpretations about the prehistoric past. The analysis of archaeological objects necessitates investigators to address the problem, by knowing features like grain size (i.e., microstructure) and other measurable characteristics of the material sample. A natural question arises: Is it is possible to go backwards to obtain insight into the forming conditions or production processes to understand the processing history?Reference Ryzewski, Sheldon, Alcock, Mankin, Vasudevan and Sinnott-Armstrong1 Therefore, the principle motivations and applications of nanomechanical testing (nanoindentation) to archaeological materials would be understanding ancient manufacturing, storage, and usage processes by characterization of microstructure, and doing the above within small test volumes in small, rare, and/or potentially priceless samples. A potential to study aging also exists for the technique; however, these remain much less developed to date.
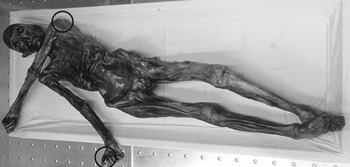
Nanoindentation (ISO 145772 and ASTM E2546-073) is a technique to accurately and precisely probe the mechanical properties of materials at high spatial resolution.Reference Oliver and Pharr4 The technique is applied widely in the areas of aerospace, energy, electronics, healthcare, and materials research, and deals with a range of materials like carbon fiber reinforced polymer, carbon materials, coatings and alloys, civil engineering and polymeric materials, organic feedstock materials in bioenergy area, and semiconductor materials like silicon to probe useful properties like hardness, modulus, fracture toughness, wear resistance, coefficient of friction, creep, viscoelasticity, and interfacial bond strength. It has precedence in historical contexts as well, being used recently, for example, to analyze dental wear mechanics in hadrosaurid dinosaur samples.Reference Erickson, Krick, Hamilton, Bourne, Norell, Lilleodden and Sawyer5 The importance of instrumented nanoindentation in the field of archaeometry stems from the fact that the microstructure and surface mechanical properties of materials can help archaeologists to determine the settings under which they were fabricated, used, and stored. So far, probably the most impactful example of putting nanoindentation to work in this field has been the study of mummification (shown in Fig. 1, indentation zone encircled),Reference Janko, Zink, Gigler, Heckl and Stark6 which has been applied to samples dating back 50 centuries.
Neolithic glacier mummy, the Iceman (reprinted with permission from Ref. Reference Janko, Zink, Gigler, Heckl and Stark6).

The methods and the degree of control available to ancient manufacturing processes can be examined by studying microstructure evolution, which is made accessible by high resolution testing. Furthermore, the sensitivity of nanoindentation to surface conditions can reveal clues about the contact history of samples otherwise invisible to macroscopic mechanical testing: Signatures of rubbing, scraping, crushing, cutting, and other abrasive or reforming processes can be revealed by shallow mechanical probing. From a completely different perspective, rare and priceless samples obtained from archaeological sites require minimally destructive testing methods. By probing volumes of dimension often less than the wavelength of light, nanoindentation comes close to being completely nondestructive. The data produced by nanoindentation complement data from other archaeometry methods; for example, the tandem use of multiple surface characterization techniques such as energy dispersive X-ray spectroscopy, electron backscatter diffraction, infrared spectroscopy, optical imaging, Raman spectroscopy, scanning electron microscopy, transmission electron microscopy, X-ray diffraction, X-ray fluorescence, etc. provides access to variables of archaeological material properties and performance that cannot be gathered from other analytical techniques or grain size analyses only. These supplementary characterization techniques provide a basis for interpreting nanoindentation results when they differ from one sample to the next by, for instance, establishing statistical correlations between elastic modulus and the underlying composition of a material. This is especially true when nanoindentation and a complimentary technique are collected at precisely matched sites. Overall, the ability of the nanoindentation technique to quantitatively characterize the mechanical properties of individual microstructures, phases, and constituents in bulk materials at the nanoscale has been critical for making revolutionary advances in materials characterization.
Archaeological samples are important sample sources to study phenomena such as aging, alloying, carbon dating, and other processing techniques from ancient human civilization and are therefore of technological intellectual curiosity. New areas of research are often useful to push forward innovative methods in materials characterization; the recent case of Raman spectroscopy applied to graphene being a prime example. One of the principal concerns for testing archaeological samples is preservation, placing a high value on minimally invasive or nondestructive techniques. The criterion for preservation includes not only structural integrity but also ensuring aesthetic quality for museum display etc. is not compromised. As a technique that probes sample volumes of a few cubic microns or less, well below unaided visual detection, nanoindentation offers a way to extract mechanical data while preserving specimens.
It is also the purpose of this review to show that this nanomechanical method can fill an important gap in experimental characterization of materials in archaeometry, whilst also using other methods to supplement the other aspects of this research field including techniques such as transmission electron and atomic force microscopy. Research in archaeometry incorporating nanoindentation methods is having growing interest. Examples in metals,Reference Ryzewski, Sheldon, Alcock, Mankin, Vasudevan and Sinnott-Armstrong1,Reference Northover, Northover and Wilson7–Reference Li, Wu, Liao, Liao, Zhang, Chen and Pan10 minerals,Reference Erickson, Krick, Hamilton, Bourne, Norell, Lilleodden and Sawyer5,Reference Chakoumakos, Oliver, Lumpkin and Ewing11,Reference Lerner, Du, Costopoulos and Ostoja-Starzewski12 enamels,Reference Sanson, Kerr and Gross13,Reference Riede and Wheeler14 claws,Reference Manning, Margetts, Johnson, Withers, Sellers, Falkingham, Mummery, Barrett and Raymont15 paints,Reference Salvant, Barthel and Menu16 bones,Reference Olesiak, Oyen, Sponheimer, Eberle and Ferguson17,Reference Olesiak, Sponheimer, Eberle, Oyen and Ferguson18 and skinsReference Janko, Zink, Gigler, Heckl and Stark6 are evident in the literature. However, a consolidated understanding on the origins and future pathways of how the technique may be used for samples being extracted from precious world heritage archaeological sites as well as the range of existing materials available in museums worldwide is currently missing. This motivates our review, which attempts to demonstrate the uptake of the instrumented nanoindentation technique and its utility in advancing the archaeometry materials research.
Application of nanoindentation technique by archaeologists is not very common, and therefore Sec. II presents a summary about contact mechanics, nanoindentation, and their measurements. Sec. III presents materials and surface preparation essential prior to carrying the tests, followed by main part of the review (based on material categories), highlighting various types of materials tested thus far and the variations that may be expected from the nanoindentation testing. Finally, we present a concluding section to bring a clearer message out of this review.
II. INDENTATION CONTACT MECHANICS AND MEASUREMENTS
A typical instrumented nanoindentation technique relies on pressing a known (typically diamond) probe or indenter of well-known geometry into the surface of the material under investigation and record the variation in the resulting forces as a function of displacement of the probe into the material. This then follows analyzing the force–displacement–time (P–h–t) plots recorded during the process.Reference Faisal, Ahmed and Reuben19,Reference Oliver and Pharr20 Instruments standardly supply sub-microNewton force and subnanometer displacement resolution with large dynamic range. On some occasions, microscopic examination of the impression “fingerprint” left by the indenter in the substrate is performed by atomic force microscopy, optical microscopy, or scanning probe microscopy upon its retraction. The nanoindentation method allows for very easy way in estimating the hardness by dividing the peak force on the probe by the projected contact area left by the indenter in the specimen upon full retraction.
Mechanics for elastic, viscoelastic, and elastic–plastic constitutive models have been proposed to describe indentation response (stress state and material accommodation) in a variety of materials.Reference Tabor21–Reference Fisher-Cripps24 For materials with elastic properties, the indentation impression vanishes after unloading cycle, whereas for material with plastic properties, permanent deformation appears around the indentation. For elastic–plastic ductile materials like many metals, analytical slip-line field models estimate the permanent deformation along available slip-lines based on yield stress criterion (Tresca or von-Mises),Reference Hill25 while complex materials require advanced constitutive models and numerical simulation. For plastic deformation in isotropic, ductile material, the standard indentation modelReference Mukhopadhyay and Paufler22,Reference Hill25,Reference Lawn and Wilshaw26 assumes that the material accommodates the indenter volume by an outwardly expanding hydrostatic core. This hydrostatic core provides symmetry of the stress field under the indenter which governs the development of concentric hemispherical plastic and elastic shells of deformation that surround the contact.Reference Lawn and Marshall27
It is well known that the mechanical response of viscoelastic materials depends on load magnitude and contact duration, where the indenter continues penetrating the specimen even under constant load. Under standard analysis, these phenomena can lead to errors in the determination of contact depth which appears as a decrease in apparent elastic modulus and hardness with time.Reference Oyen28 The parameters in a model for viscoelastic response are usually determined from the time course of indenter penetration under constant load.Reference Oyen28 However, the displacement will also be influenced by the initial period of load-increase. This can be considered by correction factors.
It is important to note that the depth-sensing capability of modern instrumented indentation was initially combinedReference Pethicai, Hutchings and Oliver29 with traditional indentation methodsReference Tabor21 because of the difficulty at small scales to precisely measure the hardness impression projected contact area upon unloading.Reference Pethicai, Hutchings and Oliver29 However, it was soon realized that this capability allowed for a simple means to simultaneously extract the elastic properties of the material,Reference Oliver and Pharr4 which accounts for much of the wide popularity of the technique today. The basic nanoindentation test simultaneously measures both elastic modulus and hardness of small-volume samples. For isotropic materials, the elastic modulus measured is a convolution of Poisson’s ratio (ν) and elastic modulus (E), the latter of which is often extracted by assuming a value for the former (most structural materials lie in the 0.3 to 0.4 Poisson ratio regime). The hardness (H) is a semi-intrinsic material property associated with the plastic tensile yield strength (σ) of the material by the empirical Tabor relation (H = Cσ), where the confinement parameter C ∼ 3 for metals and ceramics and C ∼ 1.5 for glassy polymeric matter.Reference Pethicai, Hutchings and Oliver29 A variety of indentation features and response can also be measured by considering the deviation of force–displacement loading profiles with that of a reference specimen at the same indentation depth or load.
The physical quantities measured from the load–displacement (P–h) curve relevant for mechanical property and residual stress measurement are the maximum load (P max), maximum indentation depth (h max), contact depth (h c), final indentation depth (h f), and contact area (A c).Reference Goel, Cross, Stukowski, Gamsjäger, Beake and Agrawal30 The Oliver–Pharr modelReference Oliver and Pharr4 is the most frequently used method to obtain various mechanical properties (e.g., hardness and elastic modulus) during nanoindentation. Traditionally, the reduced elastic modulus (E r) is derived by measuring the initial unloading contact stiffness (S) which is the slope of the first one-third linear part during unloading cycle of the P–h curve. We provide a few further key technical details here, for a complete description of nanoindentation procedures and theory (see e.g., Refs. Reference Fischer-Cripps31–Reference Johnson35). The mean indentation contact pressure or hardness, H, is calculated asReference Oliver and Pharr4,Reference Oliver and Pharr33
 $$H = {{{P_{\max }}} \over {{A_{\rm{c}}}}}\quad ,$$
where P max is the peak indentation force, A c is the contact area between the indenter and the surface of the material, which is a function of contact depth, h c, for example:
 $${A_{\rm{c}}} = \pi {a^2} = \pi {\left( {\tan \alpha } \right)^2}{h_{\rm{c}}}^2 = 24.5{h_{\rm{c}}}^2\quad ,$$
for an ideal conical indenter, where α is the half apex angle.
The contact depth is calculated asReference Oliver and Pharr4,Reference Oliver and Pharr33
 $${h_{\rm{c}}} = {h_{\max }} - \omega {{{P_{\max }}} \over S}\quad ,$$
where ω is a geometric parameter (1 for a flat punch indenter, 0.75 for Berkovich rounded indenter, and 0.72 for conical indenter). For individual indentation load–displacement, curves are plotted, and hardness and elastic modulus are calculated for each nanoindentation curve with the Oliver–Pharr (O–P) technique:
 $${1 \over {{E_{\rm{r}}}}} = {{1 - {\nu ^2}} \over E} + {{1 - \nu _{\rm{i}}^2} \over {{E_{\rm{i}}}}}\quad ,$$
where E i and νi are the elastic modulus and Poisson’s ratio of the diamond tip. Reduced modulus E r is calculated from the Sneddon equationReference Sneddon36
 $${E_{\rm{r}}} = \left( {{{\sqrt \pi } / 2}} \right) \cdot \left( {{S / {\sqrt A }}} \right),S = {{{\rm{d}}P} / {{\rm{d}}h\quad ,}}$$
where A is the projected area of elastic contact and S is the contact stiffness.
In modern instruments, one can also perform the continuous stiffness measurement during loading the specimen.Reference Pharr, Strader and Oliver37 A recent advance in nanoindentation is called 4D tomography, whereby the substrate is mapped over its volume (to a certain depth) at a very high indentation speed.38 Some of the uniquely required features of an ideal nanoindentation capabilityReference Goel, Cross, Stukowski, Gamsjäger, Beake and Agrawal30 should be low displacement resolution (0.02 nm), low noise levels (0.2 nm), high load testing capacity (∼50 mN), high load resolution (∼3 nN), indenter normal stiffness of about 80 N/m, and damping coefficient of about 0.05 Ns/m, with a typical indentation speed of one indent per 120 s.
III. NANOINDENTATION IN ARCHAEOMETRY MATERIAL ANALYSIS
A. Materials and surface preparation
Based on the sample features (soft or hard, hydrated or dehydrated, and porous or nonporous solid) and complexity associated with the compaction, deformation, strain-stiffening, or fracture mechanics during indentation, it is necessary to consider different sample preparation practices for an appropriate nanoindentation measurement.
Nanoindentation primarily measures the surface properties of localized small-volume samples. Results of nanoindentation tests can be highly influenced by the specimen preparation technique, particularly, if the material under investigation is hard, for example, bones (hydrated or dehydrated), as recently summarized by Jiroušek (2012),Reference Jiroušek39 Bushby et al. (2004),Reference Bushby, Ferguson and Boyde40 Granke et al. (2014),Reference Granke, Coulmier, Uppuganti, Gaddy, Does and Nyman41 and Bembey et al. (2006),Reference Bembey, Oyen, Bushby and Boyde42 and teeth, as summarized by Nalla et al. (2005)Reference Nalla, Balooch, Ager, Kruzic, Kinney and Ritchie43 and Angker and Swain (2006).Reference Angker and Swain44
Historically, flat surface preparation for nanoindentation of most of the engineering materials (e.g., metals, ceramics, and coatings thereof) has been commonly carried out through metallurgical precision cutting, mounting (cold/hot), grinding, and fine polishing processes. Apart from metals, the exemplar specimens investigated using nanoindentation includes analysis of range of archaeological material types, e.g., teeth, stones, paints, claws, bones, skins, etc. As flatness is the key assumption of most indentation analysis techniques, surface preparation can have a marked influence on the repeatability of the nanoindentation measurement results of such precious archaeological materials. In this case, other sample preparation techniques such as microtoming (cutting extremely thin slices of material) and cryomicrotoming developed for microscopy can be valuable. In all the cases, careful validation of sample flatness by optical, electron, scanned probe, or other high-resolution microscopies is critical.
The proper fixing of a sample is critical to minimize variation in nanoindentation measurements and can be particularly challenging for softer, biological tissue-like specimens. In addition, the hardness and elastic modulus can dependent on the water content for such samples, e.g., compact and trabecular bone where hydration conditions can result in up to 40% difference in measured indentation modulus.Reference Jiroušek39,Reference Bembey, Oyen, Bushby and Boyde42 In a well-described methodology by Bushby et al. (2004),Reference Bushby, Ferguson and Boyde40 preparation of bone samples involved inclusion of wet or dry bone in a noninfiltrating resin and polishing to a flat surface. It is noteworthy that it is difficult to obtain an adequate surface finish on wet bone while maintaining hydration and preventing interaction with the hydrating fluid and collecting high-quality nanoindentation data. Full dehydration of bone tissue results in marked shrinkage, increased stiffness and strength, and reduced toughness. However, bone embedded in polymethylmethacrylate could permit high resolution analysis in scanning electron microscopy and nanoindentation. As mentioned by Riede and Wheeler (2009),Reference Riede and Wheeler14 each of the molars inspected was tested on the buccal face, the occlusal tips, and in the buccal-to-lingual cross section taken midway between the tip and the gum-line. All test surfaces were prepared using the process (i.e., metallographically, samples were fixed to a lapping stub using polymer and then polished using a lapping fixture with sequentially finer alumina lapping films). Since nanoindentation testing can be a time-consuming process, in normal practice, the samples are tested in dry conditions to evaluate the properties of biological materials (e.g., bones, skins). Because the nanomechanical tests with a large set of different test constraints take longer times, it would be very tough to preserve or sustain the test conditions during the experiments (e.g., moisture in biological materials). For all these reasons, biological specimens to be tested are normally dried in stable conditions prior to the experiments, as it has been revealed through numerous investigations that the stiffness is generally complex (higher) than the stiffness of the bone samples tested under wet conditions.Reference Jiroušek39,Reference Bembey, Oyen, Bushby and Boyde42
In an example of sample preparation for indentation of skin, Janko et al. (2010)Reference Janko, Zink, Gigler, Heckl and Stark6 obtained histological specimens and 2–4 µm thick transverse (crosswise) sections were cut and transferred onto transparent slides. To prepare the histological sections, new skin samples were exposed to the same procedures as the mummified tissue. As a reference, Janko et al. (2010)Reference Janko, Zink, Gigler, Heckl and Stark6 used an analogous recent human skin sample that was taken from a volunteer for indentation analysis. Jiroušek (2012)Reference Jiroušek39 have highlighted the work of Dudíková et al. (2011)Reference Dudíková, Kytýr, Doktor and Jiroušek45 relating optimization of the sample preparation process, where the effects of the grain size, load, and duration time of polishing on surface unevenness were analyzed using laser scanning microscopy (e.g., confocal type). There is other research on modern skin samples by Bhushan and Tang (2010)Reference Bhushan, Tang and Ge46 where the samples were mounted on the AFM and the nanoindenter sample pucks with a rapid drying glue, a method which is generally not implemented across all material types. In a work by Crichton et al. (2013),Reference Crichton, Chen, Huang and Kendall47 the skin sample was mounted onto a stainless-steel stage with double-sided tape, and filter paper soaked in saline was placed in contact with the excision surface to ensure that the tissue did not dehydrate (possibly to maintain structural integrity of the sample to an extent) from these surfaces during experimentation.
B. Measurement and characterization
1. Metals
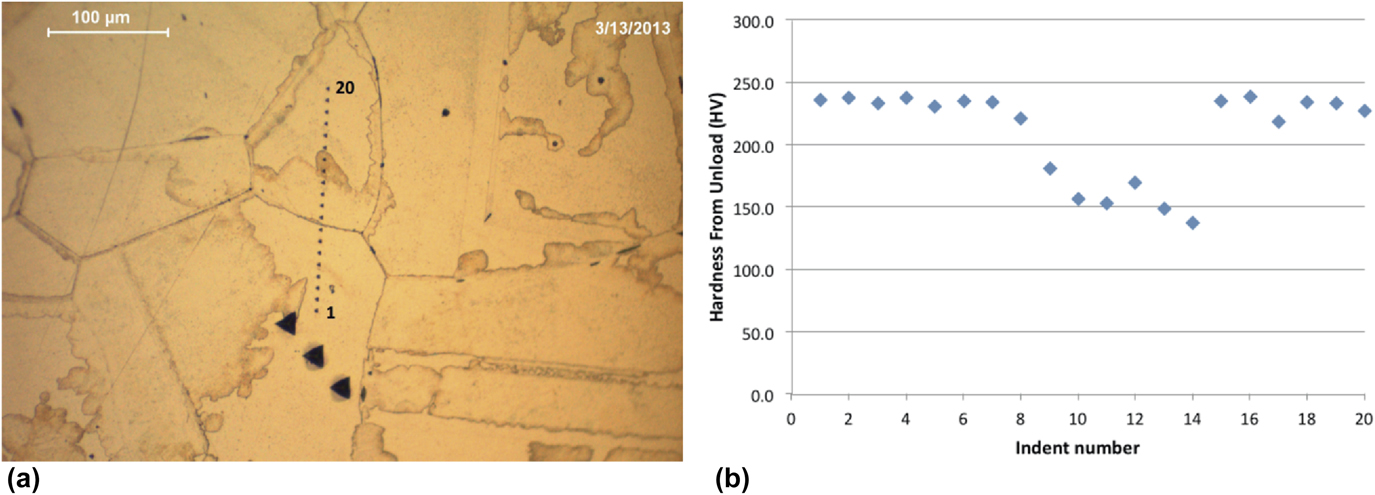
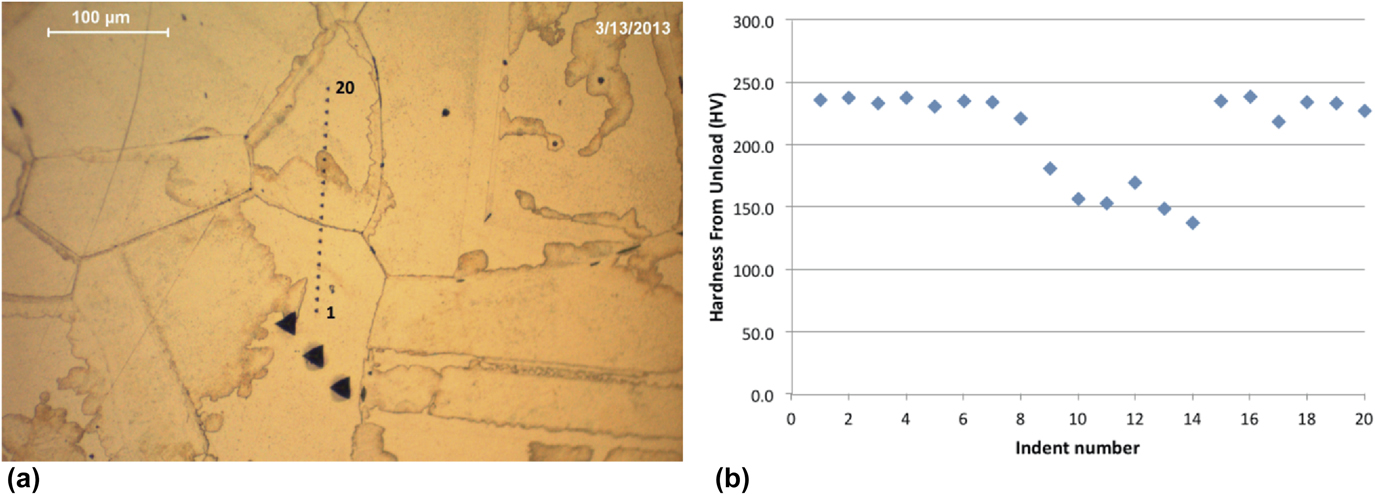
The extant literature provides examples of ancient metals that have been analyzed using nanoindentation techniques. Changes within the structure of the metal could be identified which would identify microstructurally age-related modifications, to help determine the tempering processes involved, the type of original material used, and the composition of the metal.Reference Northover, Northover and Wilson7,Reference Kochmann, Reibold, Goldberg, Hauffe, Levin, Eyer, Stephan, Müller, Belger and Paufler9 For example, nanoindentation investigation has been done by Northover et al. (2013)Reference Northover, Northover and Wilson7 on eutectic Ag–Cu alloys from archaeological and historical contexts to examine the hardness dissimilarity in the transformed region. As suggested, this has been of curiosity since age-related variations at grain boundaries were first proposed as an indicator of antiquity and authenticity. A second strand of interest proposed by Northover et al. (2013)Reference Northover, Northover and Wilson7 has been the embrittlement of archaeological silver by isolation of impurities to grain boundaries. To understand the microstructures of archaeological silver, the important interrogation is how to differentiate between the respective contributions of manufacture, age, and environment. The eutectic Ag–Cu system can display a variety of precipitate morphologies and these can be characterized using nanoindentation. The hardness results given by Northover et al. (2013)Reference Northover, Northover and Wilson7 are those measured during unloading. Figure 2(a) shows a line of indentations made across a transformed region and into an untransformed region on each side. The hardness plot [Fig. 2(b)] shows a modification in hardness across the altered region, which suggests a steady change in the coarseness of precipitation.
(a) Nanoindentation in Sterling silver homogenized for 2 h at 760 °C, then annealed for 1 h at 350 °C and (b) hardness values for transformed and untransformed regions of homogenized and annealed Sterling silver (reprinted with authors’ permission from Ref. Reference Northover, Northover and Wilson7).
In an investigation by Patzke et al. (2008)Reference Patzke, Levin, Shakhverdova, Reibold, Kochmann, Paufler and Meyer8 and Reibold et al. (2006)Reference Reibold, Paufler, Levin, Kochmann, Pätzke and Meyer48 on how Damascene blades (showing unexpected mechanical and optical features) were manufactured following secret recipes, there were signs that impurities and alternative thermomechanical treatments might have an influence on the typical Damask pattern (a weaving style or technique that originated in the early Middle Ages near Damascus, Syria). Using nanoindentation measurements, they could analyze specimens of two genuine Damascus sabres. New details of the microstructure (e.g., nanowires of cementite Fe3C and carbon nanotubes) were revealed by them in their study. Based on these results, they speculated that there is a link between transition metal impurities, hydrocarbons, nanotubes, nanowires, and cementite patterns. Furthermore, the presence of cementite nanowires must have consequences for the mechanical properties.
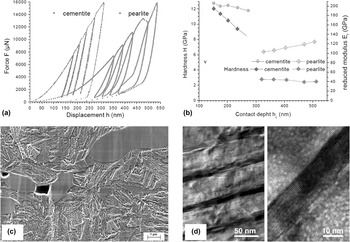
As discussed by Kochmann et al. (2004)Reference Kochmann, Reibold, Goldberg, Hauffe, Levin, Eyer, Stephan, Müller, Belger and Paufler9 and shown in Fig. 3, the legendary Damascus contains a high density of cementite nanowires and a network of dislocations and this could trigger the nucleation of pearlite. The hardness for cementite and pearlite showed stark changes in the inelastic behavior of those phases. The indentation in cementite grains were characterized by higher bound Meyer hardness (12 GPa at maximum) and no hysteresis, whereas the indentation on the matrix showed lower bound hardness (2.5 GPa) and significant hysteresis resembling a phase transition [Fig. 3(a)].
Nanoindentation of cementite and pearlite (Damascus steel): (a) loading P–h curves for cementite and pearlite, (b) hardness and reduced elastic modulus plotted versus the penetration depth, showing indentation size effect, (c) microstructure of a 17th century Damascus sabre shows large cementite grains embedded in a fine grained pearlitic matrix and voids, and (d) detection of nanowires in Damascus steel, where the dark stripes indicate nanowires (reprinted with permission from Ref. Reference Kochmann, Reibold, Goldberg, Hauffe, Levin, Eyer, Stephan, Müller, Belger and Paufler9, Publisher: Elsevier).

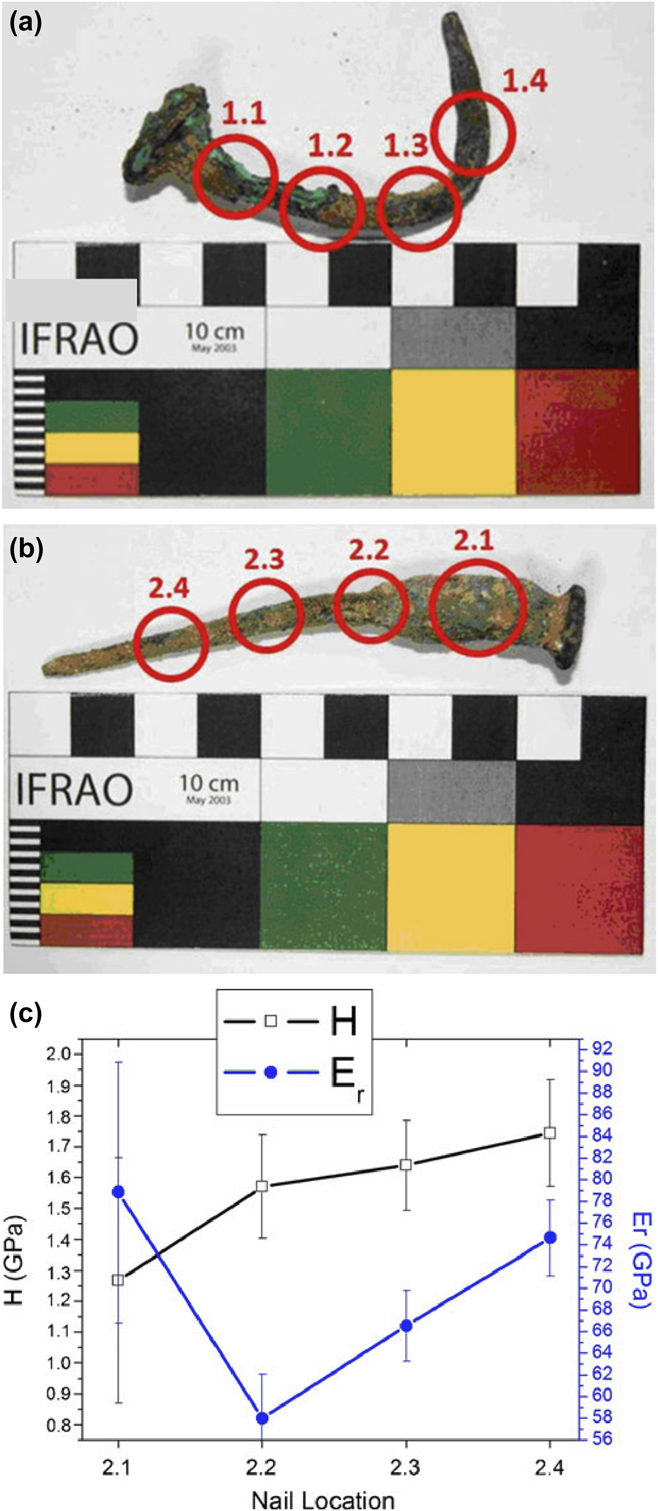
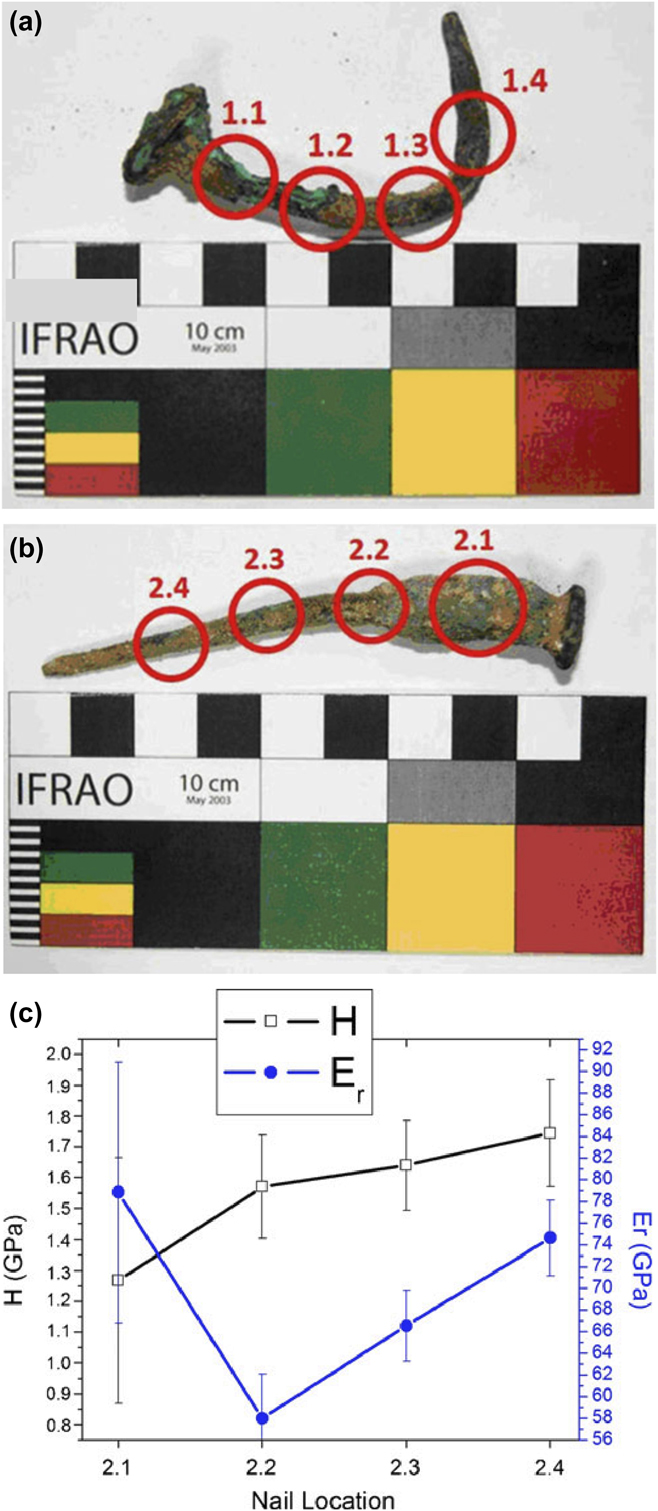
As shown in Fig. 4, Ryzewski et al. (2011)Reference Ryzewski, Sheldon, Alcock, Mankin, Vasudevan and Sinnott-Armstrong1 studied two nail artifacts made of Cu alloy dug from the Great Temple complex of Petra, Jordan, to establish how the usage of nanoindentation can have the potential to find properties about archaeological metals. Their study highlighted the value of using other techniques, including nanoindentation, as a means of determining the uncertainties that tend to arise from understandings of single-sited measurements on objects and from single-instrumental analyses during studies of production processes and their performance. They suggested that a higher bound hardness might be caused by strain hardening giving high dislocation densities or by compositional effects that decrease dislocation mobility.
Nail artifacts made of Cu alloy excavated from the Great Temple complex of Petra (in Jordan): (a and b) Nails 1 and 2, where cross section locations are encircled, and (c) summary of the hardness and reduced modulus along the length of nail 2 (reprinted with permission from Ref. Reference Ryzewski, Sheldon, Alcock, Mankin, Vasudevan and Sinnott-Armstrong1, Publisher: Springer Nature).
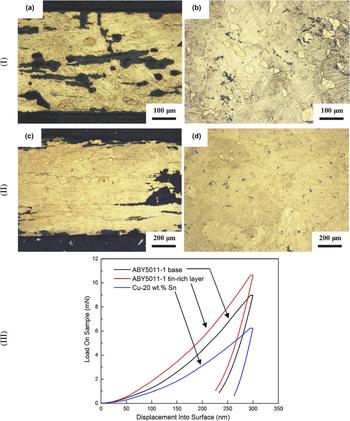
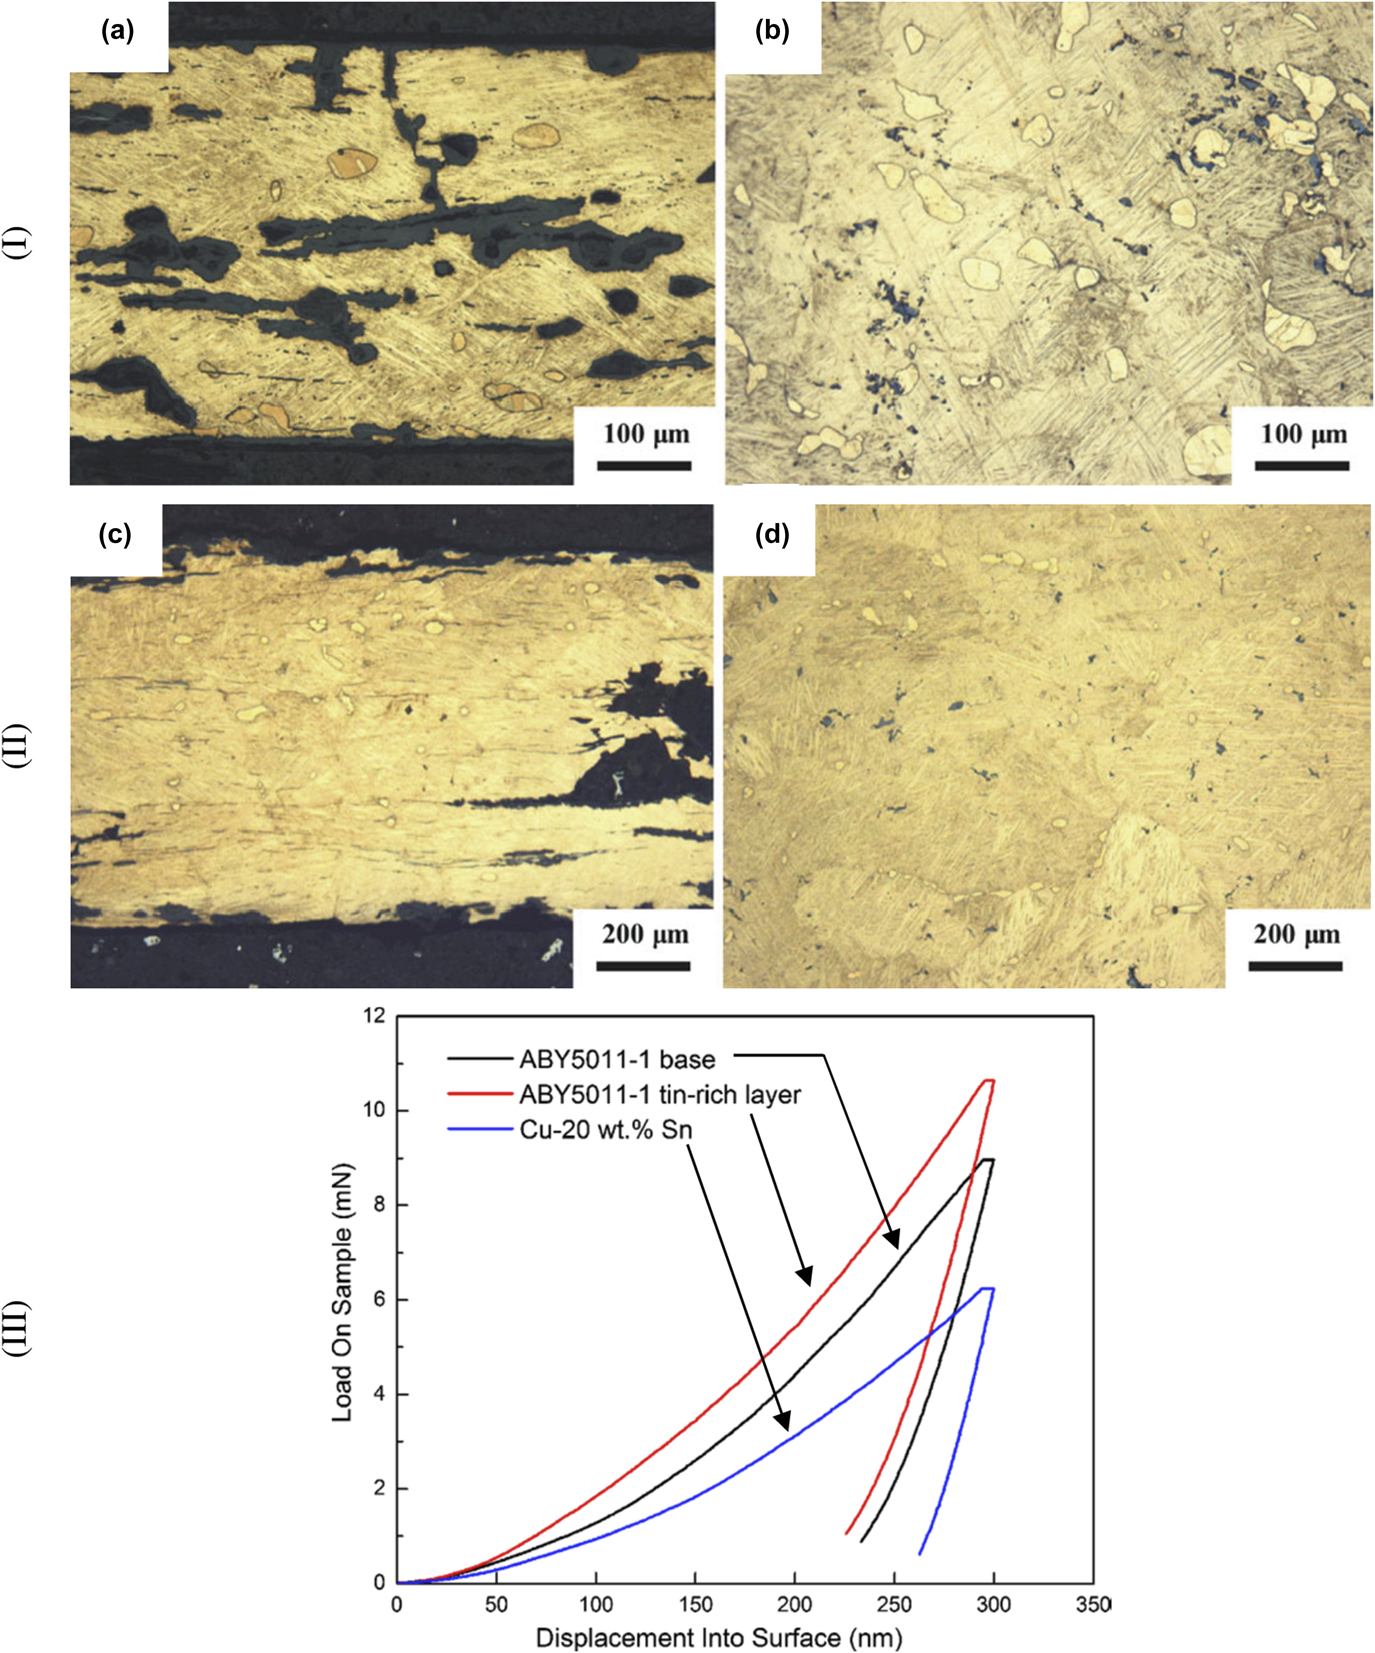
The work of Li et al. (2013),Reference Li, Wu, Liao, Liao, Zhang, Chen and Pan10 shown in Fig. 5, has two ancient thin-walled bronze vessels unearthed from Anlu County of Hubei Province, China, which were investigated by nanoindentation measurements. The study elucidated and calculated the diffusion of Sn into a Cu specimen based upon the high temperature substitutional mechanism. However, nanoindentation measurements show that the hardness of the vessels was 4.85 GPa and 5.24 GPa, respectively (these data were higher than the hardness 2.78 GPa of the simulated as-cast Cu–24 wt% Sn alloy). The results suggested that the vessels were probably made-up using the protocol: (i) alloying the high-tin Cu–Sn bronze; (ii) casting the shape of the vessels; (iii) forging the vessels at appropriate high temperature; (iv) wiping tinning on the surface of the vessel at high temperature; (v) quenching the vessels to room temperature; and (vi) grinding or polishing the surface of the vessels. They also suggested that the thin-walled bronze vessels provided an indication of the spread of thin-walled high-tin bronze technology in China.
Thin walled bronze vessels unearthed in Anlu County of Hubei Province (China): (I) optical microstructures of the sample ABY5011-1, where (a) cross section; (b) longitudinal section, (II) optical microstructures of the sample ABY5011-2, where (c) cross section; (d) longitudinal section, and (III) P–h curves of different zones in the sample ABY5011-1 and simulated as-cast Cu–24 wt% Sn sample (reprinted with permission from Ref. Reference Li, Wu, Liao, Liao, Zhang, Chen and Pan10, Publisher: Springer Nature).
Based on above investigations in metals of archaeological importance, it can be concluded that nanoindentation technique can be used to identify microstructurally age-related modifications. However, further work to estimate other properties of materials can be understood based on improved understanding of the nanoindentation,Reference Faisal, Ahmed and Reuben19 possibly leading to clear differentiation between the respective contributions of manufacture, age, and environment. It is also expected that the application of nanoindentation technique to archaeological metal specimens will enable characterization of crystalline phases existing within the alloy (e.g., Ag–Cu alloys, Fe3C, Cu alloys, bronze, etc, mentioned above) to develop empirical models of materials by incorporating properties of different phases, to obtain further insight into the forming conditions or production processes in the past.
2. Stones
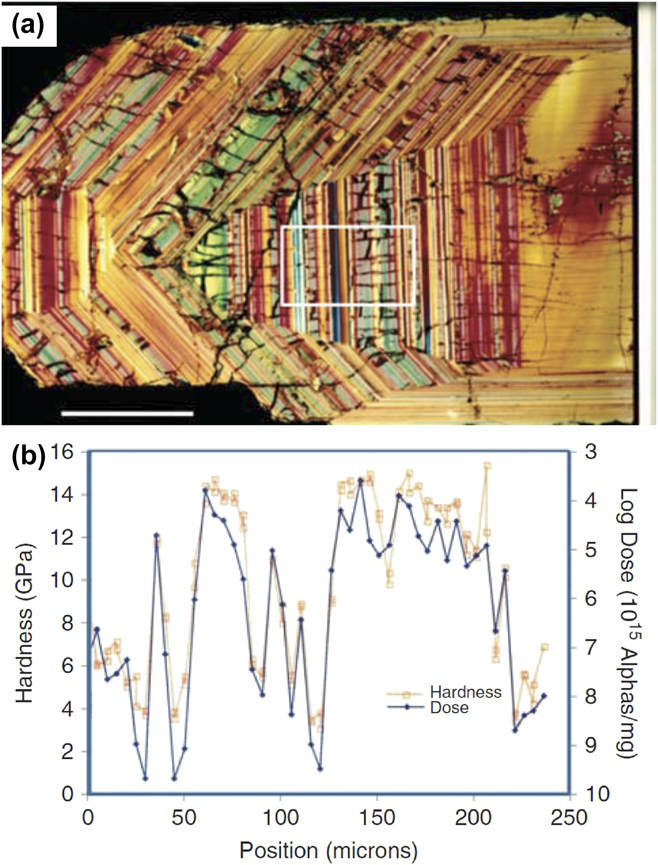
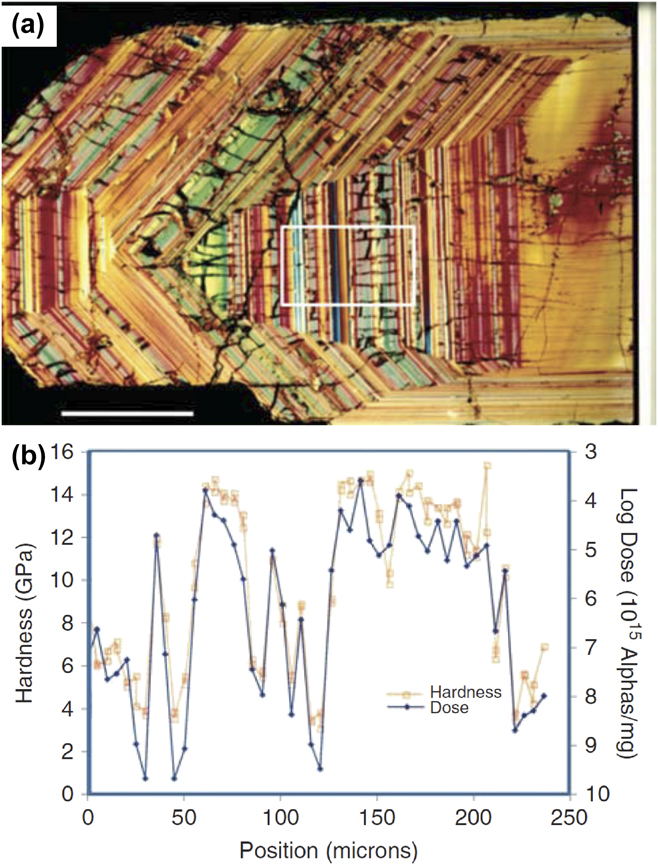
The zircon stone contains trace levels of the radioactive elements uranium (U) and thorium (Th) that over the long period can cause some regions in the specimen to transform from crystalline to amorphous during the radioactive decay process. Oliver and Pharr (2010)Reference Oliver and Pharr20 investigated a 570 million-year-old zircon stone (a layered structure) found in Sri Lanka [shown in Fig. 6(a)] using the nanoindentation method, to study the radiation damage involving high-dose and short-term experiments. The sample slice taken was 30 µm thick, with radioactive trace levels of U and Th incorporated into the crystal. It was observed that the level of such radioactive elements resulted in a radiation dose very near that required to trigger an amorphization process in such materials. Some of the layers (not cracked ones) were completely amorphous, but the cracked regions were still crystalline. Their suggestion was that the cracks appear because the amorphization process involves about a 17% decrease in density, so its expansion causes the adjacent crystalline material to crack. Oliver and Pharr (2010)Reference Oliver and Pharr20 were interested in analyzing whether the relationship between the long-term radiation dose level and the mechanical properties is the same as they see in short-term, high-dose experiments. Figure 6(b) shows electron beam-based microprobe data measuring the Th and U concentrations. They found a good correlation between the mechanical properties of the material and the level of impairment. It can be observed that high doses result in low hardness, and therefore, the amorphous material can have noticeably different properties.
Nanoindentation studies of a 570 million-year-old zircon stone found in Sri Lanka: (a) a photomicrograph of the layered structure of the stone and (b) plot of hardness and alpha particle radioactive decay dose as a function of position across the layers outlined by the white box in the photomicrograph (reprinted with permission from Ref. Reference Oliver and Pharr20, Publisher: Cambridge University Press).
The use-wear on prehistoric stone tools can be used to study human conduct as represented in the archaeological record. To facilitate this, Lerner et al. (2007),Reference Lerner, Du, Costopoulos and Ostoja-Starzewski12 investigated the nanoindentation behavior of stone tool raw material to appreciate the development of wear during use. They studied samples of San Juan Fossiliferous Chert with a mean hardness of 12.08 GPa, Brushy Basin Chert with 8.83 GPa, Yellow Silicified Wood with 11.02 GPa, and Morrison Undifferentiated Gray Chert with 9.08 GPa, and all materials from the American Southwest, often found on Archaic sites in the Four Corners area. Material hardness changes in archaeological wear trace regions were used for interpretation.
Current understanding of brittle material accommodation during the indentation process indicates that the wear behavior is influenced by the variation in contact stress fields during indentation cycle (loading, holding, unloading) caused by the microstructural transformations, changes in the residual stress fields, and influence of grain size.Reference Faisal, Ahmed and Reuben19 Based on above limited investigations in stone-related materials, it can be concluded that nanoindentation technique can be used to develop empirical wear models, leading to correlation between the mechanical properties of the material and age-related modifications. It is also expected that indentation technique can be used to quantify the fracture toughness of brittle stone materials, to obtain insight into the fragility of materials, which may assist in planning appropriate preservation or handling of such materials.
3. Enamels
It has been hypothesized that wear of enamel is sensitive to the presence of sharp particulates in oral fluids and masticated foods, and in the animal kingdom, wear can occur to an extent depending on the food source.Reference Borrero-Lopez, Pajares, Constantino and Lawn49 Surface observations of worn surfaces can reveal insight into wear micromechanisms but are often obscured by debris and surface smearing, so that interpretations remain controversial.Reference Ungar and Sponheimer50 The prediction of wear rates for different tooth forms under certain chewing conditions is of interest to evolutionary biologists. A principal concern is how the wear rate is influenced by diet.Reference Lawn and Cook51 Therefore, Sanson et al. (2007)Reference Sanson, Kerr and Gross13 considered nanoindentation testing of phytoliths, signifying that silica (opal) phytoliths cause dental enamel microwear in sheep mammals. They tested silica phytoliths from four globally widespread species of grass (Poaceae), the pasture grasses Paspalum dilatatum and Setaria viridis (both subfamily Panicoideae, tribe Paniceae), and Phragmites australis and Arundo donax (both subfamily Arundinoideae, tribe Arundineae). The nanohardness results indicate that silica phytoliths (considerably softer) do not contribute as much to mammalian dental (harder) microwear as earlier reported and that exogenous grit and dust are a more likely cause. They also suggested that this premise could have implications for understandings of the causal agents of microwear phenomena in areas such as the evolution of high-crowned teeth in grazing mammals during the Miocene.
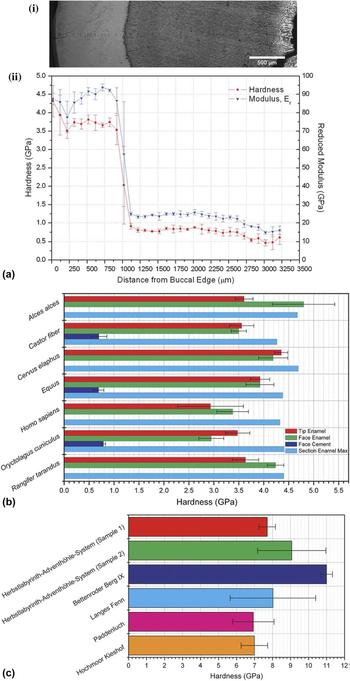
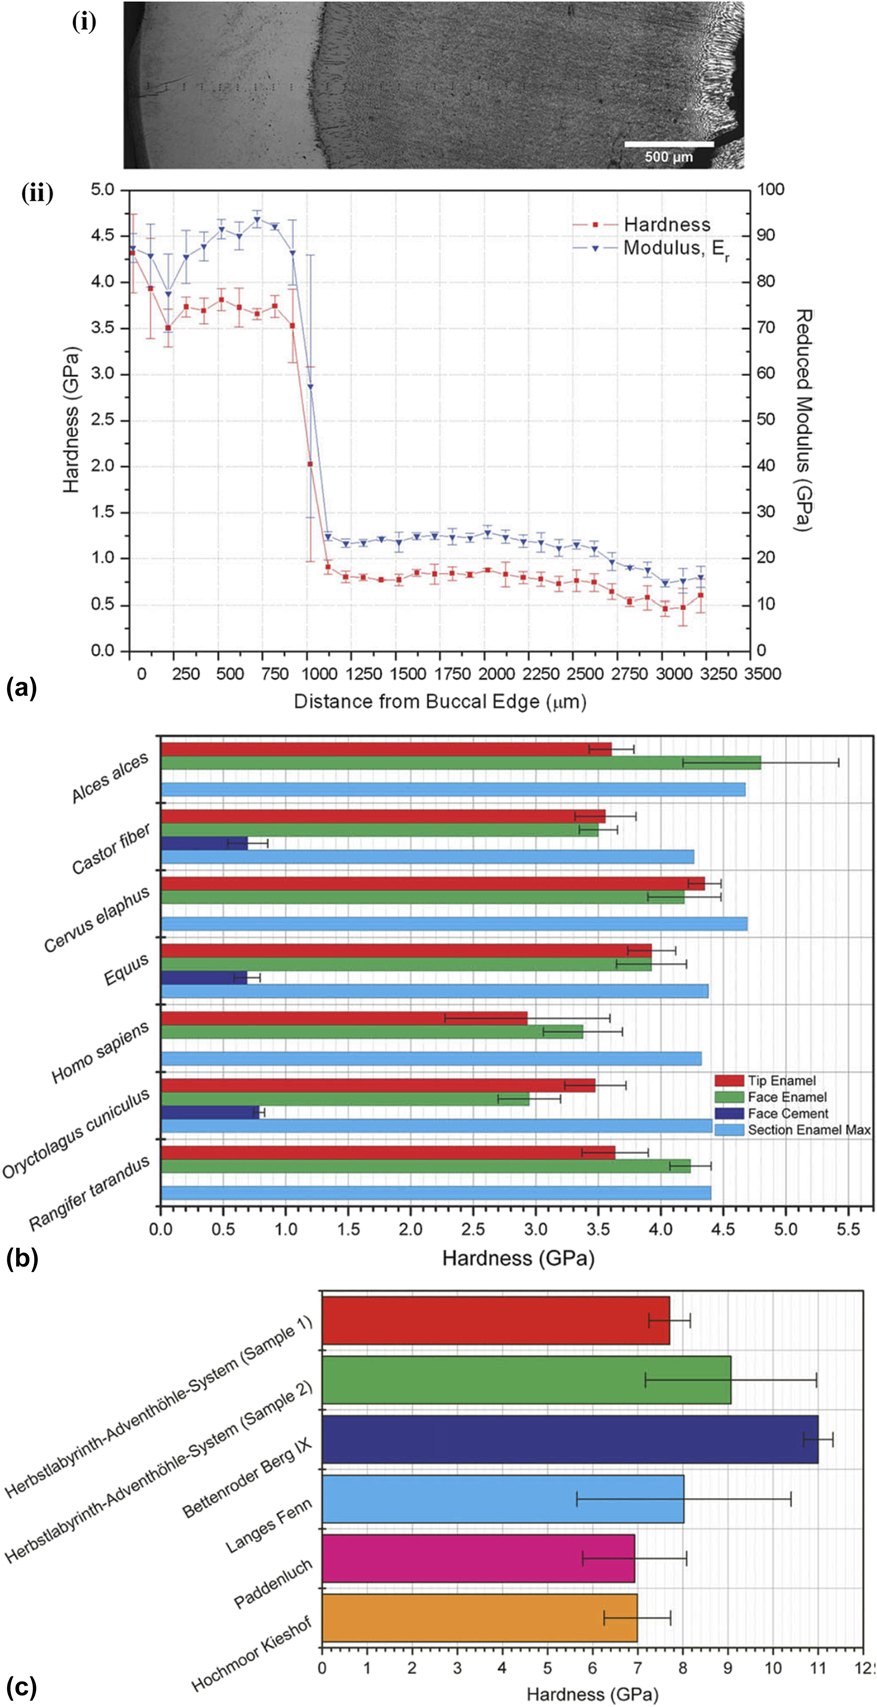
Riede and Wheeler (2009)Reference Riede and Wheeler14 investigated middle-range link between the Laacher See eruption and Late Glacial fauna and foragers: tephra (or rock fragments ejected during volcanic eruption) as dental abrasive and used nanoindentation to investigate tephra from several sites covering the medial and distal fall-out zones as well as the dental enamel of Homo sapiens and key prey species of Late Glacial foragers. As observed (Fig. 7), the Laacher See tephra contained particles twice as hard as even the hardest portions of any of the teeth examined. They suggested that fluoride-induced weakening of dental enamel may have further aggravated tooth wear. Aggravated tooth wear mechanisms may have been the reason of animal mortality, leading to an abandonment of the affected sites.
Nanoindentation on enamels: (a) (i) optical micrograph of buccal-to-lingual cross section of M2 from Cervus elaphus with indents visible and (ii) nanoindentation results for the cross section as a function of distance from the buccal edge, (b) hardness values for different areas within the molars from different species, and (c) hardness of top 20% of tephra particles for each sample group (reprinted with permission from Ref. Reference Riede and Wheeler14).
Apart from above specific examples where nanoindentation has been applied in enamel-related archaeometry materials, it is important to note that there is extensive literature, e.g., by Borrero-Lopez et al. (2014)Reference Borrero-Lopez, Pajares, Constantino and Lawn49 and Lawn et al. (2012)Reference Lawn and Cook51 which addresses general dental wear using the basic mechanics to obtain some generic wear rate of both anthropological and archaeological samples. Their findings suggest that the wear of tooth enamel is representative of wear in brittle solids. Based on the assumption that the wear can be assumed to be time integral of several elastoplastic micro-asperity events, they discovered the wear rate to be in strong correlation with Archard’s law, which is a model used to describe sliding wear based on the theory of asperity contact.Reference Borrero-Lopez, Pajares, Constantino and Lawn49 Based on the above limited investigations in enamel-related materials, it can be concluded that nanoindentation technique can be used to develop empirical wear models, leading to development of mechanical properties correlation.
4. Claws
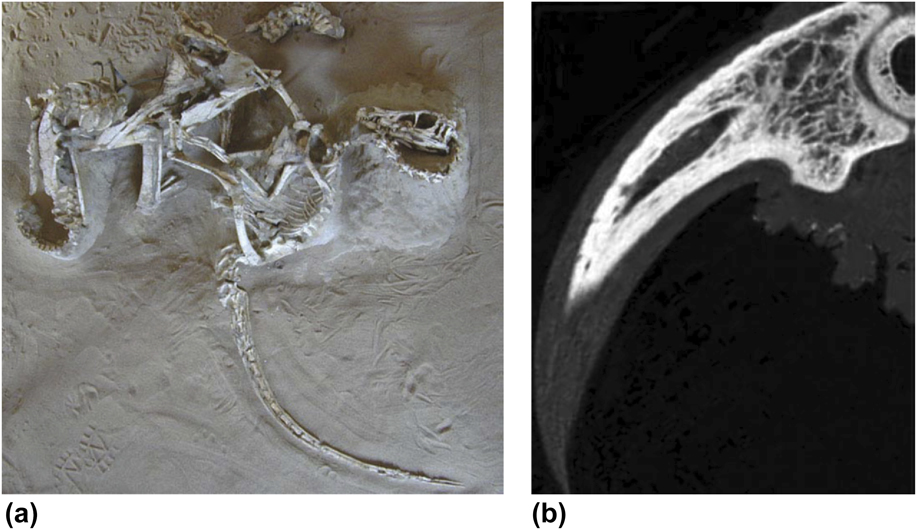
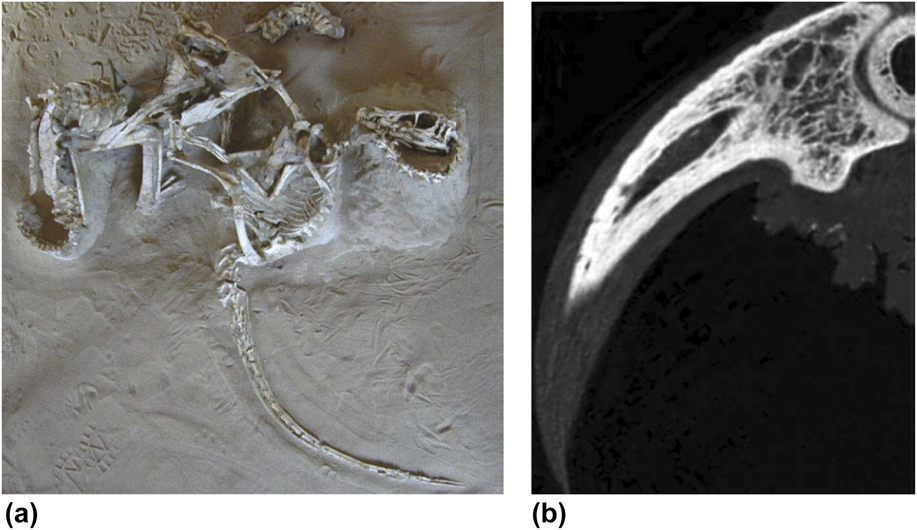
Claws reflect the natural history (e.g., feeding habits or locomotion) of mammals and birds. The claw geometry correlates well with arboreal and terrestrial habitats. It is likely that claws microstructure and mechanical properties would change over time, and properties of these types of materials would not always reflect their original functions. Dromaeosaurid theropod claw samples, such as Velociraptor [one of the dinosaur genera, Fig. 8(a)], possess strongly recurved, hypertrophied, and hyperextensible ungual (or nail) claws on the pes (or foot) (digit II) and manus (or hand). The microstructure of such unguals has been related to the feeding habits or capture and release of the prey. However, the mechanical properties of these structures have not been much explored. In an example, Manning et al. (2009)Reference Manning, Margetts, Johnson, Withers, Sellers, Falkingham, Mummery, Barrett and Raymont15 used the nanoindentation method while investigating the mechanical properties of the keratin layer and cortical bone of the eagle owl claw [Fig. 8(b)]. However, it is important to note that reliable indentation properties could not be obtained for such bones due to its highly porosity. Differences in density and microstructure, when coupled with the anisotropic properties of bone (trabecular and cortical) and keratin, leads to a complex structure which is cumbersome to the model. In the work by Manning et al. (2009),Reference Manning, Margetts, Johnson, Withers, Sellers, Falkingham, Mummery, Barrett and Raymont15 the measured elastic modulus values (6.8 ± 1.5 GPa for keratin layer, 21.1 ± 2.3 GPa for cortical bone, 19 GPa for trabecular bone) were used for subsequent finite element (FE) model to analyze the compression behavior of such samples. The FE model confirmed that dromaeosaurid claws could have well-adapted for climbing. However, it was suggested that the strength of the unguals (or nails) was limited with respect to forces acting tangential to the long-axis of claw. It is important to know that greater climbing capabilities of dromaeosaurid dinosaurs supports a scansorial phase in the evolution of flight; however, further research is required to clearly evaluate the change in claw microstructures and mechanical properties over time.
Dromaeosaurid theropod dinosaur sample: (a) the ‘fighting pair’ Velociraptor and Protoceratops and (b) high-resolution X-ray CT of owl terminal ungual phalanx and pedal claw (bone core and keratin sheath), where bone is white, keratin, and soft-tissue are grey (reprinted with permission from Ref. Reference Manning, Margetts, Johnson, Withers, Sellers, Falkingham, Mummery, Barrett and Raymont15, Publisher: John Wiley and Sons).
5. Paints
Ancient painting can be partly related to exerting influence upon expressions relied primarily on depiction subjects. Different layers of paint materials can be investigated using nanomechanical testing procedure, primarily for compositional analysis and understanding the aging process. There are very few literature studies related to the application of nanoindentation technique to investigate mechanical properties of ancient paints.
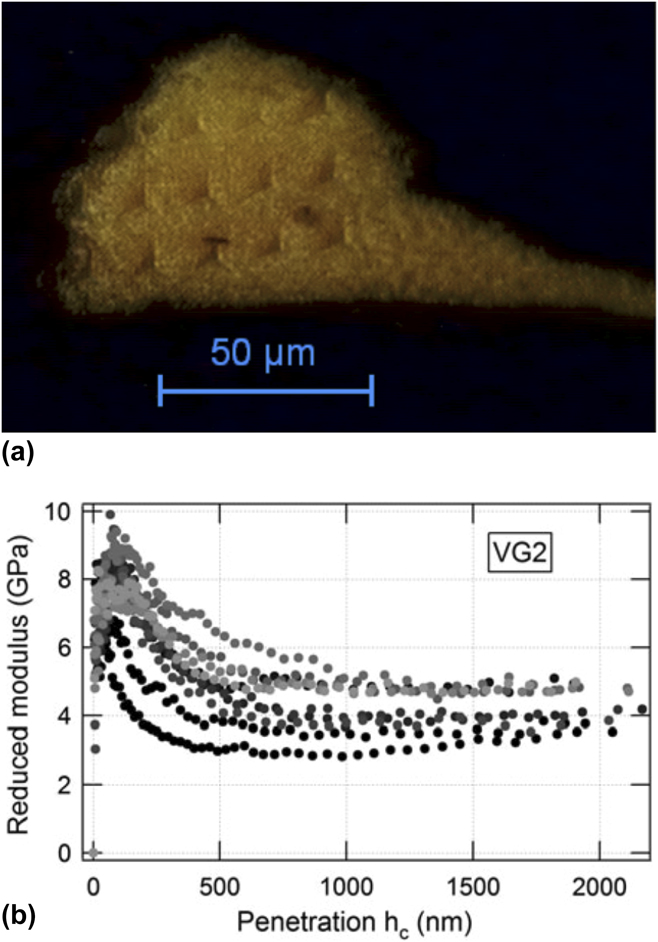
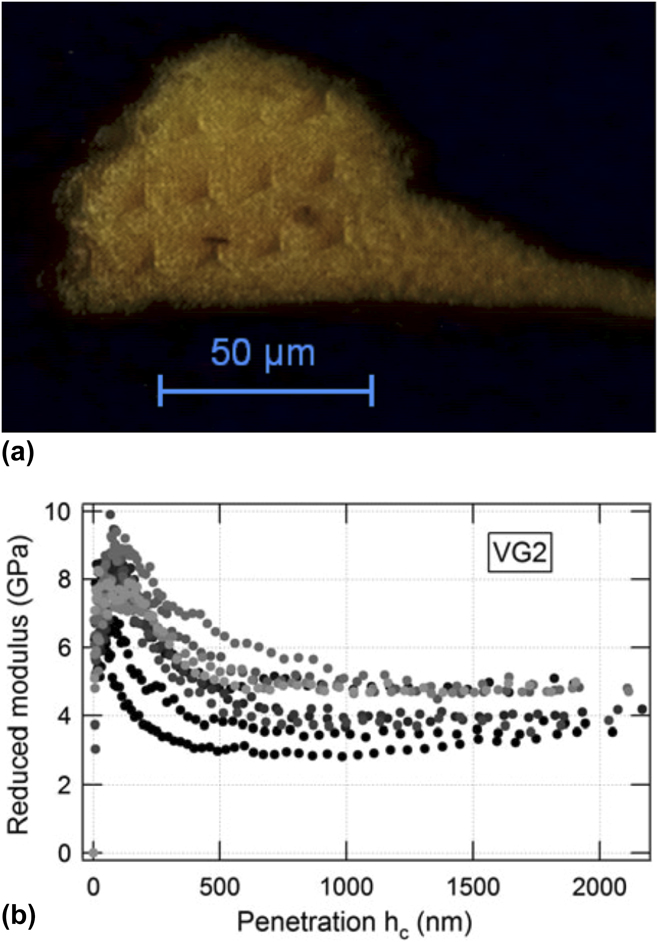
In an example on ancient paints, Salvant et al. (2011)Reference Salvant, Barthel and Menu16 investigated nanoindentation properties (shown in Fig. 9) which can be important for conservation and restoration purpose. One approach was to measure the mechanical properties of reconstructed paints: though, the aging process was poorly known, so it was also desirable to measure micromechanical properties directly on ancient paint specimens. Salvant et al. (2011)Reference Salvant, Barthel and Menu16 characterized small specimens recovered from restoration of two Van Gogh paintings and compared the results with reconstructed paint samples, where it was demonstrated that the reduced elastic modulus and hardness of such paints can be measured at a very local scale (potentially differentiating between each paint layer). The reconstructed paint specimens exhibit elastic moduli comparable to literature values, but the measured values on the two 19th century paint specimens were found to be larger. Similarly, the compositional dependence of the elastic modulus was found to be consistent with literature results for reconstructed specimens while the preliminary results for ancient specimens do not fall into the similar form. It is important to note that these analyses point to a significant impact of long-term aging. In this context, Salvant et al. (2011)Reference Salvant, Barthel and Menu16 concluded that nanoindentation measurement could offer an opportunity of investigating the influence of various parameters on a large range of naturally aged specimens for better understanding of the mechanical behavior of oil paints and their aging.
(a) Optical microscopy image of sample Van Gogh paintings (sample: VG2) after nanoindentation measurements and (b) reduced elastic modulus as a function of penetration for ten measurements on sample VG2 (reprinted with permission from Ref. Reference Salvant, Barthel and Menu16, Publisher: Springer Nature).
Some appropriate information related to measurement (e.g., as summarized in Sec. II) provided by nanoindentation measurement could also offer the opportunity to categorize materials similar in reduced modulus and hardness to the original paint material if paint loss should be restored. For example, in modern paints, it has been demonstrated that the relationship between crosslink density in the paint matrix and mechanical (ductility) properties can be correlated with scratch resistance.Reference Lange, Luisier, Schedin, Ekstrand and Hult52 However, such correlation can be difficult to establish in pigmented paint coatings as dislodgement of pigments during scratch tests can lead to accelerated wear. Therefore, localized nanoindentation testing can yield information on paint properties without causing the dislodgement of pigments; however, time-dependent indentation response (creep), leading to steeper and even negative unloading slopes and hence inaccurate mechanical properties.Reference Wai53
6. Bones
Bone is a heterogeneous material containing three main phases: mineral, collagen, and water, arranged in a series of hierarchical structures.Reference Bushby, Ferguson and Boyde40 Collagen contributes to bone’s elastic and viscoelastic behavior while mineral stiffens the overall material, whereas water contributes to elasticity and ductility. In modern times, scientific study of the structure of bones is called as osteology. Various factors such as age, death, sex, growth, and development can be analyzed with the identification of bone or its remains. Nanoindentation technique can be applied on bone skeletal remains to investigate mechanical properties to reconstruct the past, understand human variation, and provide information about the deceased individuals, or potentially identifying some pathological (study of disease) conditions.
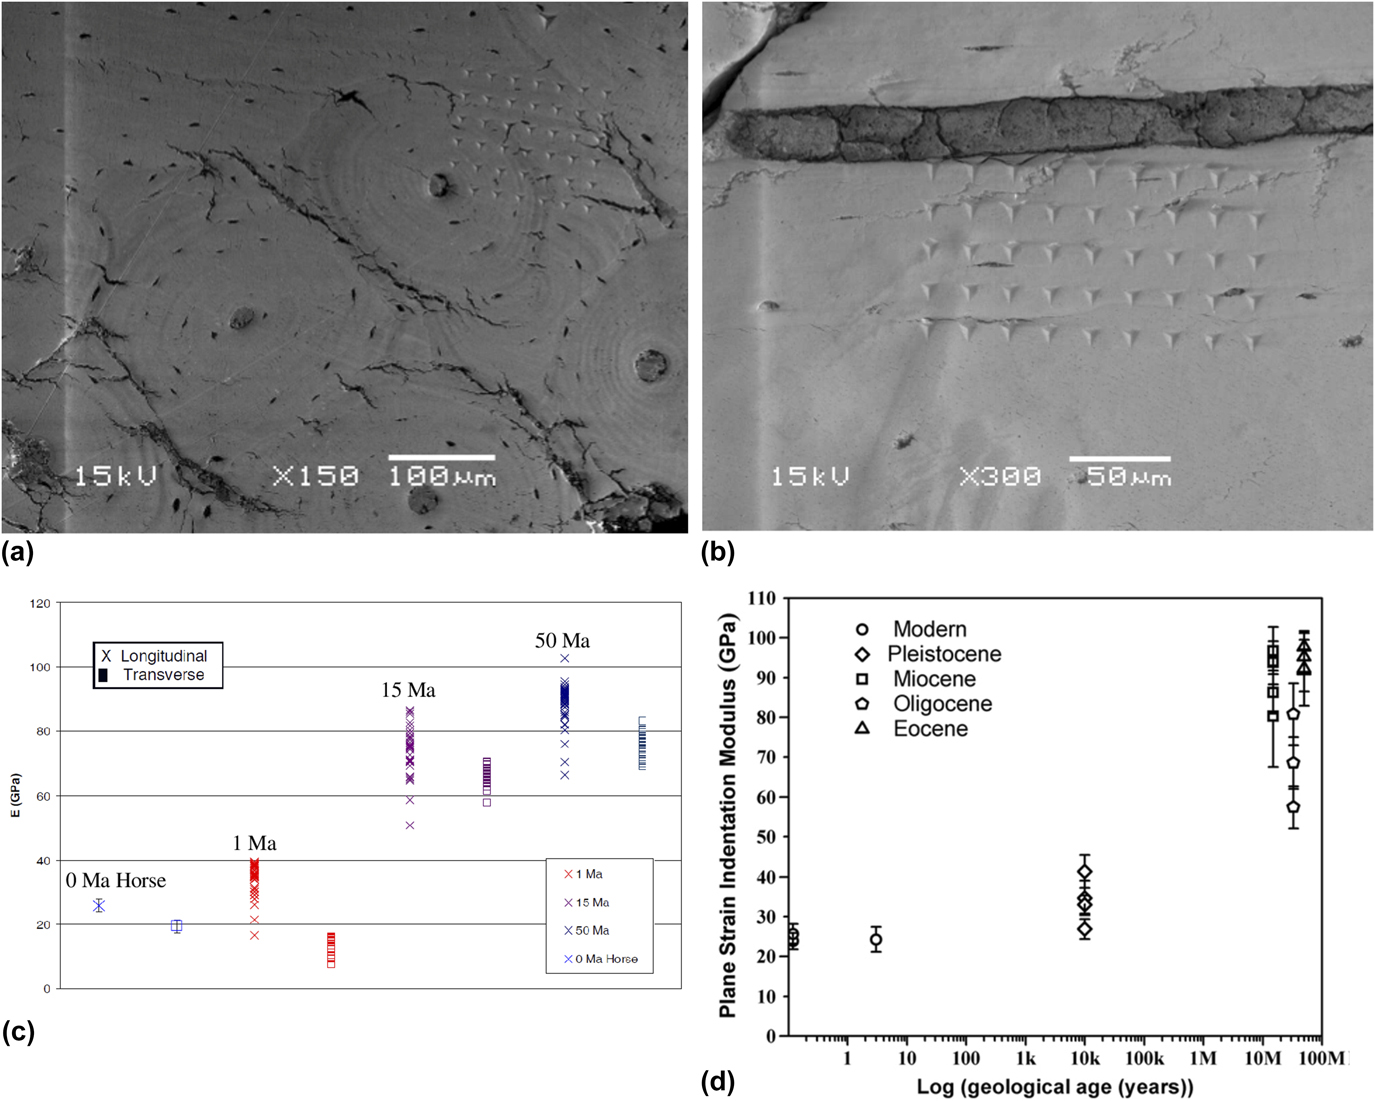
As summarized by Olesiak et al. (2006)Reference Olesiak, Oyen, Sponheimer, Eberle and Ferguson17 and Olesiak et al. (2010),Reference Olesiak, Sponheimer, Eberle, Oyen and Ferguson18 bone is a tissue that endures development and remodeling through biomineralization during its lifetime. This remodeling is governed by the Wolff’s law.Reference Brand54 In natural bones, the tensile and compressive strengths vary in the longitudinal and transverse directions, e.g., tensile strength varies between 54 and 166 MPa, whereas compressive strength varies between 106 and 204 MPa in the longitudinal direction.Reference Wolfram and Schwiedrzik55 It is even conceivable to measure direction-dependent properties of structures using the nanoindentation method.Reference Wolfram and Schwiedrzik55,Reference Schwiedrzik, Raghavan, Bürki, LeNader, Wolfram, Michler and Zysset56 Although a general clinical practice is to perform the dual energy X-ray absorptiometry scan to measure the bone mineral density, changes in bone structures with age for both male and female can also be quantified using the nanoindentation system.Reference Mirzaali, Schwiedrzik, Thaiwichai, Best, Michler, Zysset and Wolfram57 However, in archaeometry, the emphasis is to recover sample history details from the nanoindentation data which makes it more challenging. Following an organism’s demise, diagenesis occurs in bone at the range of length scales, including post-mortem and biological alterations. A consideration of sample protection and tissue-level diagenetic alteration is vital to palaeontologists and archaeologists, and nanoindentation combined with complimentary techniques mentioned above can be used to investigate the functional significance of a wide range of archaeological materials even after fossilization. It has been suggested that nanomechanical analysis of bone at the tissue level reveals a conclusive relationship between physical properties and the local organic content, mineral content, and microstructural arrangement.Reference Olesiak, Oyen, Sponheimer, Eberle and Ferguson17,Reference Olesiak, Sponheimer, Eberle, Oyen and Ferguson18 However, it was not clear as to how these properties changes post fossilization, or diagenesis, where the organic phase was swiftly removed, and the residual mineral phase was reinforced by the deposition of apatites, calcites, and other minerals. As shown in Figs. 10(a)–10(c), Olesiak et al. (2006)Reference Olesiak, Oyen, Sponheimer, Eberle and Ferguson17 and Olesiak et al. (2010)Reference Olesiak, Sponheimer, Eberle, Oyen and Ferguson18 used nanoindentation to investigate the nanomechanical properties of fossilized and modern bone samples with the goal of providing insights into the complex processes of diagenesis.
Nanoindentation of fossilized and modern bone: (a) longitudinal axis 6 × 6 indent array over osteonal and interstitial bone, 15 Ma (million years ago) sample, (b) transverse axis 4 × 9 indent array starting at Haversian canal, 15 Ma sample, (c) cortical bone indents: longitudinal versus transverse (reprinted with permission from Ref. Reference Olesiak, Oyen, Sponheimer, Eberle and Ferguson17, Publisher: Cambridge University Press), and (d) longitudinal modulus values versus the log of geological age (there is a clear increase of modulus values with the geologic age of the sample) (reprinted with permission from Ref. Reference Olesiak, Sponheimer, Eberle, Oyen and Ferguson18, Publisher: Elsevier).
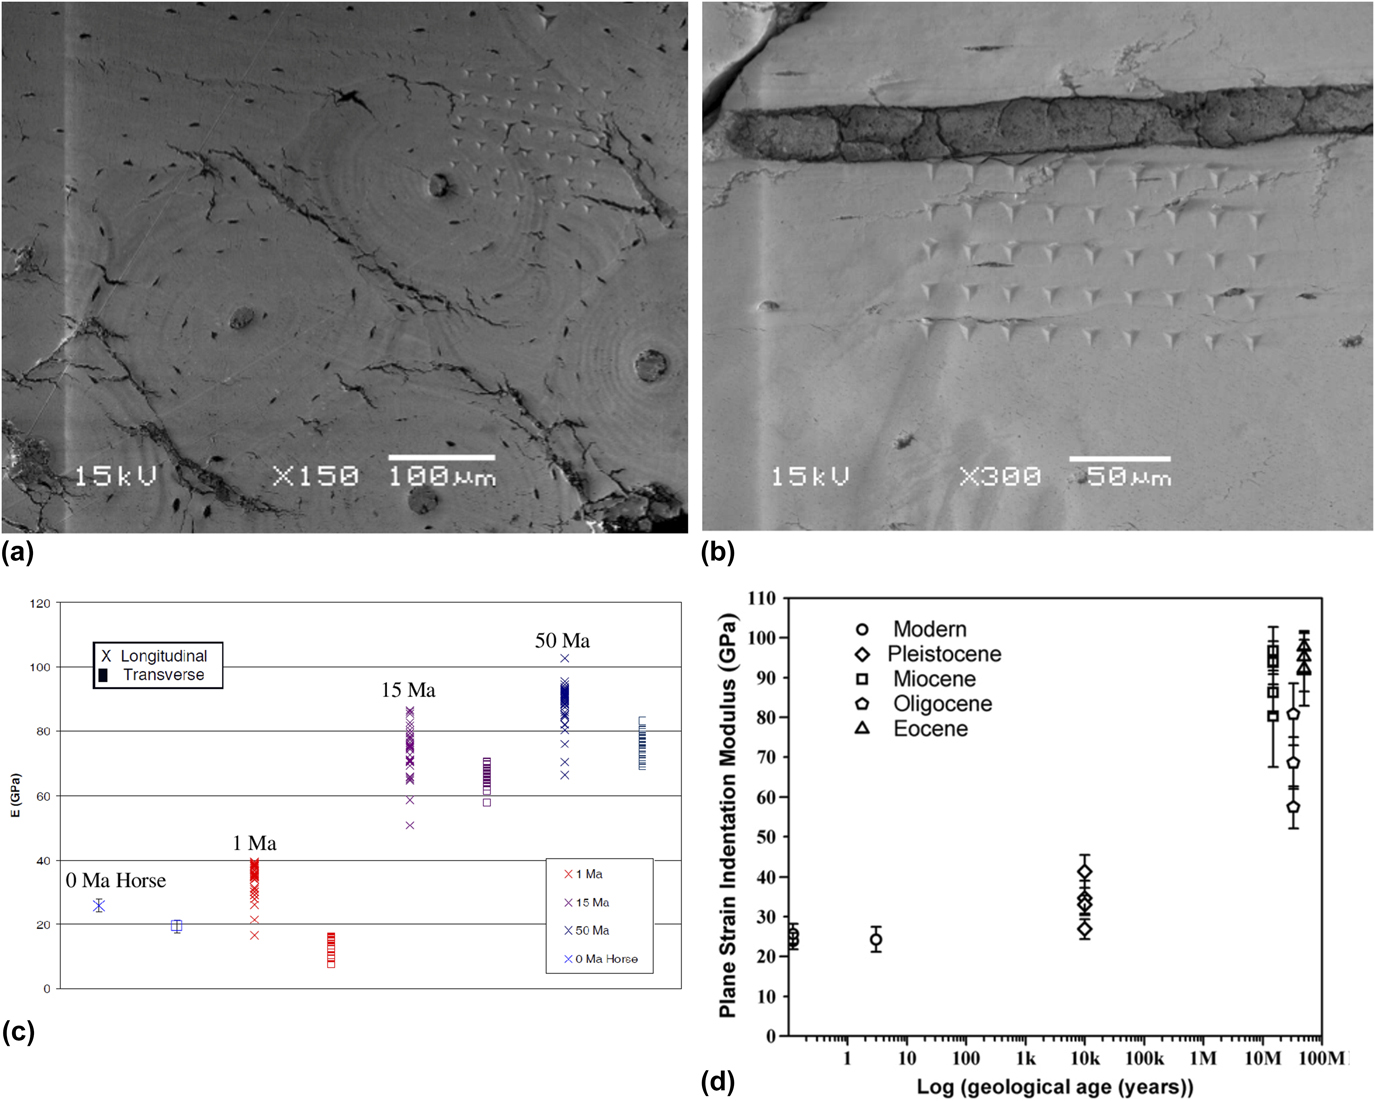
Nanoindentation performed by Olesiak et al. (2006)Reference Olesiak, Oyen, Sponheimer, Eberle and Ferguson17 in both longitudinal and transverse directions revealed preservation of bones’ natural anisotropy as transverse modulus values were consistently smaller than longitudinal values. Additionally, the modulus values of fossilized bone from 35 to 89 GPa increased linearly with logarithm of the sample age. As shown in Fig. 10(d), nanoindentation discovered that the basic mechanical anisotropy of modern bone (Olesiak et al., 2010)Reference Olesiak, Sponheimer, Eberle, Oyen and Ferguson18 can be preserved in fossil bones going back to the early Eocene (∼50 Ma, where Ma is million years ago), as the elastic modulus values measured perpendicular to the long axis of each bone sample were lower than longitudinal values (as is the case for modern bones). While an increase in mechanical properties was observed by Olesiak et al. (2010),Reference Olesiak, Sponheimer, Eberle, Oyen and Ferguson18 with the geological age of the samples, a relatively small increase was seen in fossil bone specimens older than the Miocene, signifying that mineral infilling is limited by spatial saturation. An increased crystallinity and density correlated with an increase in elastic modulus, which shows a link between the crystal microstructure and the mechanical properties of samples.
7. Skins
Skin is the soft part of outer tissue which has three layers (epidermis, dermis, and hypodermis), which protects us from microbes, helps regulate body temperature, and permits the sensations of touch, heat, and cold. The mechanical properties of skin are an important characteristic of its resistance to damage and important indicators of pathological situations.Reference Bhushan, Tang and Ge46 There are very few literature studies related to the application of nanoindentation technique to investigate the mechanical properties of ancient mummified skins (e.g., Fig. 1).
Influence of external factors or the action of micro-organisms, however, can damage the tissue and lay the subjacent tissue open. To estimate the degree of tissue protection in mummified human skin and the reason for its resilience or durability, Janko et al. (2010)Reference Janko, Zink, Gigler, Heckl and Stark6 examined the structural integrity of type I collagen (i.e., protein). Janko et al. (2010)Reference Janko, Zink, Gigler, Heckl and Stark6 mined samples from the Neolithic glacier mummy known as ‘the Iceman’. When reference samples analyzed from a volunteer of a similar biological age as the Iceman, microscopy using AFM exposed collagen fibrils that had characteristic banding patterns of 69 ± 5 nm periodicity, i.e., sheet-like structures, and it is also a characteristic for modern skin collagen.Reference Janko, Zink, Gigler, Heckl and Stark6 It was observed that the microstructure of dermal collagen bundles and fibrils were largely unaltered and very well conserved by the natural conservation process. Raman spectra of the ancient collagen showed that there were no substantial alterations in the molecular structure. However, AFM-based nanoindentation tests showed some changes in the mechanical behavior of the fibrils. Elastic modulus of single mummified fibrils was 4.1 ± 1.1 GPa, whereas the elasticity of recent collagen averages 3.2 ± 1 GPa. The preservation of the collagen after 5300 years indicated that dehydration owing to freeze-drying of the collagen is the main process in mummification and that the effect of the degradation can be potentially addressed. It is important to note that temperature variations, ultraviolet irradiation, and the actions of insects, bacteria, and fungi can potentially cause degradation, causing further skin tissue decay.Reference Janko, Zink, Gigler, Heckl and Stark6 Based on the above limited investigations in mummified skin, it can be concluded that the nanoindentation technique using elastic modulus values can be used to develop correlation between the mechanical properties of the mummified fibrils and age-related modifications, i.e., its resilience or durability.
IV. CONCLUDING REMARKS
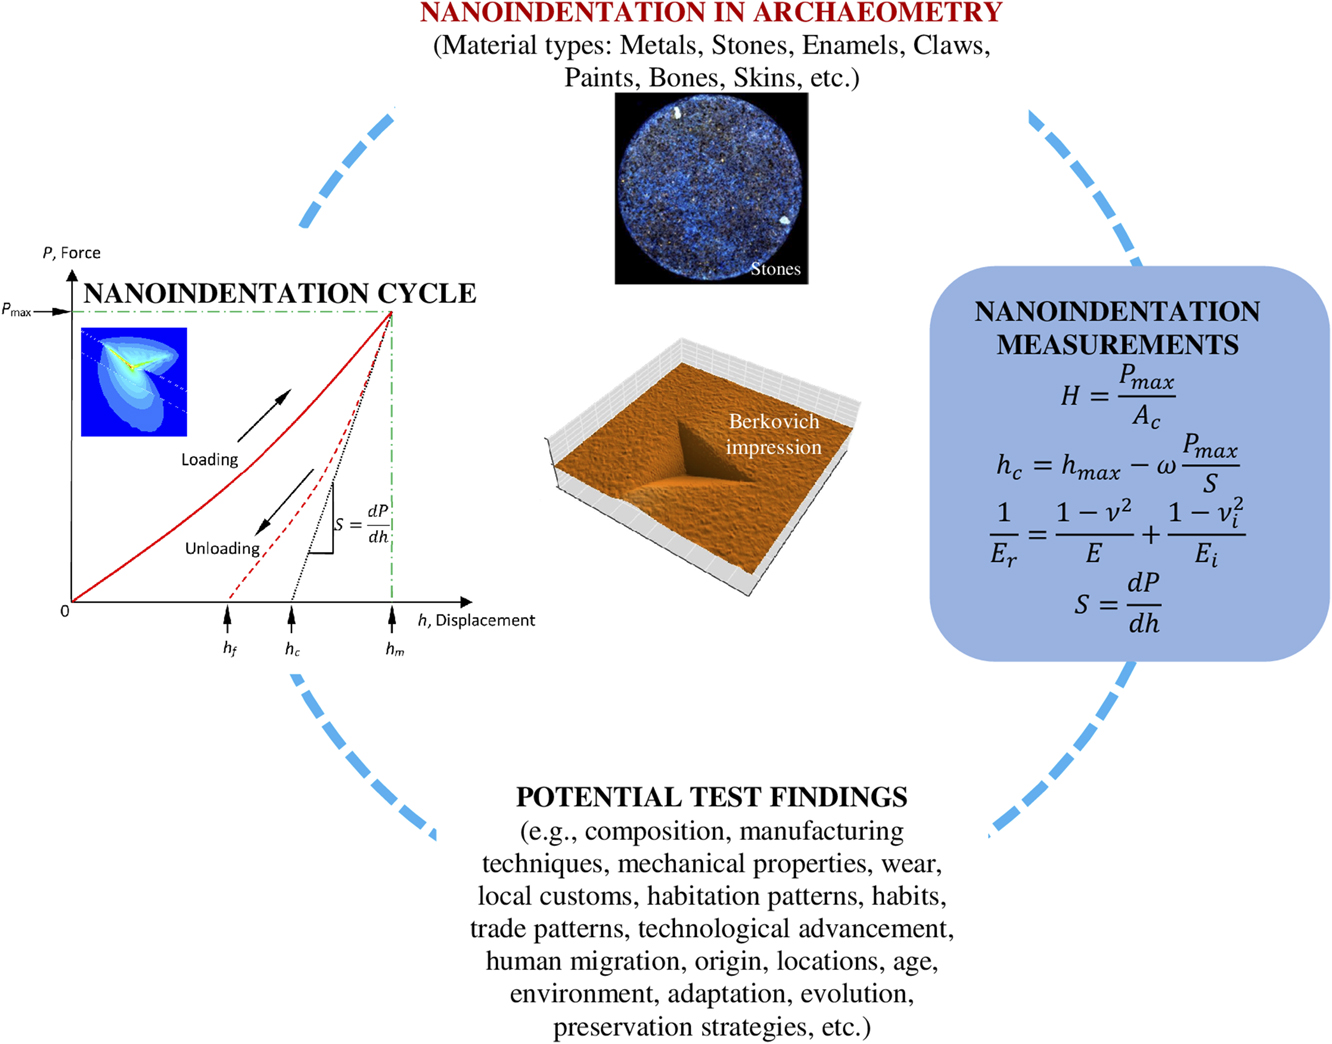
This review highlights potential opportunities that could benefit the field of archaeology substantially by the use of the minimally invasive nanoindentation techniques (as demonstrated in Fig. 11). The technique can help identify the material composition of artifacts, shed light into their construction, and characterize the mechanical properties of ancient tissues and biological constituents.Reference Anseth, Bowman and Brannon-Peppas58 This can allow inference of inter alia, local customs, range of habitation, trade patterns, and advancement of technology and development. Instrumented indentation can also quantify the residual stresses in materials,Reference Faisal, Ahmed and Reuben19,Reference Faisal and Ahmed59 which is known to affect fatigue strength, fracture toughness, and wear resistance, and which can influence the structural strength and lifetime of archaeological components.
Use of the minimally invasive nanoindentation technique in archaeometry.

Bone, including dental material, is another area where nanomechanical characterization techniques are frequently used, mostly on modern materials, but occasionally on ancient or fossilized artifacts. Abrasions as well as wear and stress patterns can provide useful information to the archaeologist, informing theories on human migration and habitation patterns.Reference Riede and Wheeler14 The analysis of dinosaur claws can provide insight into strength and therefore postulate the way the claws were used and thus shed light on the habits of dinosaurs.Reference Manning, Margetts, Johnson, Withers, Sellers, Falkingham, Mummery, Barrett and Raymont15 As bone and teeth are formed by minerals, local conditions will dictate the composition of the material and thus allow for a correlation between the sample, its origin, and its location.Reference Olesiak, Sponheimer, Eberle, Oyen and Ferguson18 Furthermore, when applied to the fossilized material, the results of the analysis can help estimate the age of the material.Reference Olesiak, Oyen, Sponheimer, Eberle and Ferguson17
The nanoscratch technique has also been used on modern and ancient steel samples to establish values of nanohardness and elasticity.Reference Patzke, Levin, Shakhverdova, Reibold, Kochmann, Paufler and Meyer8 The scratch testing is of importance to access the fracture data of the unique range of exotic materials described above. These testing methods are also useful to access the values of friction coefficient which are now aiding to device the bio-inspired strategy to combat catastrophic damages.Reference Yao, Xie, He and Dao60 Additionally, another example of understanding the bio-inspired designs can be seen in a range of studies varying from designing cutting tools for machining,Reference Fatima and Mativenga61 transportation solutions,62 nanotechnology, and so on.63 By analyzing the materials in bronze vessels to determine regional variations and shed light on the composition of the alloy and of the specific forging techniques used, information is obtained on the origin and spread of the technologyReference Li, Wu, Liao, Liao, Zhang, Chen and Pan10 and of human migration and trade patterns. Indeed, the results of the analysis are crucial for understanding the relationship between environment and adaptation and evolution.Reference Ungar64
This review concludes that many investigations scrutinize the basic nanomechanical properties (hardness, elastic modulus, and fracture) during nanoindentation, and therefore, there is a scope for residual stress measurement with proper calibration of archaeological test specimens, which may help in planning preservation strategies. Recently, Marshall et al.Reference Marshall, Cook, Padture, Oyen, Pajares, Bradby, Reimanis, Tandon, Page, Pharr and Lawn65 have addressed a general perception in this field questioning the validity of the indentation results. Their review provides useful guidelines on what may go wrong during such a test whilst also highlighting that the indentation fracture theory is fundamental and originated from the theory of fracture mechanics proposed earlier by Griffith. Darvell et al.Reference Darvell, Lee, Yuen and Lucas66 reported measurement of mechanical properties of pliant solids, particularly toughness using either scissors or wedge tests, which can potentially be fully instrumented for enhanced fracture or toughness measurement of biomaterials. It is asserted by the numerous results that besides few orders of acceptable numerical uncertainty, the modern nanoindentation technique is rather a very quick, site-specific convenient, and economical means for comparative mechanical characterization of any material sample almost universally. As an outlook, we anticipate a growing capability of mechanical parameters as measured by nanoindentation to be interpreted in terms of not only usage but also aging states of various materials. This could be through specific radiation damage mechanisms as discussed in the review but may eventually encompass precision measurement of parameters affected by physical ageing of nonequilibrium phases.
Aging is a time-dependent processReference Valliappan and Chee67 and one of the important aspects in archaeometry. Aging (in the current context, e.g., due to low or high temperature exposure, mechanical loading, radiation exposure, actions of insects, bacteria and fungi, tribological wear, etc.) can be explained as partial or total loss of their capacity to achieve the purpose, can lead to change in structural properties, and may impact the ability to withstand various challenges from operation, environment, and natural events.Reference Valliappan and Chee67 Except few examples, such as ultraviolet irradiation and the actions of insects, bacteria, and fungi-related degradation in skin,Reference Janko, Zink, Gigler, Heckl and Stark6 age-related variations at grain boundaries in metals,Reference Northover, Northover and Wilson7 tribological wear of enamels,Reference Sanson, Kerr and Gross13,Reference Riede and Wheeler14 mechanical (ductility) properties for paint-like materials,Reference Salvant, Barthel and Menu16 and radiation-related damage in stones,Reference Oliver and Pharr20 aging-related characterization of archaeological materials using nanoindentation technique has not been demonstrated much through the literature. Since aging of materials over time may induce damage or microstructural changes (leading to changes in hardness, modulus, fracture toughness, wear resistance, etc.), investigation of aging can provide further reliability on the application of nanoindentation in conjunction with suitable microscopic techniques.
For over many years, the nanoindentation technique has been used to characterize a variety of materials. The literature discussed here addresses issues that are becoming of increasing interest to researchers in the field of archaeological materials. Now it is easy to foresee that inspection of archaeological materials using nanoindentation technique is important for a number of reasons, as it can provide valuable information about mechanical properties which, in turn, relate to the evolution of ancient biomaterials as well as human history and production methods. However, the value of nanoindentation interpretations of archaeological materials would benefit from a detailed comparative study using other validation techniques. This is an area which can provide further reliability on the application of the nanoindentation technique. It also requires further investigation to bring out improvements to make this technique more satisfactory, as many interpretation issues in nanoindentation tests such as anomalies between loading–holding–unloading stages and occurrence of deformation and/or cracking are still unresolved. However, the trends reported in this review on the application of nanoindentation technique of archaeological materials show potential for its wider applications at world heritage sites. Also, a simpler user interface could also serve to build a strong case for how nanoindentation instrument could be useful as a routine tool to evaluate ancient materials properties in situations especially when the testing needs to be done on confined volumes in small material samples.
ACKNOWLEDGMENTS
All the authors would like to acknowledge the overall experience gained during their research and development through various commercially available nanoindentation machines without which this review would not have been possible. The authors (SG and GC) would like to acknowledge the support of the COST Action MP1303 as well as COST Action 15102 of the Horizon 2020. SG is also grateful to the Centre for Doctoral Training (CDT) in Ultra Precision at Cranfield University which is supported by the EPSRC via Grant Nos. EP/K503241/1 and EP/L016567/1 that provided the motivation for this work. Finally, all the authors are particularly grateful to the Principal Editor (Journal of Materials Research) and the reviewers for their extensive comments and recommendations.