1 Introduction
What is it that makes a particular text easy or hard to read? This question is central to any automatic readability prediction system. Ideally, the task is based on a clear-cut definition of the concept ‘readability’. Since the emergence of the domain, however, the terms ‘readability’ and ‘clarity’ have been defined in a wide variety of ways, typically dependent on the intentions of the author. If one wishes, for instance, to have a criterion to select reading material, the concept of readability will evidently include the reading proficiency needed for text comprehension. This was one of the underlying principles in earlier work on readability formulas (e.g. Dale and Chall Reference Dale and Chall1948; Gunning Reference Gunning1952; Kincaid et al. Reference Kincaid, Rogers and Chissom1975; Staphorsius Reference Staphorsius1994). Another perspective on the concept of readability was proposed by DuBay (Reference DuBay2004) who defined it as ‘what makes some texts easier to read than others’.
Automatic readability prediction has a long and rich tradition. Research in the twentieth century, fueled especially by educational purposes, has resulted in a large number of readability formulas. Typically, these yield either an absolute score Flesch (Reference Flesch1948); Brouwer (Reference Brouwer1963) or a grade level for which a text is deemed appropriate Dale and Chall (Reference Dale and Chall1948); Gunning (Reference Gunning1952); Kincaid et al. (Reference Kincaid, Rogers and Chissom1975) and are based on shallow text characteristics such as average word and sentence length and word familiarity. Owing to the advances in the fields of natural language processing (NLP) and machine learning (ML), readability research has seen a revival in the past decade or so. In recent studies, readability has been linked with more complex lexical and syntactic text characteristics Schwarm and Ostendorf (Reference Schwarm and Ostendorf2005); Petersen and Ostendorf (Reference Petersen and Ostendorf2009) and more recently, discourse features capturing local and global coherence across text are also being scrutinized Graesser et al. (Reference Graesser, McNamara, Louwerse and Cai2004); Pitler and Nenkova (Reference Pitler and Nenkova2008); Feng et al. (Reference Feng, Jansche, Huenerfauth and Elhadad2010).
Simultaneous to the introduction of modern NLP techniques in readability research, there has been an increased interest in private and public organisations to produce readable documents. The impetus for this has been a mixture of consumer demands and mainly government and industry regulation. Notable initiatives are the Clarity Campaign,Footnote 1 the US Plain Writing Act of 2010, which aims at enhancing citizen access to government information and services, the European Clear Writing Campaign etc. These efforts have led to numerous clear writing guidelines tailored to specific domains and text types. Most of these efforts provide guidelines for writing, although there are some semi-automatic authoring tools as well (see for example Hoste et al. (Reference Hoste, Vanopstal, Lefever and Delaere2010)). Another field in which readability research has gained a lot of interest is the medical health domain because of the ‘vocabulary gap’ between the domain and its audience (Zeng et al. Reference Zeng, Goryachev, Tse, Keselman and Boxwala2008; Leroy, Helmreich and Cowie Reference Leroy, Helmreich and Cowie2010; Leroy and Endicott Reference Leroy and Endicott2011). Readability applications are not only interesting to determine the readability level of a given text but could also aid to manage the information redundancy current society is faced with. For example, given the redundancy of information present on the web, the readability of web documents could be a criterion to rank retrieved documents Kanungo and Orr (Reference Kanungo and Orr2009); Kate et al. (Reference Kate, Luo, Patwardhan, Franz, Florian, Mooney, Roukos and Welty2010), or to summarize or automatically translate on-line content.
One of the well-known bottlenecks in the data-driven NLP research is the lack of sufficiently large data sets for which annotators provided labels with satisfying agreement. Readability research is no exception to this rule. Since readability prediction was initially designed to identify reading material suited to the reading competence of a given individual, most of the existing data sets are drawn from textbooks and other sources intended for different competence levels Heilman et al. (Reference Heilman, Collins-Thompson and Eskenazi2008); François (Reference François2009); Feng et al. (Reference Feng, Jansche, Huenerfauth and Elhadad2010). Although recent annotation efforts have also tackled other text types (e.g. Feng et al. Reference Feng, Jansche, Huenerfauth and Elhadad2010; Kate et al. Reference Kate, Luo, Patwardhan, Franz, Florian, Mooney, Roukos and Welty2010), we are not aware of any publicly available data sets with readability assessments for generic texts.
In this paper, we investigate two different methodologies to assess the readability of a wide variety of text material, starting from a corpus of which the readability was previously unlabelled. To this end, we have designed and implemented two web applications that can be used to easily collect readability assessments from human annotators over any corpus. The first is a more traditional labeling setup in which language experts are asked to sort texts based on readability. In the second setup, we investigated the viability of a more lightweight crowdsourcing application in which users are confronted with two texts and asked to compare them on a five-point scale. In order to validate this approach, readability assessments for a corpus of written Dutch texts were gathered. By collecting multiple assessments per text, we explicitly aimed to level out the reader's background knowledge and attitude. Our findings show that the assessments collected through both annotation tools are highly consistent, i.e. the language experts agree with the users of the crowdsourcing application on how the texts should be ranked in terms of readability. This is good news as the crowdsourcing application is more lightweight to use and can tap into a much wider audience of potential annotators.
By performing some basic machine learning experiments, we further illustrate how the collected data can be used to perform text comparisons (e.g. allowing to compare different text pairs) or to assign readability scores to an individual text (e.g. to a legal text, insurance policy, patient information leaflet or to reading material for language learners). In order to account for the latter case, we defined a readability measure that can be estimated from the data. The main purpose of the machine learning experiments reported in this paper is to demonstrate the various possibilities of our data set, no optimization has been carried out.
The remainder of this paper is organized as follows. Section 2 motivates the present study and presents an overview of related work on automatic readability prediction. Section 3 describes the two annotation strategies that we propose for collecting readability assessments. In Section 4, we give an overview of different basic machine learning experiments, followed by a description of the results in Section 5. Section 6 ends with a discussion and prospects for future research.
2 Related work
Since the first half of the twentieth century, readability formulas have been widely used to automatically predict the readability of an unseen text. Although they were primarily intended to select reading material for language learners, their being part of editing environments such as MS Word illustrates a widespread usage. A readability formula can be described as a mathematical formula, typically consisting of a number of variables (i.e. text characteristics) and constant weights, intended to grasp the difficulty of a text. For some formulas a higher and for others a lower score indicates a more difficult text. The initial goal of readability tests, as for example conceived by McCall and Crabbs Flesch (Reference Flesch1948), was to determine the reading proficiency of an individual reader on the basis of a set of standardised reading tests and to use readability formulas to select appropriate reading material. As Bailin and Grafstein (Reference Bailin and Grafstein2001) state, readability formulas appeal because they are believed to objectively and quantifiably evaluate the difficulty of written material without measuring characteristics of the readers. Text characteristics typically figuring as variables are the average word length in number of syllables or characters, the average sentence length in number of words, the type/token ratio, the percentage of words also found in a pre-assembled word list of frequently used words etc. These overall simple lexical and syntactic features are obtained by processing a text automatically.
Many objections have been raised against the classical readability formulas: their lack of absolute value Bailin and Grafstein (Reference Bailin and Grafstein2001), the fact that they are solely based on superficial text characteristics (e.g. Davison and Kantor Reference Davison and Kantor1982; DuBay Reference DuBay2004, Reference DuBay2007; Feng, Elhadad and Huenerfauth Reference Feng, Elhadad and Huenerfauth2009; Kraf and Pander Maat Reference Kraf and Pander Maat2009), the underlying assumption of a regression between readability and the modelled text characteristics Heilman et al. (Reference Heilman, Collins-Thompson and Eskenazi2008) etc. Furthermore, there even seems to be a remarkably strong correspondence between the readability formulas, even across different languages (van Oosten, Tanghe and Hoste Reference van Oosten, Tanghe and Hoste2010).
Thanks to advancements in the field of NLP, new features have been introduced. Recent research on readability prediction using machine learning started with adding statistical language modelling Si and Callan (Reference Si and Callan2001); Collins-Thompson and Callan (Reference Collins-Thompson and Callan2005) and later also more complex syntactic features introducing a text's complexity based on parse trees Schwarm and Ostendorf (Reference Schwarm and Ostendorf2005); Heilman et al. (Reference Heilman, Collins-Thompson and Eskenazi2008) were added. More recently, semantic (vor der Brück, Hartrumpf and Helbig Reference vor der Brück, Hartrumpf and Helbig2008) and discourse features Pitler and Nenkova (Reference Pitler and Nenkova2008); Feng et al. (Reference Feng, Jansche, Huenerfauth and Elhadad2010); Leroy and Endicott (Reference Leroy and Endicott2011) are also being scrutinized. These and other studies have shown that more complex linguistic features are useful; however, the discussion on which features are the best predictors remains open. While Pitler and Nenkova (Reference Pitler and Nenkova2008) have clearly demonstrated the usefulness of discourse features, their predictive power was not corroborated by, for example, Feng et al. (Reference Feng, Jansche, Huenerfauth and Elhadad2010). Nevertheless, we can deduct from previous research that features which are lexical in nature, such as language modeling features, have a strong predictive power. Besides various features, more intricate prediction methods, such as Naive Bayes classifiers Collins-Thompson and Callan (Reference Collins-Thompson and Callan2004), logistic regression François (Reference François2009) and support vector machines (Schwarm and Ostendorf Reference Schwarm and Ostendorf2005; Feng et al. Reference Feng, Jansche, Huenerfauth and Elhadad2010; Tanaka-Ishii, Tezuka and Terada Reference Tanaka-Ishii, Tezuka and Terada2010) have come into use.
Since the main focus of readability research, until recently, has been on finding appropriate reading material for language learners, most of the existing data sets are built on underlying corpora of educational material, such as school textbooks and comparable corpora that have been collected and studied representing various reader levels Petersen and Ostendorf (Reference Petersen and Ostendorf2009); Feng et al. (Reference Feng, Jansche, Huenerfauth and Elhadad2010). For Dutch, for example, the only large-scale experimental readability research Staphorsius and Krom (Reference Staphorsius and Krom1985); Staphorsius (Reference Staphorsius1994) is limited to texts for elementary school children.Footnote 2 For English, the situation is similar, viz. a predominant focus on educational corpora. Notable exceptions are those corpora explicitly designed to represent an actual difference in readability based on its envisaged end-users (i.e. people with intellectual disabilities Feng et al. (Reference Feng, Jansche, Huenerfauth and Elhadad2010)) or text genre (i.e. medical domain Leroy and Endicott (Reference Leroy and Endicott2011)). Recently, a more general corpus was assembled which is not tailored to a specific audience, genre or domain by the Linguistic Data Consortium (LDC) in the framework of the DARPA Machine Reading Program Kate et al. (Reference Kate, Luo, Patwardhan, Franz, Florian, Mooney, Roukos and Welty2010). However, these data have not been made publicly available.
When constructing data sets for readability prediction, the inherent subjectivity of the concept of readability cannot be ignored. Other labeling tasks in NLP, such as annotating part-of-speech or coreferential relations, are all based on a set of predefined guidelines to which the annotators have to adhere. The agreement between the annotators evidently depends on the complexity of the annotation task and can lead to a further clarification and refinement of the underlying annotation guidelines. Readability labeling requires a different approach. The ease with which a given reader can correctly identify the message conveyed in a text is, among other things, inextricably related to the reader's background knowledge of the subject at hand McNamara et al. (Reference McNamara, Kintsch, Songer and Kintsch1993). The construction of a corpus that is to serve as a gold standard against which new scoring or ranking systems can be tested, thus requires a multifaceted approach taking into account both the properties of the text under evaluation and those of the readers. In recent years, a tendency seems to have arisen to explicitly address this subjective aspect of readability. Pitler and Nenkova (Reference Pitler and Nenkova2008), for example, base their readability prediction method exclusively on the extent to which readers found a text to be ‘well-written’ and Kate et al. (Reference Kate, Luo, Patwardhan, Franz, Florian, Mooney, Roukos and Welty2010) follow a similar approach by defining readability assessment as ‘a subjective judgment of how easily a reader can extract the information the writer or speaker intended to convey’.
The traditional way to collect readability assessments is to let people assign absolute scores to each text and use the resulting mean readability score. Pitler and Nenkova (Reference Pitler and Nenkova2008) and Kate et al. (Reference Kate, Luo, Patwardhan, Franz, Florian, Mooney, Roukos and Welty2010), for example, average out results collected from different readers. In our approach, however, all texts in the corpus are compared to each other by different people and by using different comparison mechanisms, i.e. pairwise comparison and ranking. By collecting multiple assessments per text, we aim to level out the reader's background knowledge and attitude as much as possible. This annotation process results in sets of text pairs, accompanied with a relative readability assessment per pair. This is similar to the work of Tanaka-Ishii et al. (Reference Tanaka-Ishii, Tezuka and Terada2010) who also used text pairs. However, Tanaka-Ishii et al. (Reference Tanaka-Ishii, Tezuka and Terada2010) required only two general classes of text to make pairs: easy versus difficult. In our approach, we not only allow for a more fine-grained comparison but also for a comparison of all texts under evaluation.
3 Assessing readability
For the construction of a readability prediction system, roughly three steps can be distinguished. First of all, a readability corpus containing text material of which the readability will be assessed must be composed. Second, a methodology to acquire readability assessments should be defined. Finally, based on the readability corpus and the acquired assessments, prediction tasks can be performed. The first two steps are extensively discussed in this section.
3.1 Readability corpus
The corpus that was used for the readability assessments contains 105 texts extracted from the Dutch LassyKlein corpus van Noord et al. (Reference van Noord, Bouma, van Eynde, de Kok, van der Linde, Schuurman, Sang and Vandeghinste2012).Footnote 3 LassyKlein is a syntactically annotated corpus and recently its texts have been enriched with semantic information (Schuurman, Hoste and Monachesi Reference Schuurman, Hoste and Monachesi2010), which makes it a particularly interesting data set for further readability research. From the selected texts, we extracted snippets of between one hundred and 200 words for readability assessment.Footnote 4 Most of these snippets are extracted from a larger context but are meaningful by themselves. This was objectively measured by letting two trained linguists rank twelve full texts and their twelve snippets as more difficult, less difficult or equally difficult independent of each other with an interval of one week (i.e. eleven full text pairs and eleven snippet pairs). We opted for an interval of one week, based on the assumption that the annotators could still remember (part of) the contents of both full texts and the snippets after one week, but forget about how they ranked both groups of texts. This was confirmed by both annotators. The agreement between the ranking of full texts and snippets is 90.9 percent for the first annotator and 100 percent for the second; the snippets can thus be considered as viable alternatives. When we refer in the following sections to the texts that were assessed, we actually mean the snippets.
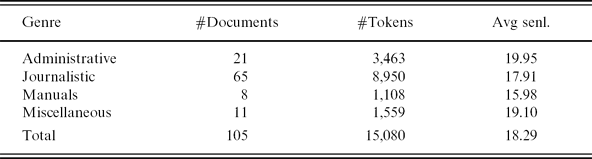
The corpus which served as the basis for the assessments consists of texts coming from four different genres, viz. administrative texts, manuals (e.g. also including patient information leaflets), news articles and a miscellaneous section. This proportion of texts per genre reflects the corpus design of the underlying LassyKlein corpus. In Table 1, an overview is given of the number of texts and tokens included in the readability corpus together with their average sentence length.
Readability corpus data statistics

We acknowledge that including multiple genres might influence our final training system in that it only learns to distinguish between various genres instead of various readability levels. To account for this as much as possible, we carefully tried to select texts of varying difficulty for each text genre. Although we are fully aware of the shortcomings of the existing readability formulas, we confronted our intuitive selection with the output of two classical readability formulas designed for Dutch so as to objectify the selection as much as possible. The formulas that we used are the Flesch–Douma formula given in (1) Douma (Reference Douma1960) and the Leesindex Brouwer given in (2) Brouwer (Reference Brouwer1963). Both are adaptations of the well-known (3) English Flesch reading ease formula given in (3) Flesch (Reference Flesch1948). As one can see, these formulas are based on shallow text characteristics such as the average sentence length (avgsentencelen) and the average number of syllables per word (avgnumsyl) in a particular text. The latter was calculated for Dutch by implementing a classification-based syllabifier van Oosten et al. (Reference van Oosten, Tanghe and Hoste2010).
 \begin{equation}
Douma = 207 - 0.93 \cdot avgsentencelen - 77 \cdot avgnumsyl
\end{equation}
 \begin{equation}
Brouwer = 195 - 2 \cdot avgsentencelen - 67 \cdot avgnumsyl
\end{equation}
 \begin{equation}
Flesch = 206.835 - 1.015 \cdot avgsentencelen - 84.6 \cdot avgnumsyl
\end{equation}
Figure 1 presents an overview of the readability scores each formula assigns to the texts in each of the genres. It clearly illustrates that the median values are all quite close across different genres, e.g. between the journalistic texts and manuals according to Douma and Brouwer. Furthermore, the large spread both in terms of difference between the minimum and maximum values and interquartile range (IQR: difference between the third and the first quartile) makes us confident that our corpus presents various levels of readability per genre.
Box-and-whisker plots representing the scores of the readability formulas on different genres. The maximum and minimum values in the data set (except for the outliers) are represented as the upper end of the top whisker and the lower end of the bottom whisker. The first and third quartiles are displayed as the bottom and the top of the box, the median as a horizontal stroke through the box. The outliers – indicated by a circle – are the scores that lie more than three times outside the interquartile range (IQR).
3.2 Two methodologies for readability assessment
While human expert annotation is crucial for many NPL tasks, it is often very expensive and time-consuming, which explains the increasing success of cheaper and faster non-expert contributors over the web (e.g. Poesio, Kruschwitz and Chamberlain Reference Poesio, Kruschwitz and Chamberlain2008; Snow et al. Reference Snow, O'Connor, Jurafsky and Ng2008; Finin et al. Reference Finin, Murnane, Karandikar, Keller, Martineau and Dredze2010). An important prerequisite, however, is that using non-expert labels for training machine learning algorithms is as effective as using gold standard annotations from experts.
Since we envisaged collecting multiple assessments per text in order to level out a reader's background knowledge and attitude as much as possible, we hypothesized that a crowdsourcing approach could be a viable alternative to expert labels. Snow et al. (Reference Snow, O'Connor, Jurafsky and Ng2008), for example, demonstrated the effectiveness of using Amazon Mechanical Turk for a variety of NLP tasks; they found that for many tasks only a small number of non-expert annotations per item were necessary to equal the performance of an expert annotator. The task of assigning readability assessments to texts, however, is quite different from labeling tasks where a set of predefined guidelines have to be followed. Readability assessment remains largely intuitive, even in the case where annotators get instructions to pay attention to syntactic, lexical etc. complexity when assigning a readability level to a given text. But then again, this lack of large sets of guidelines might be another motivation for the use of crowdsourcing.
That is why we decided to explore two different methodologies to collect readability assessments for our corpus, viz. a more classical expert labeling approach, in which we collected assessments of language professionals (i.e. teachers, linguists, writers), and a lightweight crowdsourcing approach.
In designing both annotation methodologies, we started from DuBay's definition: ‘what makes some texts easier to read than others’ DuBay (Reference DuBay2004), a definition which specifically returns in the labels that can be assigned to text pairs in the crowdsourcing application. Since we wanted to level out individual background as much as possible, we added ‘to the community of language users’ as an additional constraint.
3.2.1 Expert readers
With the Expert Readers applicationFootnote 5 (see Figure 2) we envisaged a more traditional approach to readability assessment in which experts decide on the level of readability of a given text. The interface allows the assessors to place each text in a correct position according to their readability perception, like in a slide sorter view in presentation software. Through this ranking setup, the number of pairwise comparisons being performed grows quadratically with each assessed text. The experts are furthermore given the option to assign absolute scores to texts; this ordering of the scores defines the ranking. The benefit of the latter option is that it also allows users to easily assign the same score to multiple equally readable texts.
A screenshot of the Expert Readers web application.
The application is only open to persons who are professionally involved with the language under consideration, i.e. experts.Footnote 6 The experts can express their opinion by ranking texts on a scale of 0 (easy) to 100 (difficult), which allows them to compare texts while at the same time assigning absolute scores. Although it is unlikely that people can accurately assign scores on a one hundred-point scale Cox (Reference Cox1980), we decided to provide such an extensive scale because when many texts are compared at the same time, there should be a possibility to express differences, no matter how small these are. As a special feature, texts can be ticked as anchor points, which means that they are always kept in memory. As such, they can be used as a frame of reference that facilitates future rankings.
As experts, we specifically aimed at people who are professionally involved with language, thus following a more traditional data-collection methodology. The experts are asked to assess the readability for language users in general. We deliberately do not ask more detailed questions about certain aspects of readability, because we want to avoid influencing the text properties experts pay attention to. Neither do we inform the experts in any way on how they should judge readability. Any presumption about which features are important readability indicators is thus avoided. However, the experts were offered the possibility to motivate or to comment on their assessments via a free text field in the interface. These comments, e.g. on the syntactic complexity of a given text fragment, will be used in future experiments integrating more high-level syntactic and semantic features.
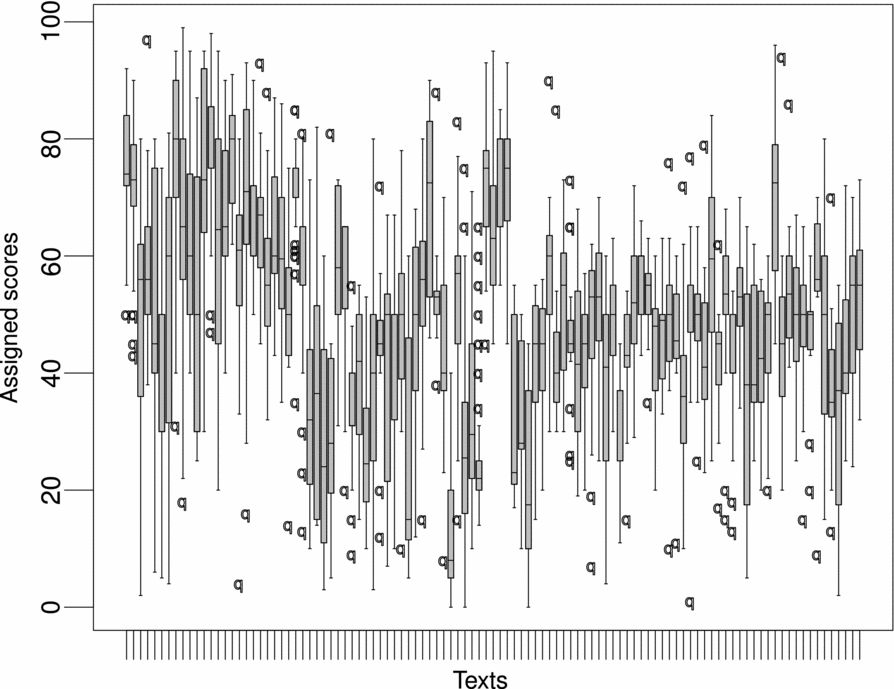
Our current pool of active experts consists of thirty-six teachers, writers and linguists, who have contributed a total of 1,862 text rankings. As far as the ranking itself is concerned, we observed that every expert did mark some texts as anchor points, on average nine texts were kept in the frame of reference of each expert. This behaviour confirms that the ranking task was well understood by the annotators, i.e. the expert rank the text relative to the other texts present in a batch instead of considering them all independently of each other. Per annotation session, the assessments were stored in a batch. We decided to only take into account submission batches where at least five texts were compared to each other. The sizes of the batches range from five to all available texts. As can be expected, different experts employ their own standards to assign readability scores on a scale from 0 to 100. Figure 3 clearly illustrates large variability in the scores assigned to the individual texts (x-axis), viz. a large spread between the minimum and maximum scores.
Box-and-whisker plots showing the minimum, first quartile, median, third quartile, the maximum and the outliers for the scores assigned to each text in the Expert Readers application. A box plot is displayed for each text in which the minimum score that was assigned to each text is indicated as the lower end of the bottom whisker and the maximum score is the upper end of the top whisker, unless the distance from the minimum (maximum) value to the first (third) quartile is more than 1.5 times the interquartile range, in which case they are drawn as outliers. The first and third quartiles are displayed as the bottom and top of the box, the median as a horizontal stroke through the box.
3.2.2 Crowdsourcing
Our crowdsourcing application, called Sort by Readability,Footnote 7 is intuitive and user-friendly and is designed to be used by as many people as possible. The web site is accessible to anyone having Internet access. Users are not required to provide personal data.
A screenshot of the crowdsourcing application is shown in Figure 4.
A screenshot of the Sort by Readability web application.
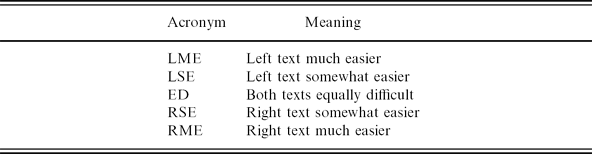
Two texts are displayed simultaneously and the user is asked to tick one of the statements in the middle column, corresponding to the five-point scale in Table 2.
Five-point scale for the assessment of the difference in readability between two texts
After clicking one of the options, a text pair and its corresponding assessment are added to the database and two new randomly selected texts appear. To avoid that, respondents click on one of the buttons too soon, i.e. without reading the texts, the buttons are disabled during a few seconds after the appearance of a new text pair. The only instructions respondents are given are the following two sentences on the landing page of the application:
‘Using this tool, you can help us compose a readability corpus. You are shown two texts for which you can decide which is the more difficult and which is the easier one’.
As was done for the experts, we gave no further instructions because we did not want to influence anyone on how to perceive readability. Since we deliberately chose to keep the crowdsourcing tool open to everyone, we do not know who performed the assessments. In the start-up phase, the tool was widely advertised among friends, family, students etc., which might have caused a bias towards more educated labelers. But evidently, we do not have a clear view on the identity and background of the people who provided assessments. We can state with certainty, however, that the users of the crowdsourcing application differ from the experts selected for the first application (Section 3.2.2).
At the time of writing, 8,568 comparisons were performed and the number of assessments per text pair varies from one to eight. We also evaluated the number of times each button was pressed in the Sort by Readability application and found that the users are generally not biased towards finding texts on one side easier than on the other side.
3.3 From assessments to assessed text pairs
In order to compare the information collected with both applications, all data are converted to data points of the form (t 1, t 2, a), called assessed text pairs. An assessed text pair is a triplet in which t 1 and t 2 are texts from the readability corpus that are compared to each other and a∈{LME, LSE, ED, RSE, RME} is the readability assessment for the text pair, i.e. the relative difference in readability between t 1 and t 2.Footnote 8
Data collected through the crowdsourcing application are already in this format. Converting an expert's data to triplets is not as straightforward. At first sight, an intuitive way to work with the absolute expert scores would be to use the mean of all readability scores assigned to a text. Pitler and Nenkova (Reference Pitler and Nenkova2008) and Kate et al. (Reference Kate, Luo, Patwardhan, Franz, Florian, Mooney, Roukos and Welty2010), for example, average out results collected from different readers. Problems with this approach, however, immediately arise. The texts presented in each submission batch are selected randomly which implies that the annotator can be confronted with predominantly less or more readable texts, which may affect the scoring. Moreover, different experts employ different standards to assign readability scores to texts. Being given the choice to label texts with marks between 0 (most readable) and 100 (least readable), some annotators decided to use a more coarse-grained labeling (e.g. by using multiples of 5, 10 or 20) whereas others used a fine-grained scoring. A similar conclusion was drawn by, for example, Anderson and Davison (Reference Anderson and Davison1986) on a data set annotated with school grade levels by multiple annotators. Annotators may also use a different range of scores: while some may label a very readable text as 0 or 10, others might choose 30 as a lower bound, in case even more readable texts would later have to be scored. Some annotators used the maximum scoring range of one hundred (between 0 and 100), while others scored between upper and lower bounds (e.g. 30–90, a scoring range of 60).
Figure 3 clearly shows the large spread in scores per text. This variation can be explained by two factors: annotators' different perspectives on whether a text is hard to read, and their different scoring strategies. This prohibits a simple averaging of the scores: a good average should only reflect the former factor, and level out the latter as much as possible.
To normalize the differences between annotator scoring strategies, we propose to calculate the weighted normalized difference (WND) for each text pair coming from the experts. In the first step, we calculate the normalized difference (ND) of a text pair i, in which we account for different scoring strategies of the experts:
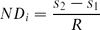 \begin{equation}
ND_{i} = \frac{s_2 - s_1}{R}
\end{equation}
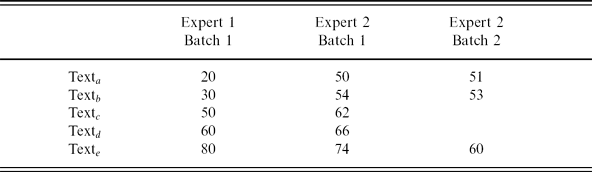
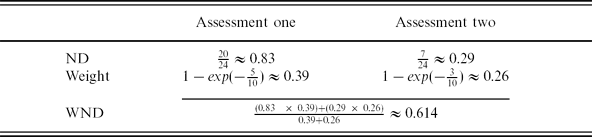
Suppose the artificial first batchesFootnote 9 listed in Table 3 (columns 2 and 3) come from two experts. Note that the absolute scores differ between both batches, but the relative distances between scores are identical. If we compare pair Textb–Texte of the first expert with the same pair of the second expert simply by taking the average of the differences in scores, the difference in readability scored by the first expert (80 – 30 = 50) would be considered much more prominent than the second one (74 – 54 = 20). If, on the contrary, we also incorporate the range of each expert, the influence of scoring range is erased ( $\frac{80 - 30}{60} = \frac{74 - 54}{24} = \frac{5}{6}$).
Three different artificial batches coming from two experts
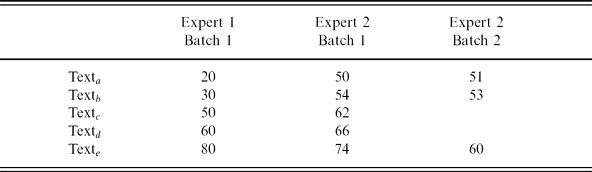
Because the experts could submit their scores in different batches, they were sometimes confronted with texts which they already scored in earlier sessions, potentially leading to identical text pairs with different assessments (see, for example, the artificial Batch 2 from Expert 2 in Table 3). In order to account for these identical pairs with different scores, we group all the ND scores for that text pair from one expert using a weighted average. The canonical formula for a weighted average is given in Formula 5, where xi is one element from a vector of values to be averaged, and wi is the weight associated with that element. The weights determine how much a given element contributes to the weighted average.
 \begin{equation}
Weighted\:average = \frac{\sum _{i=1}^n w_{i} . x_{i}}{\sum _{i=1}^n w_{i}}
\end{equation}
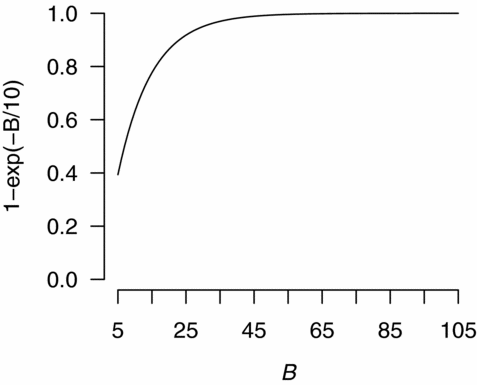
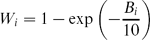
In a weighted average, some data points contribute more to the average than others, depending on a specified weight. We specified weights Wi as a function of the batch size Bi in which a specific evaluation occurred:
 \begin{equation}
W_{i} = 1-\exp \left(-\frac{B_{i}}{10}\right)
\end{equation}
The weight ensures that assessments coming from small batches have a smaller influence on the average. We thus assign more confidence to assessments coming from bigger batches: We assume that the more texts an annotator compared in a batch, the more effort he/she made to position these texts. Moreover, the more texts a user is confronted with, the more likely it is that a particular batch will contain texts from various degrees of readability.
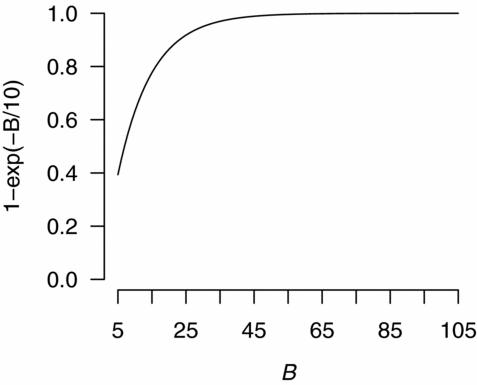
Figure 5 shows how the weight function assigns mass to an evaluation based on batch size. Batches with the minimum size of 5 get a weight of approximately 0.4, after which the weight quickly increases with batch size towards 1.
The value of weight Wi as a function of batch size B. The minimum batch size in our corpus is 5, the maximum size is 105.
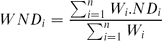
We can thus define the WND of a text pair i by plugging our variables into the generic weighted average formula (Formula 5):
 \begin{equation}
WND_{i} = \frac{\sum _{i=1}^n W_{i} . ND_{i}}{\sum _{i=1}^n W_{i}}
\end{equation}
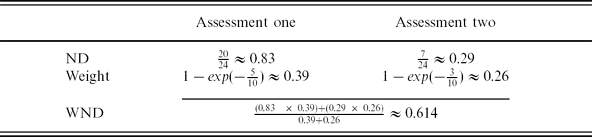
If we return to our example listed in Table 3 and more specifically to the text pair Textb–Texte, which was assessed twice by Expert 2, we obtain two different NDs. As exemplified in Table 4, normal averaging would result in a combined score of 0.56, but by giving more importance to larger batches with a weighted average, the WND of 0.614 is closer to the assessment from the larger batch.
WND calculation example for two identical text pairs with different assessments from one single expert
A WND cannot only be calculated over different batches by a single annotator but also over batches by multiple annotators. This is done by following the same procedure of calculating the ND first (taking into account the scoring range R of the annotator in question), and then averaging over all batches using their weights W. However, the ranking of texts may differ between batches, resulting in inconsistencies (e.g. when t 2 is ranked as more difficult than t 1 in one batch, and as easier in another).
In order to calculate the WND for text pair (t 1, t 2), we consider all NDs for that pair in that specific order. This may result in negative ND values, because (t 2, t 1, ND) (from a batch where t 1 is considered more difficult than t 2) can be rewritten as (t 1, t 2, −ND) (following Formula 4). The same is true for any WND. If the WND of (t 1, t 2) is 0.5, then the WND of (t 2, t 1) will be −0.5.
To finish, boundary values for each WND were determined to select an assessment from the five-point scale LME, LSE, ED, RSE or RME (Table 2) for each text pair (t 1, t 2). Two boundary values are required: If the absolute value of a WND is below the first value, then the two texts in the text pair are regarded as equally difficult. Between the two boundaries, the readability of the texts is somewhat different and above the second boundary, there is much difference in readability between the two texts. The sign of WND determines whether the first or the second text is the more readable one (a negative WND indicates that t 1 is harder to read than t 2). In other words, if the two boundary values are determined as b 1 and b 2, the five-point scale RME, RSE, ED, LSE and LME corresponds to the following intervals: [−1, −b 2], ]−b 2, −b 1], ]−b 1, b 1[, [b 1, b 2[, [b 2, 1]. If b 2 is set at 0.5, a WND of −0.7 will fall in the [−1, −0.5] interval, which corresponds to the RME label.
Different strategies can be followed to choose these boundary values. A simple approach is to choose ad hoc values. A somewhat more sophisticated method is to use values that lead to the same proportions of equally difficult, somewhat different or much different text pairs as in the crowdsourcing data set. In order to do so, we projected the number of times each button is pressed in the Sort by Readability application on the Expert Readers data set. This resulted in the boundary values 0.077 and 0.403.
3.4 Probabilistic readability measure
For some readability prediction tasks, a set of text comparisons is sufficient to learn the task. However, other tasks, such as predicting the reading difficulty of a document in isolation, require an actual readability score assigned to each individual text. In the latter case, it is important that the assigned readability score is meaningful. We define a readability score which is easy to estimate from the data sets. The readability of a text ti can be identified as the probability Pe(ti) that ti would be assessed as easier than any other text, by any assessor, i.e. the proportion of times that ti was assessed as the easier text in a pair in which it occurs. Likewise, the unreadability (or difficulty) can be defined as the probability Pm(ti) that ti would be assessed as more difficult than any other text,
 \begin{equation}
\widehat{P_e}(t_i) = \frac{\#\lbrace ((t_i, t_j, a)\vee (t_j, t_i, a)) \Vert t_i \mbox{is easier than} t_j \rbrace}{\#\lbrace (t_i, t_j, a)\vee (t_j, t_i, a) \rbrace}
\end{equation}
Likewise, the probability that t 0 is more difficult than any text in the corpus can be estimated by
 \begin{equation}
\widehat{P_m}(t_i) = \frac{\#\lbrace ((t_i, t_j, a)\vee (t_j, t_i, a)) \Vert t_i \mbox{is more difficult than} t_j \rbrace}{\#\lbrace (t_i, t_j, a)\vee (t_j, t_i, a) \rbrace}
\end{equation}
We further use the notation P ·(·) for both the probability and its estimate. Note that in most cases Pe(ti)+Pm(ti)<1, because for most texts there are cases in which they are assessed as equally difficult as some other text in the corpus.
3.5 Correlations
In the previous sections we demonstrated how the output of both applications could be transformed into similar data sets, which now allows us to compare the readability assessments of the experts and the crowd and to verify whether crowdsourcing is indeed a viable alternative to expert labeling.
The data sets gathered through both applications, i.e. 8,568 text comparisons resulting from the Sort by Readability application (crowd) and 108 batches where at least five texts have been compared with the Expert Readers application (experts), were transformed to assessed text pairs (leading to 23,908 text comparisons), as described above in Section 3.3. This allowed us to know the actual probability measures (see Section 3.4) of each text according to both groups of assessors and discover some interesting correlations.
3.5.1 Experts versus crowd
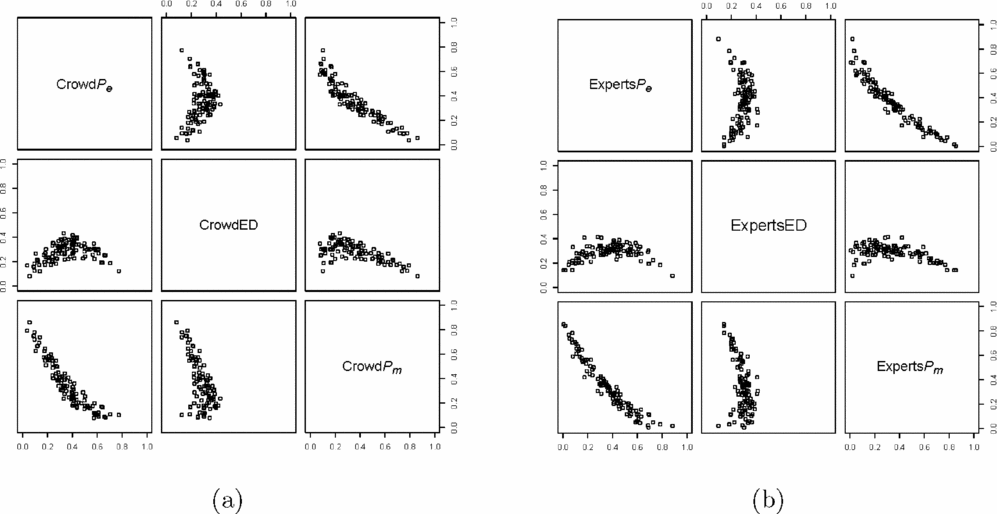
The proportions with which each text has been assessed as easier (Pe), equally readable (ED) or more difficult (Pm) for both the experts and crowd data set are shown in Figure 6. Since the lower left triangle and upper right triangle in both figures (Figures 6(a) and (b)) present the same information, we will limit the discussion to the lower left triangle. Each dot in the figures represents one text, so every plot in both figures represents 105 assessed texts. If we take for example text 6 in our crowd data set, this text has been assessed 0.77 times as easier, 0.12 times as equally difficult and 0.10 times as more difficult than any other text. These scores are visualised by the rightmost dot in the lower left plot of Figure 6(a), corresponding to 0.77 on the lower left x-axis (easier) and a 0.12 on the lower right y-axis (more difficult). The same text occupies the position 0.77 (easier) and 0.12 (equally difficult) in the left upper box and the position 0.12 (equally difficult) and 0.1 (more difficult) in the under middle box. We also observe that all plots show great similarity for both data sets.
Proportion of times each text was assessed as easier, equally difficult or more difficult than any other text: (a) for the Sort by Readability data, and (b) for the Expert Readers data. In both figures, the plots in the lower left triangle are transposed versions of those in the upper right triangle (the x- and y-axes are switched). They therefore present the same information.
In the next step we calculated the Pearson correlations between Pe and Pm, for both the Expert Readers data and the Sort by Readability data. We found that the correlation between Crowd Pe and Expert Pe is 86 percent and between Crowd Pm and Expert Pm it is 90 percent. We can conclude that two very similar data sets are obtained from the applications, which means that experts rank the texts from the corpus in a very similar order as the crowd does by comparing these texts.
3.5.2 Impact of the interface
Both groups were offered a different interface specifically tailored to their profile, i.e. experts used a rather complicated interface allowing them to enter (and comment on) fine-grained assessments whereas the crowdsourcing assessors were confronted with a very easy interface in which they had to compare two texts on a five-point scale. In order to verify that the assessments made by both groups were not biased by the different interface they used, we set up an experiment in which we asked five experts to assess twenty texts using both the Expert Readers and Sort by Readability applications. To objectify the selection of these twenty texts as much as possible, we again relied on the Flesch–Douma formula given in (1) (see Section 3.1).
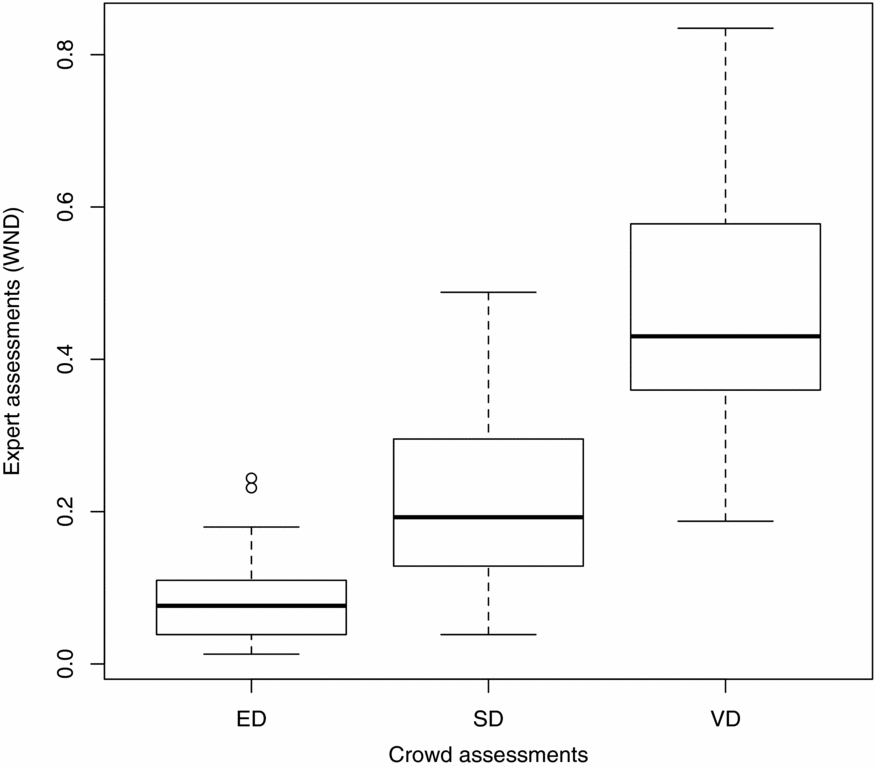
A comparison of the evaluations made in both applications is given in Figure 7. On the x-axis, three categories are plotted, taken from the crowdsourcing application evaluations: equally difficult (ED), somewhat different (SD) or very different (VD). We then looked up the WND scores (derived from the evaluations in the expert application) for all the text pairs present in a category, and plot these scores along the y-axis. This results in one boxplot per category, showing variability in (expert) WND scores assigned to pairs available in that (crowdsourcing) category.
Boxplot showing the correlation between the evaluations from one individual expert using both applications.
The boxplots of the three categories show some, but not much overlap. This indicates that the evaluations collected through one application are consistent with the ones collected through the other.
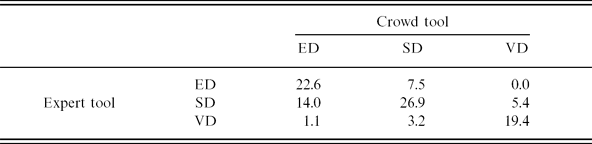
Another way of evaluating consistency across applications is presented in Table 5, which presents a confusion matrix between pairs assessed using the crowdsourcing application, and their equivalents from the expert data, converted and mapped to crowdsourcing evaluations using the method described in Section 3.3. Errors can be caused either by inconsistency on the part of the expert (evaluating text pairs differently in both applications), or due to the formula used for conversion from expert scores to pairwise comparisons.
Confusion matrix of the evaluations provided by one expert, taken from the crowdsourcing application and the sort-by-readability application (after conversion to pairwise assessments using the method described in Section 3.3). ED stands for equally difficult, SD for somewhat different and VD for very different. Values are in percent, over 93 pairs
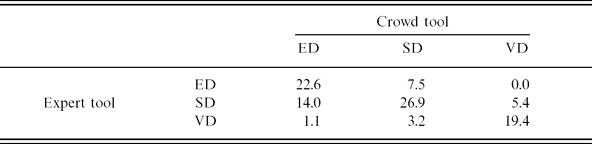
Out of ninety-three evaluated pairs, sixty-four (69 percent) show no errors. Confusion is greatest between pairs that are assessed as equally difficult or somewhat different (twenty errors on sixty-six pairs, or 30 percent) – the distinction between somewhat different and very different is easier (eight errors on fifty-one pairs, or 16 percent). Confusion between equally difficult and very different is only seen once (one pair in forty pairs, or 3 percent).
3.5.3 Genre versus readability
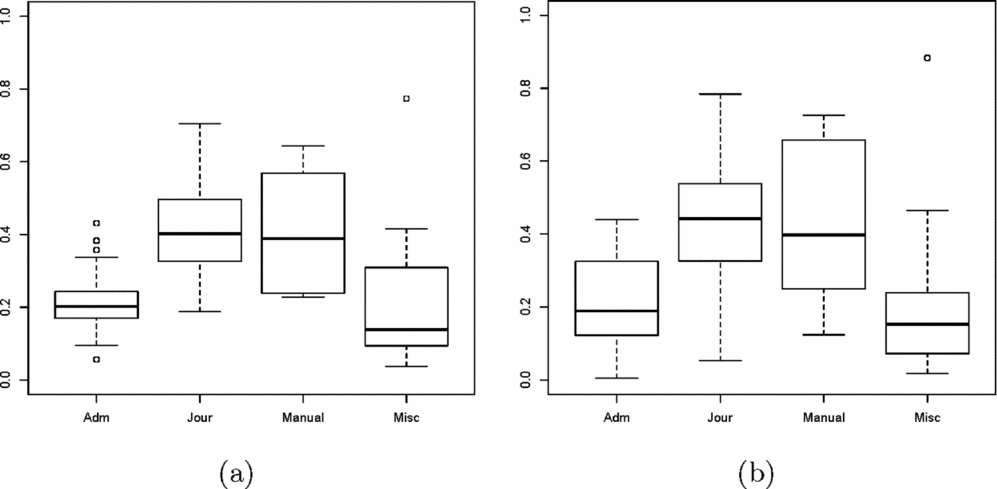
We also investigated how the experts and crowd assessed the texts from the different genres included in our readability corpus in order to find out whether the different genres represent various readability levels. If one genre, for example, would predominantly consist of texts being assessed as difficult and another genre contains texts which are mainly labelled as easy to read, the task of readability prediction might boil down to the task of genre classification. The assessments for different text genres are presented in Figure 8, in which both the expert and crowd texts are ranked per genre according to (a) the crowd Pe, and (b) the experts Pe (see Section 3.4. for the calculation of the probability measure Pe).
Ranking of the texts per genre according to (a) the crowd Pe, and (b) the experts Pe.
What strikes the eye immediately is the correspondence between the ranking of both (a) the crowd and (b) the experts. Furthermore, within each genre we also perceive a spread in readability levels; every genre contains texts that have been assessed as more or less readable. Globally, however, their does seem to be a consistency between both groups, some texts that are perceived as less or more readable occur more in particular genres. We clearly see that the crowd perceives administrative text as more difficult than journalistic texts, the same is perceived by the experts. This is an interesting finding we would definitely like to investigate in closer detail in future work.
3.5.4 Experts and crowd versus the classical readability formulas
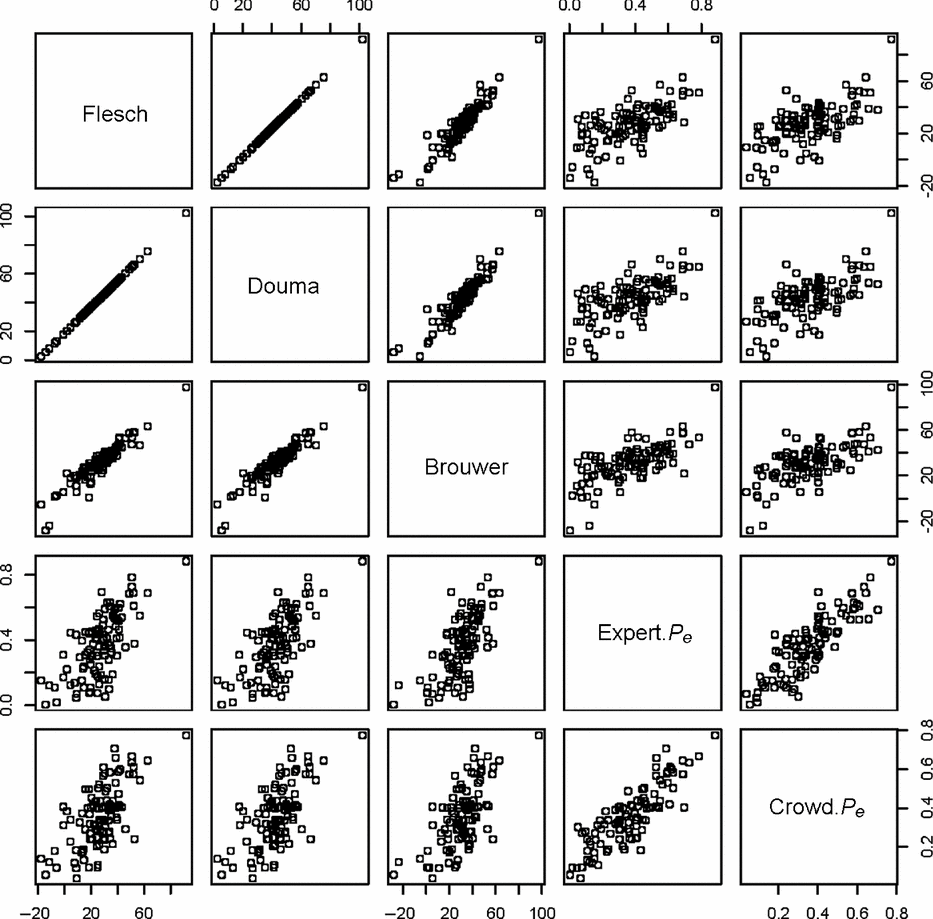
Figure 9 further illustrates that the readability formulas described in Section 3.1 Flesch (Reference Flesch1948); Douma (Reference Douma1960); Brouwer (Reference Brouwer1963) strongly correlate with each other. The top left corner of Figure 9, for example, compares the output of the Flesch Reading Ease formula with the predictions of Douma and reveals a very high correlation (reflected by the diagonal line). The bottom right corner, on the other hand, shows that the ranking of the texts according to their value for Pe correlates well between the crowdsourcing and the experts' data sets, which has also been demonstrated in Section 3.5.1. Furthermore, the correlation between each readability formula and each Pe value (represented in the six lower left plots and six upper right plots) is lower than the correlation between the Pe values themselves. These results confirm that both the experts and crowd assess the texts in a similar way, i.e. different than predicted by the various readability formulas. When designing a readability prediction system we should focus on predictors that provide better correlations, normally these will already outperform the readability formulas.
Scatterplots showing relations between three readability formulas and Pe for both data sets.
4 Predicting readability
In the previous sections, we showed how the assessments collected with both web applications can be converted into assessed text pairs and how such a set can be used to estimate the readability of text t, defined as the probability Pe(t) that t would be assessed as easier than any other text. This approach allows us to construct a set of data points of the form (t, Pe(t)) in which each individual text t receives its own readability score. We came to the conclusion that the two readability assessment applications lead to two very similar data sets, which indicates that the users of the crowdsourcing application and the expert users rank the texts from the corpus in a very similar order. In the results displayed in Figure 9, we saw that the correlation between different readability formulas and each Pe value was lower than the correlation between the Pe (or Pm) values themselves. Based on this observation, we concluded that a predictor outperforms the readability formulas if it performs better on both (expert and crowd) Pe (or Pm) values than on the readability formulas.
In this section, we develop a basic readability prediction system and show how the data collected via both applications can be used in two different machine learning setups, the first in which a given text receives a score/label and the second one in which texts are compared with each other.
4.1 Experimental setups
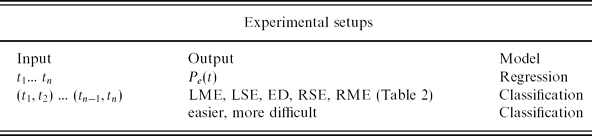
We experimented with two different experimental setups to show the possibilities of our data sets. In doing so, we believe that we cover both possible readability assessment scenarios. The first one allows to predict an absolute score to a given text, whereas the second one allows to compare two versions of a text. To this end, two different models were used: regression and classification. A schematic overview of all experiments is given in Table 6.
Schematic overview of different readability experiments
In the first experimental setup, the task consists in assigning an absolute readability score to a given text, and more specifically, in predicting the value of Pe(t) (see Section 3.4) for a text t.Footnote 10 In order to do so, we experimented with regression as a supervised learning model for readability prediction. Regression is a technique to predict a continuous value on the basis of a range of features. Different algorithms to perform the regression task for readability prediction, i.e. logistic regression, SVM regression etc., were recently used by vor der Brück et al. (Reference vor der Brück, Hartrumpf and Helbig2008), Heilman et al. (Reference Heilman, Collins-Thompson and Eskenazi2008), François (Reference François2009), Kanungo and Orr (Reference Kanungo and Orr2009) and Kate et al. (Reference Kate, Luo, Patwardhan, Franz, Florian, Mooney, Roukos and Welty2010).
The second experimental setup aims at comparing the readability of text pairs. We defined two different subtasks.
The aim of the first experiment was to predict the correct assessment a from the five-point scale from Table 2 for the text pair (ti, tj). Recall however that the data sets of assessed text pairs collected with annotation tools from Section 3.2 might contain inconsistencies because different users might disagree in their assessment of the same text pair. For this reason, we considered two alternatives of the task, namely (1) a task in which we randomly sampled text pairs that occur more than once in the data so as to avoid having perfect matches between the training and test data, and (2) a task in which we kept one assessment per text pair, calculated as the average over all available assessments for that text pair. The assessments for text pairs (ti, tj) and (tj, ti) are thereby merged. To calculate the average assessment, scores −2, −1, 0, 1 and 2 were associated with the LME, LSE, ED, RSE and RME classes respectively. The mean of these scores per pair of texts was rounded and mapped back to a single assessment.
In the second experiment, the goal was to determine for a given text pair whether ti was easier or more difficult than tj, thus recasting the five-class classification task as a binary choice. Text pairs which were assessed as equally difficult were discarded from the data set. Similar work on binary classification was, for example, done by Pitler and Nenkova (Reference Pitler and Nenkova2008) and Tanaka-Ishii et al. (Reference Tanaka-Ishii, Tezuka and Terada2010). A possible application would be, for example, to integrate a binary classifier into an editing environment to detect whether edited versions of a text are more readable than the original. Again, we experimented on randomly sampled text pairs and on text pairs whose readability scores were averaged.
We experimented with different machine learning algorithms to perform the machine learning tasks. For the regression task, we used linear regression whereas the classification tasks were performed using k-nn and random forests. For each algorithm, we used their implementation in GNU R.Footnote 11
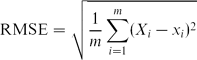
Since the error measure is typically different in the context of supervised regression than for classification, we evaluated the performance of algorithms carrying out the regression task with the root mean squared error (RMSE) as the error to be optimized:
 \begin{equation*}
\text{RMSE} = \sqrt{\frac{1}{m} \sum _{i=1}^m (X_i - x_i)^2}
\end{equation*}
The evaluation of the classification experiments was done by measuring the classification accuracy (CA).
4.2 Features
A feature set has been extracted mainly by capturing lexical and morpho-syntactic information. Previous research has shown that although more complex linguistic features are useful Feng et al. (Reference Feng, Jansche, Huenerfauth and Elhadad2010), the most predictive ones are lexical in nature (e.g. Pitler and Nenkova Reference Pitler and Nenkova2008; Zeng et al. Reference Zeng, Goryachev, Tse, Keselman and Boxwala2008; Kate et al. Reference Kate, Luo, Patwardhan, Franz, Florian, Mooney, Roukos and Welty2010) and therefore constitute a viable base feature set. The following features were incorporated:
• Basic features representing text characteristics, which are also popular in the classical readability formulas, were extracted, including the average number of words per sentence, the average number of syllablesFootnote 12 and characters per word, the proportion of words occurring in a list of the most frequently used words in Dutch and the proportion of words with three or more syllables.
• Character bigram and trigram frequencies were calculated. The underlying idea is that more deviation from the n-gram frequencies found in a reference corpus may result in a less natural looking text. This information can be calculated as the sum of the average character bigram and trigram frequencies per word on the basis of a large reference corpus divided by the text length of the text under consideration. We used the Twente Nieuws CorpusFootnote 13 (TwNC) as a reference corpus.
• Using the above-mentioned corpus, three additional statistical features were also extracted to detect those words that are specific to a text, based on corpus comparison: the mean term frequency-inverse document frequency (TF-IDF) value of all tokens in the texts, the average Log-Likelihood (LL) ratio and Mutual Information.
TF-IDF originates from information retrieval and measures the relative importance or weight of a word in a document Salton (Reference Salton1989). We calculated TF-IDF for all terms in the readability corpus, and to calculate the IDF we enlarged the readability corpus with all texts of the TwNC. Given a document collection D, a word w and an individual document d in D,
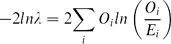
where f w,d equals the number of times w appears in d, |D| is the size of the corpus and f w,D equals the number of documents in D in which w appears Berger et al. (Reference Berger, Caruana, Cohn, Freitag and Mittal2000). Calculating TF-IDF should thus enable us to extract those specific words in our texts that have much lower frequencies in the balanced background corpus. In short, the mean TF-IDF value of all the words in a large corpus estimates the mean importance of a word in any text. The Log-Likelihood ratio discovers keywords which differentiate between corpora, in our case the TwNC corpus and the input text/corpus. We first produced a frequency list for each corpus and calculated the Log-Likelihood statistic for each word in the two lists. This was done by constructing a contingency table (see Table 7), where c represents the number of words in the TwNC corpus and d corresponds to the number of words in our corpus. The values a and b are known as the observed values (O). \begin{equation*}
W_d = f_{w,d} \cdot \log (|D|/f_{w,D})
\end{equation*}
Table 7.
Contingency table to calculate Log-Likelihood
Next, the expected value for each word is calculated as follows:
where N corresponds to the total number of words in the corpus and i corresponds to single words. The observed values correspond to the real frequency of a single word i in the corpus. So for each wordi, the observed value Oi is used to calculate the expected value. Applying this formula to our contingency table (with N 1 = c and N 2 = d) results in Finally, the resulting expected values are used for the calculation of the Log-Likelihood: which equates to More information about the calculation of the expected values and Log-Likelihood can be found in Rayson and Garside (Reference Rayson and Garside2000). Since the reference corpus models usual everyday Dutch language, the intuition here is that texts with an overall unnatural use of words will be detected by the Log-Likelihood ratio.
\begin{equation*}
E_{i}= {\frac{N_{i}{{\sum _{i}O_{i}}}}{{\sum _{i}N_{i}}}}
\end{equation*}
\begin{equation*}
E_{1} = c \cdot (a+b)/(c+d)
\end{equation*}
\begin{equation*}
E_{2} = d \cdot (a+b)/(c+d)
\end{equation*}
\begin{equation*}
-2ln \lambda = 2 {\sum _{i}O_{i} ln \left({\frac{O_{i}}{E_{i}}}\right)}
\end{equation*}
\begin{equation*}
LL = 2 \cdot \left(a \cdot \log \left({\frac{a}{E_1}}\right)\right) + \left(b \cdot \log \left({\frac{b}{E_2}}\right)\right)
\end{equation*}
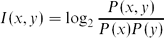
Finally, Mutual Information attempts to indicate how informative the co-occurrence of two words close to each other in a text is apart from the information of each individual word. If two points (words), x and y, have probabilities P(x) and P(y), then their Mutual Information, I(x,y) is defined to be:
We follow the implementation of Church and Hanks (Reference Church and Hanks1990) who estimated word probabilities P(x) and P(y) by counting the number of observations of x and y in a corpus, f(x) and f(y), and normalizing by N, the size of the corpus (TwNC). Joint probabilities, P(x,y), are estimated by counting the number of times that x is followed by y in a window of w words, fw(x,y), and normalizing by N. The window size parameter allows us to look at different scales. For our system, co-occurrences of words with 1 to 4 positions from each other were taken into account. The mean Mutual Information is a measure for the mutual information on the text level.
\begin{equation*}
I{(x,y)} = \log _2 {\frac{P(x,y)}{P(x)P(y)}}
\end{equation*}
• Finally, to account for morpho-syntactic characteristics, another thirteen features were included. These correspond to the proportion of tokens referring to the thirteen main part of speech categories in DutchFootnote 14 (i.e. all content words, articles, conjunctions, numerals, prepositions and interjections). Should this proportion of words with a certain part of speech differ from the expected value, the structure of the text and of the sentences in the text may differ from a reader's expectation.






All the above-mentioned features consist of numeric values. For the task departing from a text t as input, the regression algorithms are given the numerical feature vector corresponding to t as described above. For the tasks which depart from a pair of texts (t 1, t 2) as input, an input feature vector is derived as the difference of the vectors corresponding to t 1 and t 2 respectively.
5 Results and discussion
In order to evaluate the performance of the machine learning algorithms on the three different readability assessment tasks listed in Table 6, we calculated two different baselines. As our first baseline, a language modelling (LM) approach was used. A generic language model was generated from the TwNC using the SRILM package with standard settings Stolcke (Reference Stolcke2002) and by taking into account all n-grams up to order 5. Following Kate et al. (Reference Kate, Luo, Patwardhan, Franz, Florian, Mooney, Roukos and Welty2010), we use the score assigned to a document by a generic language model and normalize this document-level score or perplexity by the number of words (to rule out document length). We calculate this normalized document probability NP(D) as follows:
 \begin{equation*}
NP(D) = (P(D|M))^{\frac{1}{|D|}}
\end{equation*}
The K-fold cross validation was used as the testing method. For our experiments, the readability data were split into ten folds, so k was set to 10. In this paper, it is not our intention to optimise the algorithms to achieve the best possible results for the learning tasks at hand, but rather to illustrate the usefulness of the data collected with the tools from Section 3.2 in a machine learning setup, and to provide a comparison of our approach with two baselines. Note that exactly because of the public unavailability of readability assessment data sets, such comparative evaluations are scarce in the literature.
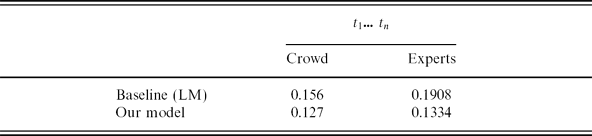
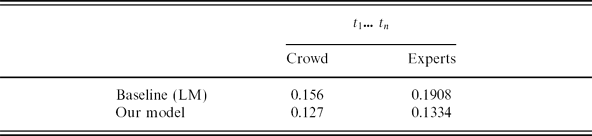
The results for regression are shown in Table 8. They show that our model outperforms the generic LM baseline for both the experts and crowd data sets. Since our underlying corpus incorporates texts from different genres, we hypothesize that features that help to identify the genre of a given text might improve the results of both approaches. A similar conclusion was drawn by Kate et al. (Reference Kate, Luo, Patwardhan, Franz, Florian, Mooney, Roukos and Welty2010) when contrasting generic with the genre-specific language models. Furthermore, we hypothesize that the usefulness of our model which currently incorporates rather shallow text characteristics will further increase if a syntactic, pragmatic and semantic layer will be added to the feature set.
RMSEs for the regression task predicting the Pe(t) value for a given text
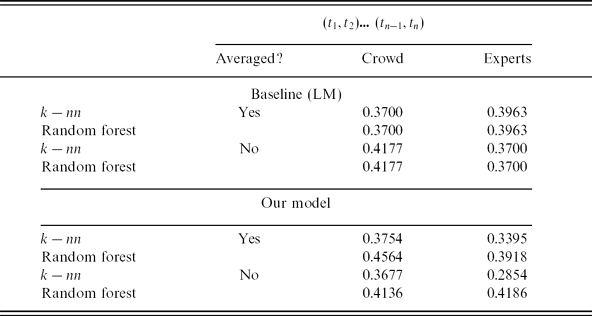
An overview of the classification accuracies for the two experiments involving text pairs are presented in Tables 9 (multiclass) and 10 (binary). Since there seems to be no viable way to unambiguously transform the results of a readability formula for two texts to a five-point scale classification of a given text pair, we only calculated this baseline for the binary classification experiments. Overall, we can observe in Table 9 that the top accuracies obtained on both the experts and crowd data sets are quite similar. Furthermore, we see that the Random forest classifier outperforms the k−nn classifier on this task, although these results could be subject to change in case parameter optimization was performed for both classifiers. The best result, i.e. 45.64 percent, is obtained by the Random forest classifier on the averaged crowd data. The rather low scores on this task can be explained by the fact that we used a rather strict evaluation in which each text pair had to be assigned to the exactly right class. Deviations of one class (e.g. ED being classified as RSE) were penalized equally severely as deviations of more classes (e.g. ED being classified as RME).
Classification accuracy for the experiment in which a correct assessment from the five-point scale from Table 2 had to be assigned to a given text pair
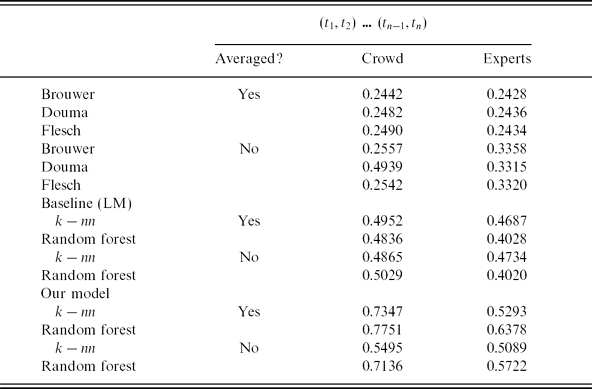
Classification accuracy for the binary classification experiment involving text pairs
In the binary classification experiments, we contrasted both the language modelling approach and our model with the classical readability formulas. The results as displayed in Table 10 clearly show that the classical formulas perform poorly on this task. The baseline language modelling approach and our model, which currently also rely on rather shallow text characteristics and/or statistical information derived from general domain corpora, outperform the readability formulas. We expect that this gap will become even larger when incorporating deeper syntactic and semantic knowledge. A possible conclusion might be that the classical readability formulas, which are typically designed for selecting reading material for language learners, are clearly not fit for measuring the readability level of generic text. Furthermore, although averaging does not seem to help for the LM approach, it does so for our model on both the expert and crowd data sets. Similar to the five-class classification task, the best performance is obtained by the Random forest classifier on the averaged crowd data, i.e. 77.51 percent.
Overall, we can conclude from the experiments that the data sets obtained through both methodologies yield similar results. Though our model already outperforms the LM baseline, we are strongly convinced that additional syntactic, semantic and pragmatic knowledge should be incorporated to have a more diversified view on the complexity of a given text.
6 Conclusions and future work
In this paper, we explored two different methodologies to collect readability assessments for texts in a selected corpus: a lightweight crowdsourcing approach and a more classical expert labeling approach. Since we intended to collect multiple assessments per text in order to level out a given reader's background knowledge and attitude as much as possible, we hypothesized that a crowdsourcing approach could be a viable alternative to expert labels. The corpus itself incorporates different genres.
As opposed to most assessment strategies which assign an absolute score to a given text, we opted for an approach in which all texts in the corpus are compared to each other by different people and by using different comparison mechanisms, i.e. pairwise comparison and ranking. To the best of our knowledge, only Tanaka-Ishii et al. (Reference Tanaka-Ishii, Tezuka and Terada2010) used a similar, yet more coarse-grained pairwise comparison strategy. A comparison of the readability assessments collected with both methodologies revealed that the data sets are very similar, a similarity which was numerically confirmed by an analysis with Pearson's correlation coefficient. This allowed us to conclude that both users of the crowdsourcing application and experts rank the texts from the corpus in a very similar order.
Since the corpus itself incorporates different genres, we also investigated whether the various genres actually represented various readability levels. Our results show that this was indeed the case. However, when looking at the actual assessments, we did notice a consistency between both groups that readability might be linked to text genre. In future work, we will closely investigate features representing the underlying differences between texts within a genre, i.e. genre-independent features, if these exist at all.
For some readability prediction tasks, e.g. in case an old text is compared to its easier, rewritten version, a set of text comparisons is sufficient to learn the task. However, other cases require a readability score assigned to each individual text, e.g. in case one wishes to determine the readability of a given patient information leaflet, manual, insurance policy etc. In order to account for this type of tasks, we presented a novel definition of readability as a probability which is easy to estimate from the data sets. For a text t 0 in the readability corpus, the probability that it is easier/more difficult than any other text was estimated by the proportion of times that t 0 was assessed as easier/more difficult than any other text in the corpus.
Finally, we demonstrated how the data collected via both applications can be used in various machine learning setups to perform regression and classification. These experiments, however, should be considered as a basic set of experiments using rather shallow features. Adding a pragmatic and a semantic layer to the feature set, as well as performing a fine-grained analysis of the predictive power of individual features, feature selection and feature construction are interesting topics for future research. Moreover, we would like to further combine and compare our approach with more advanced statistical language models which have turned out to be good predictors in previous research Schwarm and Ostendorf (Reference Schwarm and Ostendorf2005); Feng et al. (Reference Feng, Jansche, Huenerfauth and Elhadad2010). In future work, we will also elaborate on how the readability assessments can be processed. Is it possible, for example, to weigh annotators, based on their assessments?
Note that we used a specific readability corpus and specific readability assessment applications. By including several genres in the data, however, we aimed to make our text collection as broad and generic as possible. As with any other classification task, which is trained on a specific data set, the porting to another domain (say, for example, to legal texts or children's books) evidently necessitates domain adaptation of the classifier. To tailor readability prediction to specific settings, our approach is easily extensible to specific textual domains and specific target audiences. To assess the readability of only legal texts, for example, a readability corpus containing such texts can be composed. The proposed methodology can also be adapted to a specific purpose, e.g. to promote safety by using readable instructions in manufacturing environments. In that case, the question asked to the experts should be, to what degree the instructions promote safety, and not only how readable the instructions are?
We conclude that readability assessment by comparing texts is a polyvalent methodology, which can be adapted to specific domains and target audiences if required.
Acknowledgments
This research was funded by the University College Ghent Research Fund (the HENDI project) and the Department of Economy, Science and Innovation of the Flemish Government (the Stylene project). We would like to thank the reviewers for their invaluable comments and insights. Furthermore, we thank everyone who contributed to our research by using our web applications.