1. Introduction
Various practical engineering problems aroused the initial research on the liquid–solid involving droplet impact, micro-jet impact in cavitation erosion, etc., such as erosion of blades in a steam turbine, erosion of aircraft wings and erosion of ship propellers (Adler Reference Adler1979; Zhou et al. Reference Zhou, Li, Chen, Xu, Hui and Zhang2009). Based on theoretical and experimental studies on the loads and damage abilities of the high-speed liquid jet (Field & Lesser Reference Field and Lesser1977; Preece Reference Preece1979), water jet technology has made rapid progress and is used in many beneficial ways, including rock cutting, mining, oil and gas drilling, cleaning, and so on (Mabrouki, Raissi & Cornier Reference Mabrouki, Raissi and Cornier2000; Chizari, Al-Hassani & Barrett Reference Chizari, Al-Hassani and Barrett2008; Chizari, Barrett & Al-Hassani Reference Chizari, Barrett and Al-Hassani2009; Ge et al. Reference Ge, Mei, Jia, Lu and Xia2014; Lin et al. Reference Lin, Yan, Zhu, Zhou, Zou, Guo and Liu2015). More possibilities and potentials for engineering applications of the high-speed water jet are still developing, one of which is ice breaking by a high-speed water jet impact proposed in this paper.
Before introducing ice breaking by a high-speed water jet impact, it is important to understand the load characteristics of the liquid jet impacting on a rigid wall or an elastic wall, which are generally the two typical boundaries. A rigid wall is the simplest boundary. Cook (Reference Cook1928) discovered the ‘water-hammer effect’, and believed this effect was the main cause of corrosion damage to metals. The original water-hammer pressure  ${P_w}$ was defined as (Cook Reference Cook1928)
 \begin{equation}{P_w} = {\rho _w}cV,\end{equation}
where  $\rho_{w}$ is the density of the liquid, c is the sound velocity in the liquid and V is the impact velocity.
When a high-speed liquid jet impacts onto a flat wall, an initial pressure peak is caused on the wall owing to the compressibility of fluid and the shock wave propagation in different media. Some researchers measured this compressible pressure on the wall and related the peak of the compressible pressure P 1 to the water-hammer pressure  ${P_w}$ as (Ming Reference Ming2014)
 \begin{equation}{P_1} = \alpha \beta \gamma {P_w} = \alpha \beta \gamma {\rho _w}cV,\end{equation}
where  $\alpha $ represents the influence of jet shape, and
 $\beta $ and
 $\gamma $ represent the influence of wall flexibility coefficient and jet impact velocity, respectively. The duration of compressible pressure is very short (Bowden & Brunton Reference Bowden and Brunton1961). Soon afterwards, the compressibility effect of the fluid becomes very small and can be ignored. The incompressible pressure on the wall is much smaller compared with the compressible pressure. The incompressible pressure stage can be further divided into two stages: the initial incompressible stage and late incompressible stage. Wu (Reference Wu2001) analysed the initial incompressible pressure distribution of a jet impinging on a rigid plate within the theory of unsteady incompressible potential flows. In the small-time expansion, there is a constant pressure
 \begin{equation}{P_{2\_1}} = {\rho _w}{V^2}\end{equation}
at the initial moment. The results were verified by his simulation results of the boundary element method. In the late stage, a stable Bernoulli stagnation pressure is formed (Field, Lesser & Dear Reference Field, Lesser and Dear1985):
 \begin{equation}{P_{2\_2}} = {P_s} = {\rho _w}{V^2}/2.\end{equation}
As a result, it is not a surprise that the pressures on the wall for different stages, that is, initial compressible (1.2), initial incompressible (1.3) and late incompressible (1.4), are different.
Semenov, Wu & Oliver (Reference Semenov, Wu and Oliver2013) investigated the formation of the splashing jet at the initial stage after the collision of two liquids with the same density, based on the velocity potential theory with fully nonlinear boundary conditions, in which the liquid was assumed to be inviscid and incompressible. When the two jets were symmetrical, it was equivalent to a jet impacting on a rigid wall. The streamlines and pressure distributions along the line of symmetry and near the root of the splash jet were obtained. Dyment (Reference Dyment2015) studied the impact of a compressible liquid against a rigid body and presented a model with compressible effects, which applied to jet fronts and body profiles of any shape. Zhao, He & Li (Reference Zhao, He and Li2021) analysed the influence of the geometrical shape of the rigid body (including a concave V-shaped surface, concave spherical surface, V-groove surface and spherical groove surface) on the impact pressure under the action of a water jet by theoretical and finite element methods. They also obtained the relationship between the peak pressure and opening angle, jet velocity, jet radius and radius of concave sphere under different concave surfaces.
Based on the rigid wall, the elastic or elastic-plastic wall is another common boundary. The elasticity of the wall influences the load characteristics of the high-speed water jet. Korobkin (Reference Korobkin1996) and Korobkin, Khabakhpasheva & Wu (Reference Korobkin, Khabakhpasheva and Wu2008) carried out many studies on water jet problems by using a linear wave equation, including the effects of two-dimensional and three-dimensional water jets on rigid and elastic structures, and analysed the effects of the impact conditions and the elastic properties of the plate on the magnitudes of the elastic deflections and bending stresses. It was found that the elastic plate responded to the jet impact in vibration with periods longer than those of free vibrations, because of the ‘added mass effect’. Furthermore, the location of the impact region had little effect on the period of the vibration of the plate. Based on a Euler/Lagrangian coupling (CEL) algorithm, Mabrouki et al. (Reference Mabrouki, Raissi and Cornier2000) and Maniadaki et al. (Reference Maniadaki, Kestis, Bilalis and Antoniadis2007) established finite element models on an elastic-plastic flat surface, and then analysed the morphological changes of the water jet and the stress–strain relationship of the target plate during the impact process. Sun, Hu & Hu (Reference Sun, Hu and Hu2013) adopted a doubly asymptotic approximation for the governing wave equation to study the initial impact problem of a compressible water column on an elastic plate. The nonlinear boundary conditions were used to update the unknown free surface, and the pressure and displacement of the plate centre were analysed and discussed.
Another important part of the research focuses on the damage characteristics of the high-speed liquid jet on complex boundaries. Bowden & Brunton (Reference Bowden and Brunton1961) were probably the first to describe the types of failure of polymethyl methacrylate (PMMA) materials systematically subjected to high-velocity liquid impact. They distinguished the following types of deformation and failure: circumferential surface fracture; sub-surface flow and fracture; large-scale plastic deformation (for ductile materials only); shear deformation around the periphery of the impact zone; and failure owing to the reflection and interference of stress waves. On this basis, a series of studies were carried out on different materials (Bowden & Field Reference Bowden and Field1964; Bourne Reference Bourne2005; Foldyna et al. Reference Foldyna, Sitek, Scucka, Martineca, Valicek and Palenikova2009). Shi, Takayama & Nagayasu (Reference Shi, Takayama and Nagayasu1995) used a pressure sensor to measure the impact pressure of a water jet impacting on a solid surface. The supersonic water jet was produced by a compact gas gun and the damage and perforation of copper and brass plates were recorded. It was pointed out that for the initial liquid–solid impact process, the main cause of the bending stress and structural deformation of the specimen was the propagation of the shock wave. The diameter of the perforation on the metal plate under the jet was several times that of the nozzle. Field et al. (Reference Field, Camus, Tinguely, Obreschkow and Farhat2012) explained that the erosion of metals and alloys at a lower impact velocity may be caused by some of the cavities formed inside the liquid collapsing onto the solid surface (through high-speed photography). In addition, as erosion progresses, the lateral flow of fluids can add shear stresses on the surface steps and imposed hydraulic loads in cracks and crevices can speed up the damage. Hsu et al. (Reference Hsu, Liang, Teng and Nguten2013) investigated the deformation of a water jet with a spherical head impacting on a plate made of PMMA, stainless steel and aluminium, and summarized the rules between the diameters and depths of depressions and the mechanical properties of these materials by the CEL method. In recent years, owing to the needs of engineering applications, a series of studies have been done on the interaction between a water jet and rock (Liu et al. Reference Liu, Liu, Chen and Lin2015; Wang et al. Reference Wang, Wang, Zhou and Chen2017, Reference Wang, Li, Ni, Liu and Dou2020; Wu et al. Reference Wu, Yu, Zhang and Liu2019). The focus was placed on the rock-breaking behaviours under water jet impact, which included the effects of boundary conditions, impact velocity, and micro-structural and micro-mechanical properties.
From the view of ice mechanics, ice can be seen as one of the most complex materials in nature (Timco & Weeks Reference Timco and Weeks2010). A natural ice sheet contains a lot of defects including pre-existing cracks, inclusions, pores, grain boundaries and others (Geoge Reference Geoge1986; Grishina & Buch Reference Grishina and Buch2004). The defects have great effects on the properties and mechanical behaviours of the ice sheet and make the natural ice sheet difficult to directly simulate in a laboratory (Moslet Reference Moslet2007; Wang et al. Reference Wang, Zou, Wang, Shi, Luo and Lu2019). To avoid the influences of these defects, an alternative method in a laboratory is to make a so-called ‘pure’ ice sheet by using de-aired fresh water (Cui et al. Reference Cui, Zhang, Wang and Khoo2018; Yuan et al. Reference Yuan, Ni, Wu, Xue and Zhang2020; Ni et al. Reference Ni, Pan, Yuan and Xue2021).
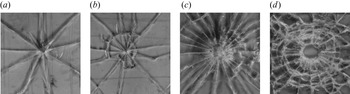
Owing to the complex properties of ice materials, it is necessary to review the failure effects of impacting on ductile and brittle materials before analysis of ice breaking by a high-speed water jet. As one may know, ice exhibits various properties, such as brittleness or ductility, at different strain rates (Schulson Reference Schulson1999). Glass can be regarded as a typical brittle material and is very sensitive to the impact loading rate (Brar, Rosenberg & Bless Reference Brar, Rosenberg and Bless1991), which is similar to ice on this point. Bouzid, Nyoungue & Azari (Reference Bouzid, Nyoungue and Azari2001) investigated glass plates subjected to impact at different loading rates by two methods: the normalized drop ball test (low loading rate) and a compression split Hopkinson pressure bar (high loading rate), as shown in figure 1. A damage model characterized by the volume of impact damage was proposed, and the damage development and fragmentation of glass plates were divided into three stages: first, for a loading rate of low intensity and long impact duration, simple fragmentation occurred, where the initiation of cracks were observed at the same location of the micro-defect without crack branching; second, multistage fractures caused by the bifurcation of many cracks appeared, and radial and tangential cracks were formed; the final stage was to complete the perforation. For ductile materials, Kamarudin & Hamid (Reference Kamarudin and Hamid2017) carried out an experimental investigation on thin plates made of carbon fibre reinforced plastic (CFRP) impacted by hemispherical and blunt projectiles at various velocities. It was also observed that a hemispherical projectile split a target plate at a lower impact velocity compared with a flat projectile. This was because tensile failure was the main damage form for a hemispherical projectile impact while shear failure was the main damage form for a flat projectile. In addition, different from the complex propagation of cracks in brittle materials, only a hole at the impact zone and the central tearing damage along the hole were observed in the experiments. For ice, the high-speed water jet impact is a typical high strain rate problem. For a high strain rate, ice presents a more brittle property (Schulson Reference Schulson1999). Therefore, it will be found that the crack and damage forms of ice will be more like to those of brittle materials, such as glass at high strain rates, rather than those of ductile materials. However, the specific damage forms and mechanisms are different, which will be discussed in this paper.
Photographs of glass samples subject to different loading modes: (a) and (b) tests by drop ball (low loading rates); (c) and (d) tests by Hopkinson bars (high loading rates) (Bouzid et al. Reference Bouzid, Nyoungue and Azari2001).

Ice breaking has become one of the main problems faced by ships and other equipment operating in the ice-covered water region (Riska Reference Riska2011; Huang et al. Reference Huang, Sun, Ji and Tian2018; Xue et al. Reference Xue, Liu, Li and Han2020). One of the simplest and earliest ice-breaking methods is to break ice by using a rod, which can be seen as either a concentrated load or a distributed load according to the ratio between the diameter of the rod and the ice thickness (Sodhi Reference Sodhi1995). A series of studies have been done to analyse ice breaking under concentrated and distributed loads (Assur Reference Assur1956; Frankenstein Reference Frankenstein1963; Sodhi Reference Sodhi1995; Masterson Reference Masterson2009). It was generally recognized that there are three stages of ice cover failure under static concentrated and distributed loads: the first is radial cracking, as a result of large bending moments; the second is circumferential cracking at some distance away from the load; the third is break up of an ice plate along radial and innermost circumferential cracks. These three stages are classical for the failure of an ice plate under a vertical load, which are also found to be suitable for the high-speed water jet loads in this paper, although the reasons are different. Chuang (Reference Chuang2021) analysed the process of vertical downward static loads breaking an ice plate with and without water underneath, based on experimental and numerical methods. The results showed that the water under the ice plate had little influence on the failure patterns of the ice, but had a significant influence on the maximum load in the vertical ice-breaking process. The maximum load with water underneath was approximately 1.3–1.6 times that without water under different loading speeds.
On the basis of static loads, impact loads of high-speed projectile bodies have also been adopted to break ice (Arakawa Reference Arakawa1999; Arakawa, Shirai & Kato Reference Arakawa, Shirai and Kato2000; Iijima et al. Reference Iijima, Kato, Arakawa, Maeno, Fujimura and Mizutani2013; Suzuki, Namba & Watanabe Reference Suzuki, Namba and Watanabe2016). Arakawa (Reference Arakawa1999) and Arakawa et al. (Reference Arakawa, Shirai and Kato2000) studied the ice fracture of an ice plate under impact of a cylindrical projectile with a velocity of over 3000 m s−1. It was observed that the velocity of the shock wave caused by the impact in the ice was approximately 3900 m s−1 and the characteristic delay time for crack nucleation was approximately 3 μs at a shock pressure of 80 MPa, while the propagation velocity of the fracture region was 2000 to 3500 m s−1, expanding from the impact point. It was also found the ice damage caused by the high-speed impact may include shear damage extending radially from the contact point, radial crack propagation and tensile damage at the rear surface owing to reflected waves (Arakawa et al. Reference Arakawa, Shirai and Kato2000). These damages are common for the ice under shock wave load, no matter whether caused by projectile bodies or by the water jet.
In addition, the ice plate in this study was floating on the water surface, so it is helpful to review relevant work on a floating ice plate under impact loads. The vertical impacts on floating ice plates were initially studied by using the linear theory of potential flows (Kozin & Pogorelova Reference Kozin and Pogorelova2006; Tkacheva Reference Tkacheva2007; Pogorelova Reference Pogorelova2010). For example, Pogorelova (Reference Pogorelova2010) analysed the plane problem of the impact of shock impulses on a viscoelastic plate floating on the surface of a fluid body. The effects of pulse loads on the deflection and stress of the ice plate covering the water were considered, and the effects of water depth, plate thickness and pulse loading conditions on the bending stress of the plate were also analysed. Khabakhpasheva et al. (Reference Khabakhpasheva, Chen, Korobkin and Maki2018) studied the vertical impact problem by a rigid body onto a short floating ice floe with a fully nonlinear computational fluid dynamics (CFD) method, in which the ice floes were modelled as rigid plates and the impact was symmetric. Khabakhpasheva & Korobkin (Reference Khabakhpasheva and Korobkin2021) further studied the elastic responses to impact in this problem for larger ice floes, within the linear theory of hydroelasticity. The magnitudes and distributions of the ice strains were studied depending on the ice plate length, plate thickness, shape of the rigid body, place of impact and the impact speed. Another important part was that a model was provided in their study to investigate the ice response to impact on the ice surface in a wide range of impact conditions.
On the basis of conventional ice-breaking methods, such as icebreakers, new auxiliary methods (Ni & Wu Reference Ni and Wu2020) are always being pursued and studied to improve the ice-breaking capability. Inspired by strong damage capability of a high-speed water jet in other areas, we propose a potential ice-breaking method by using a high-speed water jet. In the future, we imagine that the icebreakers will carry high-speed water jet generators to fracture or crack the thick ice in a large area afore the vehicles. This will effectively weaken the ‘breaking ice resistance’ of the icebreaker sailing in the ice area. Ice breaking by using a high-speed water jet is a multiple-interface interaction problem, which includes a water–gas interface and an ice–water interface, and presents a great challenge for theoretical and numerical studies. The experimental method will be a direct way. In addition, the shock wave and bubble jet have been found to be effective in ice breaking by using high-pressure bubbles (Cui et al. Reference Cui, Zhang, Wang and Khoo2018, Reference Cui, Chen, Su and Ma2020; Yuan et al. Reference Yuan, Ni, Wu, Xue and Zhang2020; Ni et al. Reference Ni, Pan, Yuan and Xue2021), which also lays a strong foundation for ice breaking by using a high-speed water jet. In this paper, the loading characteristics of a high-speed water jet and its damage on an ice plate in a water tank in a cold room were studied through the homemade experimental device. Most attention was paid to the characteristics of ice cracking and fracturing under various parameters, including initial water pressure, the distance between jet nozzle and ice plate, ice thickness and size. The relationships between the damage modes and those parameters were also investigated.
2. Experimental set-up
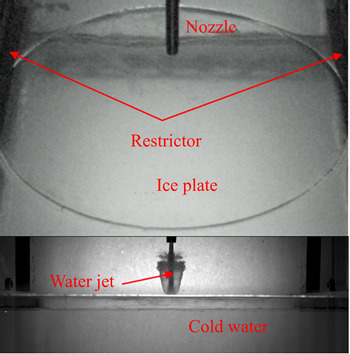
The schematic of the experimental set-up is shown in figure 2. A series of experiments were performed in a transparent cubic water tank with principal dimensions of 0.6 m in length. The water tank was made of acrylic glass, which guaranteed optical accessibility in the experiments. A piece of an ice plate was placed at the centre of the water surface, which was made from fresh water with the diameter D and thickness  $\tau $. The ice plate was placed on two submerged rigid girders with a span L, as shown in figure 3, The upper surfaces of the girders were
 $0.9\tau$ below the static free surface, so they only restricted the downward movement of the ice plate from its static equilibrium position. In the experiments, D was taken as either 115 mm or 340 mm, while L was taken as either 100 mm or 320 mm accordingly. Lastly,
 $\tau $ was taken varying from 3 to 20 mm.
Sketch of experiment set-up.

Sketch of ice plate boundary.

A downward water jet was ejected right above the ice plate. It was significant to keep the water jet fast, continuous and stable. Good compressibility of the gas was used and a generator for the high-speed water jet was invented, as shown in figure 4. There were two main parts: water chamber and gas chamber, which were connected by a sealed piston with variable cross-sectional area. Initially, the water chamber (maximum volume of 2 l) was filled with water at a certain pressure (approximately 20 MPa). The piston moved downward under the water pressure and the gas was expelled from the outlet. Then the water inlet was closed, and the compressor injected high-pressure gas into the gas chamber (maximum volume of 5 l) through the gas inlet. The piston moved upward slightly under the gas pressure and the water pressure rose gradually to the prescribed value (in the range of 32.32 to 42.42 MPa), before the gas inlet was closed and the water outlet was opened. As a result, under the compression of the gas, the water jet was released through a thin nozzle connected to the water outlet, as shown in figure 4. To make the water jet as stable as possible, several high-pressure gas cylinders were connected to the gas chamber, which extended the volume of the gas chamber and kept the variation of the volume of the chamber small relative to the whole volume, so the variation of gas pressure was small as a result. From the values recorded by the pressure gauge, the pressure of the water chamber P 0 during this process was almost constant.
Schematic diagram of high-speed water jet generator.

In the experiments, two high-speed cameras were adopted to observe the high-speed water jet and the ice plate simultaneously, as shown in figure 2. The high-speed camera 1 was the Phantom VEO-640S, which is capable of capturing 20 000 frames per second at a high-definition resolution of 512 × 360 with the minimum exposure time of 1 μs. The high-speed camera 2 was the Fastcam Mini AX200, which is capable of capturing 10 000 frames per second at a high-definition resolution of 896 × 448 with a maximum rate of 216 000 frames per second. Most of the experiments in this paper were shot at a rate of 20 000 frames per second unless otherwise specified. Owing to the limitation of the water jet generator, the high-speed camera 1 was unable to shoot the top view of the ice plate vertically downward, so we adopted the arrangement method of 45° between the main axis of high-speed camera 1 and the horizontal surface, as shown in figure 2. The bird's-eye view was usually adopted to capture the damage on the ice, which included crack formation, crack propagation, fracture, crevasse, etc., while the side view was usually adopted to observe the development of the water jet and the vertical development of cracks in the ice plate, as shown in figure 5. Three cold light lamps with powers of 1 200 W were adopted and two frosted glasses were arranged on the side and bottom of the transparent water tank to ensure the intensity and uniformity of the lighting.
Picture of experimental set-up and procedure.

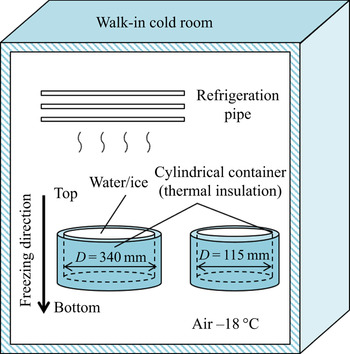
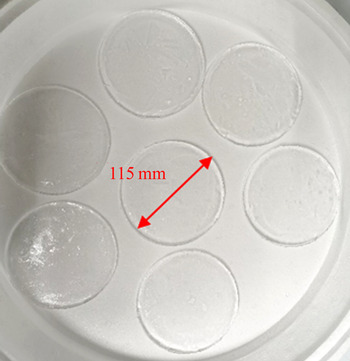
The ice plates were made of fresh water in cylindrical containers in a cryostat, whose temperature could change from −55 °C to 40 °C. The cylindrical container was an uncovered vessel made of thermal insulation materials filled with water degassed by repeated boiling. In this way, heat exchange was confined to the air–water interface, so the growth direction of the ice crystal was vertical, close to the real situation by as much as possible. The air temperature in the cryostat was maintained at −18 °C during the ice-making process. The set-up and prepared ice plates are shown in figures 6 and 7, respectively. Prepared ice plates could not be placed into the water tank directly, because there was a large temperature difference between the ice plate and water, and the ice could have broken under the effects of initial thermal stress. To avoid this phenomenon, we put the prepared ice plates in the cold room with a temperature of −5 °C for 12 hours to ensure that the temperature of the ice was −5 °C. Additionally, we put cold, slightly higher than freezing point, de-aired water into the water tank before moving the ice plate into the cold water.
Schematic diagram of making ice in the cryostat.

Pictures of some ice plate samples.

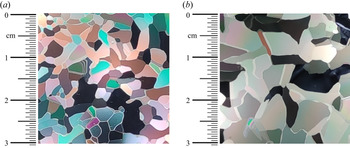
Physical and mechanical properties of the fresh-water ice specimen were measured before experiments. As the general trend, the grain size of ice increases with depth (Durand et al. Reference Durand, Weiss, Lipenkov, Barnola, Krinner, Parrenin, Delmonte, Ritz, Duval, Rothlisberger and Bigler2006). Thus, we measured two sections of the ice specimen at different depths. The two sections were 2 mm and 20 mm below the top of the ice specimen. The average grain size of the fresh-water ice used in the experiments could be taken from 3.0 mm to 4.6 mm, as shown in figure 8. Based on repeated three-point bending and uniaxial compression experiments of the ice specimen at −5 °C, the average values of the Young's modulus of ice could be taken as 6.2 GPa and the compressive and bending strength of ice were taken as 9.4 MPa and 2.4 MPa, respectively. For more details on these experiments, see the paper by Ni et al. (Reference Ni, Pan, Yuan and Xue2021). Owing to the limitation of the experimental facilities, other physical properties were not tested. It is suggested to refer to those of freshwater at the same temperature (−5 °C) for reference. For example, the typical values of Poisson's ratio and shear modulus of ice at −5 °C is 0.33 and 3.5 GPa (Hobbs Reference Hobbs1975; Schulson Reference Schulson1999; Martin Reference Martin2013) and the tensile and shear strength of ice are approximately 2.2 MPa and 1.7 MPa at −5 °C, respectively (Petrovic Reference Petrovic2003; Bragov et al. Reference Bragov, Igumnov, Konstantinov, Lomunov, Filippov and Shmotin2015).
Grain size of prepared fresh-water ice at different depths: (a) horizontal section A, 2 mm deep (3.0 mm); and (b) horizontal section B, 20 mm deep (4.6 mm).

As shown in figure 9, there are many factors which could affect the interaction between the water jet and ice plate. For example, the difference between initial pressure of the water chamber P 0 and atmospheric pressure  ${P_{atm}}$, water jet velocity at the nozzle
 ${v_0}$, the diameter of the nozzle
 ${R_0}$, the distance between the upper surface of the ice and the water jet nozzle h, ice thickness
 $\tau $ and the radius of the ice plate r, etc. To make it general, dimensionless parameters are usually adopted based on a set of characteristic parameters. Here we took the atmospheric pressure
 ${P_{atm}} = 1.01 \times {10^5}\;\textrm{Pa}$, the radius of the nozzle
 ${R_0} = 2\;\textrm{mm}$ and the gravitational acceleration
 $g = 9.8\;\textrm{m}\;{\textrm{s}^{ - 2}}$ as the characteristic parameters. As a result, a series of dimensionless parameters were obtained:
 \begin{gather}\xi = {P_0}/{P_{atm}},\end{gather}
 \begin{gather}Fr = {v_0}/\sqrt {g{R_0}} ,\end{gather}
 \begin{gather}H = h/{R_0},\end{gather}
 \begin{gather}T = \tau /{R_0},\end{gather}
 \begin{gather}R = r/{R_0},\end{gather}
where  $\xi $ is the strength parameter, Fr is Froude number of the nozzle velocity, H is the distance parameter, T is the ice-thickness parameter and R is the size parameter. Here one should notice that there is a relationship between
 $\xi $ and Fr. In other words, Fr depends on
 $\xi $ very much. For example, Zhang et al. (Reference Zhang, Wang, Ge, Xiao, Zhao and Huang2019) found
 \begin{equation}{v_0} = \varphi \sqrt {2({P_0} - {P_{atm}})/{\rho _w}} ,\end{equation}
where  $\varphi $ is named as the nozzle velocity coefficient, which is dimensionless and mainly related to the shapes of the nozzle, valve, and pipeline, etc. By using the characteristic parameters, one has the dimensionless form of (2.6a) as
 \begin{equation}Fr = \varphi \sqrt {2(\xi - 1)/{{\bar{\rho }}_w}} ,\end{equation}
where  ${\bar{\rho }_w} = {\rho _w}/({P_{atm}}/g{R_0})$ is the dimensionless density of water. Although
 $\varphi $ is also an independent dimensionless parameter, we are not concerned with its variation here and take Fr as a correlational parameter to
 $\xi $ based on (2.6b). Therefore, Fr was not studied independently in this paper.
Sketch map of the interaction between water jet and ice plate, where the parameters within brackets are dimensionless forms of those outside the brackets.

3. Study on load characteristics of a water jet
Before studying the ice-breaking ability, it is necessary to study the load characteristics of a water jet on a rigid wall. An aluminium alloy plate was taken as the rigid wall. To obtain the pressure on the wall, a piezoelectric pressure transducer (PCB113B22) with a diameter at the sensitive end of 5.5372 mm and a rise time less than 1 μs was installed at the centre of the plate. The signal was measured by using an oscilloscope (PCIe/PXIe-69834) operating at a sampling rate of 2.5 MHz and a bandwidth of 40 MHz. The transducer output is converted into pressure P(t) in MPa as
 \begin{equation}P(t) = S(t)/G,\end{equation}
where S(t) is the electrical response of the pressure transducer in V, G is the gain of the pressure transducer, which was taken as 150.2 mV MPa−1 for PCB113B22.
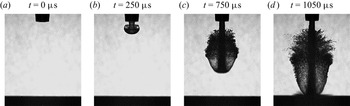
Initially, a typical case was studied to check the development of the water jet and its induced pressure. The experimental parameters were  $\xi = 380$, H = 30 and R = 85. figure 10 shows the development of the shape of the water jet in air just before the moment of impacting on the rigid wall. Under the action of air resistance, the end surface of the water column moving at a high speed in air was no longer flat, but round like a ‘mushroom’, as shown in figure 10(b), which means that there was a strong radial flow in the jet before impact. This phenomenon was also observed in previous experimental studies (Cui et al. Reference Cui, Chen, Su and Ma2020). Huang, Hammitt & Yang (Reference Huang, Hammitt and Yang1973) numerically described the morphological evolution of high-speed droplets under gas resistance. It was found that for a liquid impact velocity of 300 m s−1, the pressure peak was approximately 1.15, 0.7 and 0.85 times the water hammer pressure
 ${\rho _w}cV$ for cylindrical, spherical and cylindrical–spherical composite droplets, respectively. However, the effect of the flow in the jet before impact on the impact pressure evolution has not yet been studied to the best of our knowledge. This is an interesting problem, but it is not covered in this paper owing to the restriction of paper length.
Development of water jet shape in air (with  $\xi = 380$; H = 30; R = 85): (a) t = 0 μs; (b) t = 250 μs; (c) t = 750 μs and (d) t = 1050 μs.

The centre of the ‘mushroom’ moves downward, under the same effect of air resistance, the transverse movement stops a certain distance away from the edge of the water column and the outside edge moves backward relative to the centre, which forms a ring water curtain around the water column. As the water jet further progresses very quickly in air, the air resistance becomes quite large. As a result, the air resistance changes the shape of the jet into a streamline shape with minimum resistance, an approximate ellipsoid (Cui et al. Reference Cui, Chen, Su and Ma2020). As a contraction end of the ellipsoid, the edge of the liquid sheet becomes flaky first. When the aerodynamic force is greater than the surface tension, the liquid sheet breaks up, produces circular and banded liquid filaments, and falls off upstream of the jet (Sallam, Dai & Faeth Reference Sallam, Dai and Faeth2002). The structure of liquid filaments is unstable and droplets continue to splash and fall off from the tip. Parts of the liquid filaments even collide with the water column, as shown in figure 10(c). In figure 10(d), the tip of water jet has just impacted on the rigid surface at approximately t = 1050 μs. The total volume of the ‘mushroom’ becomes larger and the splashing becomes fiercer.
Figure 11 shows the time history of the water jet pressure on the rigid wall, with the enlarged view for 1.05–1.09 ms. Zero time is defined as when the water jet was released. As mentioned in the introduction, the whole process in figure 11 can be divided into two stages: the compressible stage and incompressible stage. In the compressible stage, the compressibility of the fluid is important and the pressure is very large, while the compressibility of the fluid is unimportant and can be ignored in the incompressible stage. The pressure peak in the compressible stage on the wall is defined as the ‘compressible pressure peak  ${P_1}$’, whose value was approximately 27.9 MPa for this case. Additionally, the duration of the main (first) compression pulse (Bowden & Brunton Reference Bowden and Brunton1961) is defined as
 ${t_c}$ and its value was approximately 6.8 μs for this case, as marked in figure 11. The compressible stage was followed by the incompressible stage. In the experiment, it is hard to distinguish the initial incompressible and late incompressible stages as those in the analytical study (Wu Reference Wu2001). Therefore, we did not distinguish them in this paper and defined the average of the incompressible pressure at large time on the wall as the ‘stable incompressible pressure
 ${P_2}$’, whose value was approximately 1.96 MPa for this case.
Time history of water jet pressure on the rigid wall, in which the duration of the main (first) compression pulse is approximately 6.8 μs,  $\xi = 380$, H = 30 and R = 85.

As  ${P_1}$ and
 ${P_2}$ are two principal parameters for water jet loads on the wall, their variation along with the distance parameter H and strength parameter
 $\xi $ was measured, as shown in figures 12 and 13, before being compared with the water hammer pressure
 ${P_w}$ and stagnation pressure
 ${P_s}$ in table 1.
Variation of compressible pressure peak  ${P_1}$ and stable incompressible pressure
 ${P_2}$ along with distance parameter H at
 $\xi = 380$ (the circle and square in the figure represent the average value, and the two ends of the line represent the maximum and minimum pressures, respectively, in three to five repeated experiments).

Variation of compressible pressure peak  ${P_1}$ and stable incompressible pressure
 ${P_2}$ along with strength parameter
 $\xi $ at
 $H = 30$ (the circle and square in the figure represent the average value, and the two ends of the line represent the maximum and minimum pressures, respectively, in three to five repeated experiments).

The load characteristics of high-speed water jet in the experiments (H = 30).

Moreover, variation of the compressible pressure peak  ${P_1}$ and stable incompressible pressure
 ${P_2}$ along with the distance parameter H was investigated, as shown in figure 12, based on the pressure–time curve of a typical case shown in figure 11. We kept the strength parameter
 $\xi $ as 380 and changed H from 15 to 55. Each test was repeated 3–5 times under the same conditions. It can be seen that
 ${P_1}$ increased before declining and achieved a peak at approximately H = 30. This denoted that H had an optimal value of approximately 30 from the perspective of jet loads on the wall. A possible reason why
 ${P_1}$ depends on H is that the water jet from the water outlet, driven by the internal water pressure, is accelerated for some distance H before contacting with the wall. As a result, too small H cannot provide enough acceleration distance, while too large H would consume the energy of the water jet by air resistance. In contrast,
 ${P_2}$ was relatively stable within the range of the discussed distance parameters. This denoted that the incompressible pressure on the wall was relatively insensitive to H. Hereafter, we kept H constant as 30 unless otherwise specified.
Furthermore, the variation of compressible pressure peak  ${P_1}$ and stable incompressible pressure
 ${P_2}$ along with the strength parameter
 $\xi $ was studied, as shown in figure 13. Here
 $\xi $ was changed from 320 to 420. Each test was repeated 3–5 times under the same conditions. With the increase of the strength parameters
 $\xi $, both
 $\; {P_1}$ and
 ${P_2}$ increased. This denoted a higher initial pressure in the water chamber induced a higher pressure of the water jet on the rigid wall. To see it clearer, we show the relative quantities in table 1.
Table 1 shows the overall results of the water jet loads, in which the impact velocity V of the water jet was the velocity of the water column just before touching the rigid wall, as shown in figure 10(d), which was obtained through the image analysis; water hammer pressure  ${P_w} = {\rho _w}cV$ and stagnation pressure
 ${P_s} = {\rho _w}{V^2}/2$, according to (1.1) and (1.4), in which
 ${\rho _w}$ and c were taken as
 $1000\;\textrm{kg}\;{\textrm{m}^{ - 3}}$ and 1500 m s−1, respectively; P 1 and P 2 were measured on the wall in the experiments directly. Along with the increase of
 $\xi $, V also increased, which can be understood from (2.6), considering a larger water jet velocity at nozzle
 ${v_0}$ resulting in a larger water impact velocity V at a given h. According to (1.2), one knows
 \begin{equation}{P_1}/{P_w} = \alpha \beta \gamma .\end{equation}
Here we define  ${P_1}/{P_w}$ as the reduction factor
 $\eta $. There are some reference values for
 $\alpha $,
 $\beta $ and
 $\gamma $. For example,
 $\alpha = 0.5$ for the problem of a spherical jet impact (Hsu et al. Reference Hsu, Liang, Teng and Nguten2013);
 $\beta = 1$ for a totally rigid wall;
 $\gamma = 1$ for a very high impact velocity. One can see the reduction factor
 $\eta $ was approximately 0.302–0.345 in our experiments based on table 1. The reduction factor
 $\eta $ was affected by many factors, including jet shape, impact velocity and wall flexibility. For example, Ming (Reference Ming2014) measured that
 $\eta $ was respectively approximately 0.6–0.7 and 0.4–0.6 for a spherical-head jet impacting rigid and elastic walls at 100 m s−1. At present, it is very hard to measure
 $\eta $ for a water jet impacting on the ice plate directly, considering the fragility of ice. Within the selected pressure range and given the aluminium alloy plate in this paper, we found
 $0.302 \le \eta \le 0.345$, which provides a reference for the compressible pressure input of subsequent ice-breaking experiments. However, compared with
 ${P_2}$ and
 ${P_s}$, one can see that
 ${P_2}$ was a bit larger than
 ${P_s}$, but they were close in general. This indicates the classical momentum conservation equation of a fluid is still suitable to predict the continuous impact of the incompressible fluid on a rigid wall.
4. Results and discussions
To clearly illustrate the damage mechanics of the water jet in the compressible and incompressible stages, we plot the schematic diagram in figure 14. As shown in figure 14(a) (Field Reference Field1999), the instantaneous impact of the water pressure acted on the upper surface of the plate and induced shock waves to propagate through the plate in various forms. The shock waves travelled inside the plate as volume waves (including longitudinal and transverse waves) and on the surface of the plate as Rayleigh surface waves. The longitudinal waves were compression waves before being reflected by the lower surface of the plate and turned to expansion waves owing to acoustic impedance of different media on the two sides of the interface. The transverse waves were shear waves. The Rayleigh surface waves, with vertical component and horizontal component, caused both tensile stress and shear stress accordingly, which may be an important reason for the formation and extension of cracks (Bowden & Brunton Reference Bowden and Brunton1961). According to the study of Field (Reference Field1999), the Rayleigh waves may play a leading role in the initial damage. This damage mechanism occurred on the affected surface when the reflected body waves from the rear surface interacted with the slower Rayleigh surface waves. The interaction can be with either a returning expansion wave or a slower shear wave. More importantly, the interference and reflection of different waves led to the enhancement of stress waves, which was conducive to the generation of cracks (Lu et al. Reference Lu, Huang, Liu and Xiang2015). The result was an increase in the surface tension, which led to circumferential cracks. Various damage forms or cracks are generated under these waves, based on the different material properties of the plate. Take ice for example, its tensile strength (approximately 2.2 MPa for the ice at −5 °C) was much lower than its compression strength (approximately 9.4 MPa for the ice at −5 °C), so it was more fragile under the reflected expansion wave compared with the compression wave (Zhang et al. Reference Zhang, Wang, Han, Xue, Lu and Wang2020). This will be validated in the experiments below where again, as in most cases, the initial cracks were generated from the lower surface of the ice plate. However, the subsequent continuous impact of the water jet generates a stable incompressible pressure in the central part of the ice plate, as shown in figure 14(b), which is also explained by the momentum conservation equation of fluid and is mainly related to the water jet velocity. The plate could also be damaged by the incompressible pressure, but usually with a relatively longer time as it needs time to develop. In addition, a circular hydraulic jump may arise when a descending vertical fluid jet is impacting on a rigid horizontal boundary (Bush & Aristoff Reference Bush and Aristoff2003; Bush, Aristoff & Hosoi Reference Bush, Aristoff and Hosoi2006), as marked in figure 14(b).
Schematic diagram of compressible pressure and incompressible pressure induced on the plate: (a) compressible pressure  ${P_1}$ (Field Reference Field1999) and (b) incompressible pressure
 ${P_2}$.

Following the analysis of the load characteristics and the damage mechanics of the water jet, a series of experiments were carried out to check the damage ability of the water jet on the ice plate. The strength parameter $\; \xi $, ice thickness parameter
 $\; T$ and size parameter R were changed, in which R was just chosen to have two values as the mould was bought off the shelf and the size was fixed. In figure 15, all the experimental conditions are marked, where the triangles represent the repeated conditions. For the ice, a too thin ice plate was unstable and a too thick ice plate cannot be broken by the high-speed water jet produced by the equipment described in figure 4. After attempts,
 $\xi $ was taken from 320 to 420 and T was respectively taken from 1.5 to 7 and from 2.5 to 10, under the two size parameters R = 28.75 and R = 85.
Schematic diagram of test conditions: (a) R = 28.75 and (b) R = 85, where triangles represent repeated experiments.

4.1. Typical cases
Before studying the statistical rules of dynamics of a high-speed water jet and its damage capabilities to an ice plate, we first selected two typical working conditions as examples, which would give us an overview of the behaviours of the water jet and ice plate.
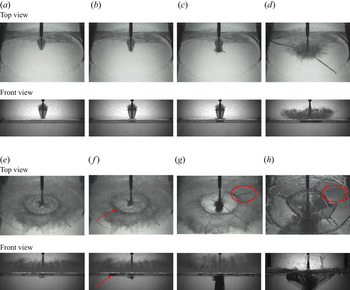
Here we took the case with T = 4.5,  $\xi = 380$, R = 85 as an example, and the evolution of the water jet and ice plate is illustrated in figure 16, with time marked below each picture. Here the total time is further defined as
 $t = \Delta t + t^{\prime}$, where
 $\Delta t$ is the time of the movement of the water jet in air and zero
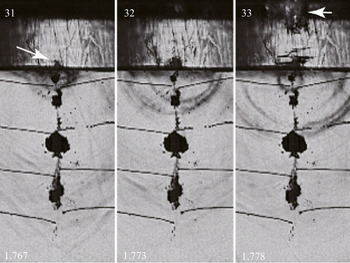
 $t^{\prime}$ corresponds to when the water jet just contacted with the ice surface, as shown in figure 16(a). In figure 16(b), the water jet has impacted on the ice plate and radial cracks (RCs) appear on the ice plate, which denoted that RCs were the results of shock waves along with compressible pressure P 1. From the shadow in the front view of figure 16(b), one can see that the RCs propagated from the lower surface of the ice plate. Inspired by the previous study of a water jet impacting on other materials, such as that shown in figure 14(a) (Field Reference Field1999), we assumed that the cracks arose from the reflected expansion wave on the ice–water interface. To validate this assumption, we did another experiment by using a small-scale ice plate with a higher shooting speed, which was 50 000 frames per second and the time interval was reduced to 20 μs, as shown in figure 17. Owing to the restriction of the camera, a higher shooting speed was unable to provide a give clear resolution. It can be clearly seen from figure 17 that the crack first appeared on the ice–water surface of the ice plate at 20 μs, and the crack gradually grew upward at the next moment. Based on the shadow area, the crack was generated much earlier than 20 μs. According to experimental results of ice breaking by the shockwave induced by bubble collapse of Cui, Zhang & Wang (Reference Cui, Zhang and Wang2021), as shown in figure 18, the crack generated by the reflected expansion wave appeared approximately 5 μs later than the shock wave first arriving at the ice–air interface. If we assume the crack generation by the water jet impact, the time for the first crack appearance was approximately 7 μs in our case, which accorded with the observation and analysis in figure 17. Based on this evidence, it is reasonable to presume that the first crack resulted from the reflected expansion wave on the ice–water interface in both figures 16 and 17. However, considering that the duration of the main compressible pulse was approximately 6.8 μs, from the perspective of external loads, the generation of RCs corresponded to the compressible pressure stage.
Experimental results of typical case 1: (a) t' = 0 μs; (b) t' = 50 μs; (c) t' = 100 μs; (d) t' = 1800 μs; (e) t' = 6450 μs  $({t^{\prime}_{pen}})$; (f) t' = 6500 μs; (g) t' = 7650 μs
 $({t^{\prime}_{com}})$ and (h) t' = 40 000 μs.

Experimental results of typical case 2 with higher shooting rates from front view (50 000 frames per second; T = 4,  $\xi = 420$, R = 28.75): (a) t' = 0 μs; (b) t' = 20 μs and (c) t' = 40 μs.

Experimental results of ice breaking by the shockwave induced by bubble collapse from Cui et al. (Reference Cui, Zhang and Wang2021) (the time units in the lower left corner are in ms).

Then RCs developed rapidly and the shadow area grew to the top surface of the ice plate in the front view, as shown in figure 16(c). Along with the continuous impact of the water jet, RCs extended to the outer edge of the ice plate in the top view, as shown in figure 16(d). At this moment, the ice plate had not split yet and water splashed on the top surface of ice fiercely, with a circle of the lateral jet as illustrated in figure 14. Under the accumulated effect of incompressible pressure, the ice plate started to split at approximately t = 6450 μs and part of the water jet penetrated the ice plate and entered the water, as shown in figure 16(e). This moment was defined as the ‘penetration time  ${t^{\prime}_{pen}}$’, which will be discussed below. Compared with figure 16(d), the area of the lateral jet on the upper surface of the ice plate increased under the constant impact on the ice plate. In addition, according to Bush & Aristoff (Reference Bush and Aristoff2003) and Bush et al. (Reference Bush, Aristoff and Hosoi2006), an obvious radius of the circular ‘hydraulic jump’ could be observed from figure 16(e). At the next moment, the first circumferential crack (CC) appeared, as marked by the red arrow in figure 16(f). Different from the RCs shown in figure 16(b) mainly from compressible pressure, the CC was mainly derived from incompressible pressure. At this time, the energy of the shock wave generated by compressible pressure P 1 dissipated much and left little, so it is reasonable to presume that the cracks resulted from the continuous impact of the water jet with P 2 mainly. After the time shown in figure 16(e), most of the radial crack growth was completed. The ice can be simplified as wedges floating on the water under the effect of a concentrated load acting on the vertex, which were more likely to produce circumferential cracks under bending actions. With the continuous strike of the water jet, more CCs were generated and the crevasse of the ice plate became larger, as shown in figure 16(g), which resulted in more jet water entering the water below the ice. The top view became more visible. Because no more cracks would be generated hereafter, this time was defined as the ‘completion time
 ${t^{\prime}_{com}}$’. After
 ${t^{\prime}_{com}}$, the energy of the continuous water impact was converted into kinetic energy and potential energy of the damaged ice fragments and water in the tank. Under these effects, the fragments of the ice plate started to roll under the water jet and the whole ice plate cracked, as shown in figure 16(h). In addition, based on the red circles in figures 16(g) and 16(h), one can see that some cracks disappeared in the subsequent observations, which denoted that those cracks were ‘part-through cracks’ (Bazant, Kim & Li Reference Bazant, Kim and Li1995). More details on part-through cracks can be found from the discussions in Ni et al. (Reference Ni, Pan, Yuan and Xue2021).
In short, from figures 16 and 17, one can clearly see that for a large strength parameter and a thin ice plate, compressible pressure  ${P_1}$ generated the RCs directly, while the incompressible pressure
 ${P_2}$ contributed CCs to the ice damage, on the basis of initial RCs. The ice plate broke into small pieces and induced displacement and finally rollover of the ice fragment. Therefore, it is important to check all the experimental results and see the variation rules of the crack generation versus various parameter combination.
4.2. Discussions on the damage patterns of ice under water jet loads
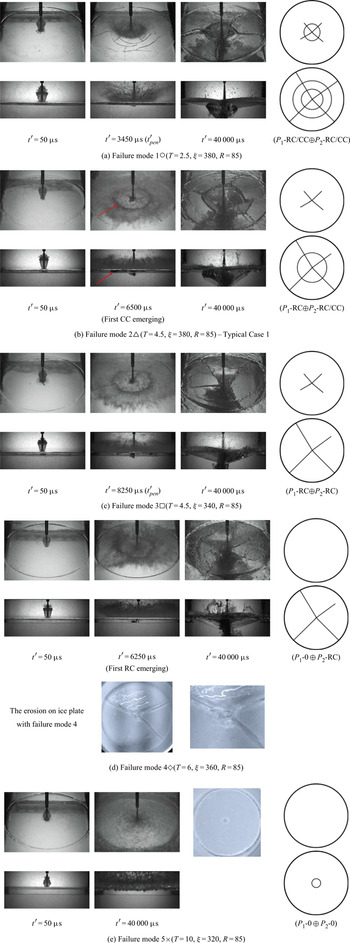
As discussed above, the duration tc of compressible pressure P 1 is extremely short, while the duration of incompressible pressure P 2 is relatively much longer. Therefore, it is easy to separate their contributions to the damage of the ice plate. If the cracks were generated in the first observation, we assume that they stemmed from P 1, otherwise they mainly resulted from P 2. Under this assumption, we listed some typical damage patterns of ice under water jet loads, as shown in table 2.
Typical damage patterns of the ice under water jet loads with sketch maps (the sketch maps on the right represents the initial cracks (top) and the final cracks (bottom) states, respectively).

First, when the strength parameter was large and the ice was thin, both RCs and CCs appeared on the ice under  ${P_1}$, as shown in the first column of table 2(a). Unfortunately, it was difficult to observe the propagation direction by the shadow in the front view as the ice was very thin. Therefore, it was hard to judge whether compression wave, reflected tensile wave or Rayleigh surface waves contributed to these cracks the most. Nonetheless, according to the explanation after figure 14(a), the RCs resulted from the volume waves caused by compressible pressures, while the CCs were mainly generated by the interaction of volume waves and Rayleigh surface waves. On this basis,
 ${P_2}$ resulted in more RCs and CCs, as shown in second column when the water jet just penetrated the ice. The distances between adjacent circles of CCs were generally equivalent, which is also named as ‘the breaking length’ of the ice and obeys a normal distribution according to statistics (Li et al. Reference Li, Yue, Shkhinek and Karna2003). Finally, the water jet broke the ice into pieces with large crevasses on the ice, as shown in the third column. Here we designated this mode as ‘(P 1-RC/CC⊕P 2-RC/CC)’ in short.
Second, as the ice became a little thicker, the shock waves of  ${P_1}$ could only generate RCs initially, but were not strong enough to produce CCs, as shown in the first column of table 2 (b). Then
 ${P_2}$ contributed to generate CCs and more RCs on the basis of the initial RCs. Finally, the ice plate broke into small pieces which overturned under the moment of the water jet. More information can be found from figure 16. Here we designated this mode as ‘(P 1-RC⊕P 2-RC/CC)’ in short.
Third, as the strength parameter decreased, RCs could still be generated under the action of  ${P_1}$, with the same mechanism as ‘failure mode 2’. However, only new RCs but no CCs were produced under the action of
 ${P_2}$, as shown in the second column of table 2 (c) when the water jet just penetrated the ice. This denoted that the small strength parameter depressed the ice-breaking ability of
 ${P_2}$ more relative to
 ${P_1}$, because
 ${P_2}$ has a square relation but
 ${P_1}$ has a linear relation with impact velocity V, which depends on
 $\xi $ directly. Finally, the ice plate split along the RCs. Here we designated this mode as ‘(P 1-RC⊕P 2-RC)’ in short.
Fourth, as the thickness of the ice increased further, no obvious damage could be observed under  ${P_1}$. Because the shock wave is damped sharply in the ice plate, the large ice thickness depressed the ice-breaking ability of
 ${P_1}$ more. Although
 ${P_1}$ contributed little, the water jet could still induce RCs after a period of continuous impact. One can notice from the front view in the second column of table 2 (d) that the shadow grew from the lower surface of the ice. However, this mechanism was different from that of figure 16(b). We can simplify the ice plate floating on the water under almost constant
 ${P_2}$ as a plate with an elastic foundation under a concentrated force. The lower surface of the plate was in tension while the upper surface was in compression. There were two variables in this system. One was the thickness at the center of the plate, which decreased under the erosion of the continuous impact of water jet, as shown in table 2 (d). From the images of the damaged ice plate, in addition to the through cracks of the ice plate, there was significant erosion at the center of the upper surface of the ice plate, which reduced the bearing capacity of the ice plate. The other was the loads on the upper surface, which increased under the water weight accumulated with the water jet. Under the effects of these two variables, especially the former, the stress caused in the ice plate increased. When the induced stress was over the allowable stress of the ice, cracks were generated. As mentioned above, because the tensile strength of ice is much lower than its compression strength, it is easy to predict that the stress of the lower surface in tension would be over the allowable tensile stress earlier. Therefore, it can be understood that the cracks were generated from the lower surface of the ice plate. Finally, the ice plate still split along the RCs. Here we designated this mode as ‘(P 1-0⊕P 2-RC)’ in short, in which the ‘0’ after the
 ${P_1}$ refers to presenting no cracks.
Fifth, as the ice became very thick while the water jet pressure was low, there were no cracks on the ice plate no matter whether under  ${P_1}$ or
 ${P_2}$. Under the erosion of the continuous impact of the water jet, only a pit with a diameter slightly larger than that of the water jet was left at the center of the upper surface of the ice plate. From the front view in table 2 (e), one can see that water splashed fiercely, but no water penetrated the ice plate. The ice plate did not split either. Here we designated this mode as ‘(P 1-0⊕P 2-0)’ in short.
Figure 19 shows the overall relationship between the failure modes of the ice plate and the strength parameters  $\xi $, ice thickness parameters T and size parameters R. First, the general trend was that the failure modes changed from ‘failure mode 5’ to ‘failure mode 1’ from top left corner to bottom right corner in both of the two scale parameters. This indicated damage on the ice became more severe along with the increase of
 $\xi $ and the decrease of T. This could be imagined. The influence of
 $\xi $ was mainly reflected in the initial shock wave intensity and the peak incompressible pressure. With the increase of the shock waves strength, both the strength of volume waves and tensile waves reflected by the ice–water interface increased accordingly, and it was easier to reach the allowable failure strength of ice, which mainly affected the initial crack of the ice plate. In addition, the peak of incompressible pressure also affected the development of subsequent radial and circumferential cracks based on the initial crack. At the same time,
 $\xi $ may play a greater role in the stage of the incompressible pressure
 ${P_2}$, because according to the contrast with
 ${P_w}$ and
 ${P_s}$,
 ${P_2}$ had a square relationship with the impact velocity, while
 ${P_1}$ only had a linear one, according to (1.1) and (1.4). T can affect the bending modulus of the ice plate, so an ice plate with a smaller T will be easier to break. Furthermore, the initial shock wave was attenuated exponentially with distance (Gong, Ohl & Klaseboer Reference Gong, Ohl and Klaseboer2010), so T had a more important effect on the propagation of the shock waves in the ice as well as the strength of reflected waves.
The damage patterns of ice plate along with strength parameter and ice-thickness parameters at different size parameter, where  $\bigcirc $ (P 1-RC/CC⊕P 2-RC/CC),
 $\triangle$ (P 1-RC⊕P 2-RC/CC),
 $\square$ (P 1-RC⊕P 2-RC),
 $\diamondsuit$ (P 1-0⊕P 2-RC),
 $\times$ (P 1-0⊕P 2-0) represent the five failure modes described in table 2: (a) R = 28.75 and (b) R = 85.

Second, the influence of size parameters R could be obtained based on a comparison of figures 19(a) and 19(b). Overall, the proportions of ‘failure mode 2’ and ‘failure mode 4’ were relatively high in the large-scale R = 85, so was ‘failure mode 3’ in the small-scale R = 28.75. R had a very small effect on the ice damage caused by compressible pressure  ${P_1}$, because the propagation of the shock wave was very fast and the influence of the outer edge of the ice plate was little. For ice plates with the same T and R, the shock waves generated by compressible pressure
 ${P_1}$ had almost the same effect on the ice plate, which produced the initial cracks. By contrast, R had a more remarkable effect on the damage caused by the incompressible pressure
 ${P_2}$. Based on the knowledge of mechanics of materials (Gere & Timoshenko Reference Gere and Timoshenko1997), under the same external loads at the centre of a circular plate, the plate with a larger size would have a larger bending moment and be much easier to break as a result. For example, with the same T = 3.5, in the range of
 $320 \le \xi \le 380$, CCs and new RCs were generated under the effect of
 ${P_2}$ on the basis of the initial RCs for R = 85 (failure mode 2), while only new RCs were generated under the effect of
 ${P_2}$ for R = 28.75 (failure mode 3). This could also explain why the ratio of ‘failure mode 2’ and ‘failure mode 4’ was more in the large-scale ice plate, considering the large-scale ice plate was more likely to produce bending failure under the action of
 ${P_2}$, whether based on initial RCs or not.
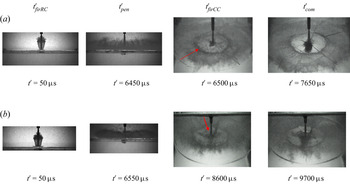
To analyse the development of the ice and water jet more quantitatively, we checked some key moments as shown in table 3 and figure 20, where  ${t^{\prime}_{firRC}}$ and
 ${t^{\prime}_{firCC}}$ were the first times when RC and CC were observed, respectively. First, the time for when the water jet penetrated the ice plate
 ${t^{\prime}_{pen}}$ showed a general trend where
 ${t^{\prime}_{pen}}$ decreased along with the increase of
 $\xi $ and the decrease of T. This denotes that a larger initial pressure, or a thinner ice plate, will result in the ice plate being penetrated by the water jet sooner. Second, the completion time of crack propagation
 ${t^{\prime}_{com}}$ will rise with T but fluctuate with
 $\xi $. Both the randomness of crack propagation and failure modes of the ice plate affect
 ${t^{\prime}_{com}}$, which results in it being more complex than
 ${t^{\prime}_{pen}}$. Finally, we chose two ice thicknesses to check the variation of
 ${t^{\prime}_{firRC}}$ and
 ${t^{\prime}_{firCC}}$. The group with T = 6 was selected to analyse the relationship between
 ${t^{\prime}_{firRC}}$ and
 $\xi $. The three cases from
 $\xi = 320$ to
 $\xi = 360$ were all ‘failure mode 4’, in which the first RC was generated in the stage of
 ${P_2}$ and it took time to accumulate an impulse. For a lower
 $\xi $, it took more time to accumulate enough impulse to break the ice. Therefore,
 ${t^{\prime}_{firRC}}$ declines with increase of
 $\xi $ in this range. However, once
 $\xi $ rose over 380, it was strong enough to generate the RC in the stage of
 ${P_1}$. The
 ${t^{\prime}_{firRC}}$ reduced sharply to approximately 50 μs (could not be captured exactly, but in this range). A similar situation applied to
 ${t^{\prime}_{firCC}}$ in the group of T = 3.5. The cases with
 $\xi \le 380$ were ‘failure mode 2’, in which the first CC was generated in the stage of
 ${P_s}$ and it took time to accumulate an impulse. Less time was needed or
 ${t^{\prime}_{firCC}}$ became smaller for a higher
 $\; \xi $. Once
 $\xi $ rose over 400, a CC was generated in the stage of
 ${P_1}$ and
 ${t^{\prime}_{firCC}}$ dropped to approximately 50 μs uniformly.
Development of some key moments under different  $\xi $ and T with R = 85, where
 ${t^{\prime}_{firCC}}$ is the first time when circumferential crack is observed,
 ${t^{\prime}_{firRC}}$ is the first time when radial crack is observed.

Development of some key moments under different  $\xi $ and T with R = 85, where
 ${t^{\prime}_{firCC}}$ is the first time when a circumferential crack is observed and
 ${t^{\prime}_{firRC}}$ is the first time when a radial crack is observed.

Another important finding is that for ‘failure mode 2’ (T = 3.5,  $320 \le \xi \le 380$),
 ${t^{\prime}_{firCC}}$ was always slightly larger than
 ${t^{\prime}_{pen}}$, which indicated that the first circumferential crack always appeared later than the water jet penetrated the ice plate. When the ice plate was penetrated by the water jet, most of the radial crack propagation was completed. The failure process of the ice plate then can be simplified to a wedge floating on the water under the effect of a concentrated load acting on the vertex. Based on the knowledge of structural mechanics (Daniel & Ishai Reference Daniel and Ishai2005), one can predict that a water jet load will produce a large bending moment on the wedge plate, which will induce CCs more easily. This also explained why there was only one circle of CCs in most cases of the ‘failure mode 2’.
4.3. Study on the influence of the boundary of ice plate
The boundary condition is usually one of the important conditions for the failure of ice. The boundary condition of most experiments in this paper is shown in figure 3, in which the simply supported boundary was adopted. In this part, the influence of different boundary conditions on the damage of the ice plate was analysed in contrast to the free-floating boundary.
Figure 21 presents a case of T = 4.5,  $\xi = 380$, R = 85 with simply supported and floating boundaries, respectively. Because the impact of the water jet was instantaneous, the contact time between the water jet and ice plate was so short that the vertical displacement of the ice plate was not obvious during the compressible pressure
 ${P_1}$ stage. Therefore, in the stage of
 ${P_2}$, the boundary condition had little effect on the dynamics of ice plates. Then in the stage of incompressible pressure
 ${P_2}$, the vertical displacement of the floating ice plate consumed a part of the energy of the water jet, which lead to the delay of the breaking process of ice plate, including
 ${t^{\prime}_{pen}}$,
 ${t^{\prime}_{firCC}}$ and
 ${t^{\prime}_{com}}$. Overall, the floating boundary did not change the breaking mode of the ice plate, but just delayed the breaking process of the ice plate in the stage of
 ${P_1}$ a little.
Effect of the boundary condition (T = 4.5,  $\xi = 380$, R = 85): (a) simply supported and (b) floating.

4.4. Study on the same cases
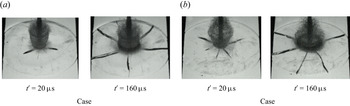
In this section, we investigated the repeatability and randomness of the results, considering the mechanics property of the ice. We took the case with T = 4, R = 28.75 and  $\xi = 380$ as the example with a higher shooting frame of 50 000 frames per second, as shown in figure 22. It can be seen that the damage pattern of the ice was the same but the specific cracks were different. For example, under the compressible pressure
 ${P_1}$, different radial cracks were generated for the two groups. It denotes that the propagation of the cracks of the ice had a certain randomness and the crack extension energy was not entirely related to the amount of the cracks. On this basis, under incompressible pressure
 ${P_2}$, radial cracks with different directions were developed on the ice. All these phenomena illustrate the complexity of the ice mechanics, which induces the randomness of the interaction between the ice and water jet with the same parameters. For the impact problem of a plate under axisymmetric condition (Li, Ding & Chen Reference Li, Ding and Chen2008; Rabczuk Reference Rabczuk2013; Seagraves & Radovitzky Reference Seagraves and Radovitzky2013), the cracks resulted from the instability of an almost axisymmetric bending state of the plate. Then the positions of the cracks cannot be predicted but the crack number can be reasonably predicted. However, the conditions of the experiments were not perfectly axisymmetric because of the plate support, which may significantly affect the cracks. These was also the reasons why we were concerned with the damage patterns, but not the specific cracks in this paper.
Comparison of two experimental results with same parameters (T = 4,  $\xi = 380$, R = 28.75).

5. Conclusion
In this paper, the load characteristics of a high-speed water jet and its damage characteristics to ice were investigated through indoor experiments. A new homemade high-speed water jet generator was introduced. The most attention was given to the damage capabilities of the high-speed water jet impacting on the ice plate, including cracks, breakup and movement. The effects of the water jet pressure, ice plate thickness, ice plate size and other parameters were also studied. The main conclusions were drawn as listed in the following.
(1) The load characteristics of a water jet generated from the homemade water jet generator and its variation with parameters have been studied. Within the selected pressure range, the peak of compressible pressure
 ${P_1}$ was compared with water-hammer pressure ${P_w} = {\rho _w}cV$, and it was found that the reduction factor $\eta = {P_1}/{P_w}$ was between 0.302 and 0.345, while the result of stable incompressible pressure ${P_2}\; $on the wall was close to the stagnation pressure ${P_s} = {\rho _w}{V^2}/2$.
(2) The damage of the ice under water jet loads can be mainly divided into five patterns according to the crack developments: both radial and circumferential cracks pattern (P 1-RC/CC⊕P 2-RC/CC), first radial and then circumferential cracks pattern (P 1-RC⊕P 2-RC/CC), first radial and then radial cracks pattern (P 1-RC⊕P 2-RC), first no crack and then radial cracks pattern (P 1-0⊕P 2-RC) and no crack pattern (P 1-0⊕P 2-0). The damage degree decreased in this sequence.
(3) Strength parameter
$\xi $ and ice thickness parameter T were two dominant parameters for the damage capabilities of the water jet. With the increase of $\xi $ and/or the decrease of T, the damage degree of ice became worse. The size of the ice plate or size parameter R mainly affected the damage in the incompressible stage, and it was relatively difficult to produce circumferential cracks on a small-sized ice plate.(4) Compared with the simply supported boundary, the failure mode of the floating ice plate was the same but the breaking process in the incompressible stage was delayed, because a part of the energy of the water jet was transformed into mechanical energy for the floating ice plate.


Funding
This work is supported by the National Natural Science Foundation of China (nos 51979051, 51979056 and 51639004), for which the authors are most grateful.
Declaration of interests
The authors report no conflicts of interest.