INTRODUCTION
About 0·60–0·87 of the carbon in a mature cotton boll comes from the subtending leaf to the cotton boll (Ashley Reference Ashley1972; Constable & Rawson Reference Constable and Rawson1980; Wullschleger & Oosterhuis Reference Wullschleger and Oosterhuis1990), and sucrose is the principal carbohydrate translocated from source to sink tissues (Lunn & Hatch Reference Lunn and Hatch1995). Therefore, the subtending leaf plays a crucial role in contributing to cotton yield, particularly to boll weight during its development. In addition, Gao et al. (Reference Gao, Wang, Zhou and Oosterhuis2012) found that sucrose content in the subtending leaf was positively correlated with sucrose in cotton fibre at 24–31 days post anthesis (DPA). Leaf sucrose-phosphate synthase (SPS) and cystolic fructose-1,6-bisphosphatase (cy-FBPase) have been identified as key enzymes in carbon metabolism (Huber & Huber Reference Huber and Huber1992, Reference Huber and Huber1996; Huner et al. Reference Huner, Öquist, Hurry, Krol, Falk and Griffith1993), which regulates sucrose transformation from leaves to grains in maize (Zea mays L.). In addition, the rates of sucrose formation and export are closely aligned with the rate of carbon fixation and the activation state of SPS (Kalt-Torres et al. Reference Kalt-Torres, Kerr, Usuda and Huber1987). A large accumulation of sucrose would have a feedback inhibition to photosynthesis gene expression (Hu et al. Reference Hu, Zhang and Xu2008), resulting in decreased photosynthetic rate and inhibited SPS activity, leading to lower potato tuber yield. A recent study about sucrose synthase (SuSy) in orchid (Oncidium goldiana) has suggested that its crucial function in plant metabolism is mainly sucrose breakdown and energy provision (Li et al. Reference Li, Liang and Hew2002). Therefore, the activities of cy-FBPase, SPS and SuSy could affect sucrose metabolism in the subtending leaf and subsequently boll formation.
As an indeterminate crop, previous research about cotton fruiting branch nodes (FBN) has mainly focused on boll weight, fibre quality and cottonseed quality (Xu et al. Reference Xu, Zhou and Xu1994; Shan et al. Reference Shan, Shi, Sun, Zhou and Bian2002). Boll weight and fibre quality in different FBN at the same planting date were found to be significantly different (Zhao & Oosterhuis Reference Zhao and Oosterhuis2000; Davidonis et al. Reference Davidonis, Johnson, Landivar and Fernandez2004). In addition, leaf biomass and non-structural carbohydrate contents were affected significantly by FBN position, and leaf sucrose content differed more among different FBN (Zhao & Oosterhuis Reference Zhao and Oosterhuis2000) compared to leaf hexose content and starch content. However, growth and development of bolls and their subtending leaves were not only shown to be affected by the position of the FBN, but also by environmental conditions of temperature and light (Wang et al. Reference Wang, Chen, Bian, Jiang, Zhang, Hu, Shu and Zhou2006). Therefore, it is necessary to choose different FBN at the same flowering date (FD) to avoid the effects of environmental conditions.
In production, FD affects temperature, which is a main ecological factor influencing cotton growth and development (Guo & Zeng Reference Guo and Zeng1989). Delayed FDs mean lower temperatures, which result in decreased rates of starch degradation and export in many cotton-growing areas (Guo & Zeng Reference Guo and Zeng1989; Guo et al. Reference Guo, Zeng and Su1991). This indicates that lack of sufficient photosynthesis leads to lower fibre weight and cottonseed weight (Zhou et al. Reference Zhou, Guo, Huang, Sun and Wu1998; Tian et al. Reference Tian, He and Wang2000). Previous research has shown that the position of FBN affects boll formation and fibre strength significantly (Zhao et al. Reference Zhao, Wang, Shu and Zhou2010, Reference Zhao, Meng, Chen, Wang, Li and Zhou2011) for the same FD, which was suitable for cotton growth and development. It was found that as FD was delayed, the influence of FBN on fibre sucrose metabolism and fibre strength were non-significant (Shu Reference Shu2009; Zhao et al. Reference Zhao, Meng, Chen, Wang, Li and Zhou2011). Therefore, boll weight, fibre sucrose metabolism and fibre quality formation could be affected by FD, FBN and their interactions (Gormus & Yucel Reference Gormus and Yucel2002; Boquet & Clawson Reference Boquet and Clawson2009; Zhao et al. Reference Zhao, Wang, Shu and Zhou2010, Reference Zhao, Meng, Chen, Wang, Li and Zhou2011). However, little is known about dynamic changes of sucrose metabolism in the subtending leaf, as the most important contributor to biomass accumulation in cotton bolls, at different FD and FBN.
The current study used different planting dates to provide different FD and FBN. The objectives were to investigate changes in carbohydrate content and sucrose-metabolizing enzyme activities in the subtending leaf at different FBN. The study aimed at enhancing boll weight, and reducing both late maturity and poor fibre quality. These results might help refine breeding and selection criteria for new cotton cultivars to enhance environmental tolerance.
MATERIALS AND METHODS
Experimental design
Field experiments were conducted at two locations, c. 1 km apart: Jiangsu Academy of Agricultural Sciences in 2009 and at Pailou Experimental Station in 2011, Nanjing, Jiangsu, China (118°50′E, 32°02′N). The soil at both experimental sites was clay, mixed, thermic, Typic alfisols (udalfs; FAO luvisol) in the top 20 cm of the soil profile, and the organic matter and nitrogen, phosphorus and potassium contents of the soils are listed in Table 1. Two cotton cultivars widely grown in the Yangtze River Valley in China, Kemian 1 and Sumian 15, were planted in the field on three different dates, 25 April, 25 May and 15 June in 2009 and 25 April, 25 May and 10 June in 2011. Cotton seeds were initially planted in a nursery bed, and subsequently seedlings with three true leaves were transplanted into the field. Three replications for each treatment were assigned randomly. Each treatment consisted of nine rows, 5·6 m long in 2009, and eight rows long in 2011 with 0·8 m of row spacing in each year. Furrow irrigation was applied as needed to minimize moisture stress during each season. Conventional weed and insect control measures were utilized as needed.
Organic matter and NPK content of the soils at the experimental sites in 2009 and 2011

Sampling and processing
White flowers on the first position of the 2nd–3rd and 10–11th fruiting branches (FB2–3 and FB10–11) of all plants were labelled with small plastic tags showing the flowering date. White flowers were tagged for each planting date on the same day, no more than 3 days after the date that tagging commenced, to ensure that the tagged flowers were of equivalent metabolic and developmental ages for each treatment. These labelled bolls and their subtending leaves were collected once every 7 days from 10 DPA until the boll opening date. The bolls samples and their subtending leaves were collected at 09·00–10·00 h, ensuring that the diurnal variations of enzymatic activities, carbohydrate contents and boll weight were constant, and transported from the field to the laboratory in an ice box. The leaves were washed with distilled water and divided into two halves down each side of the main vein. One half was placed immediately in liquid nitrogen and stored in an ultra-low temperature freezer (−80 °C) for subsequent enzymatic measurement. The remainder was dried at 105 °C for 30 min and then at 70 °C to constant weight for carbohydrate analysis. Additionally, fibre and seeds in the labelled bolls were excised when the bolls opened and dried to determine boll weight.
Leaf carbohydrate analysis
Dried leaf tissues were ground and filtered using a 1 mm sieve. The powdered material (0·1 g) was placed in a 10 ml centrifuge tube and mixed with 5 ml of 80% ethanol. The mixture was incubated in a water bath shaker at 80 °C for 30 min, and then centrifuged at 4000 rpm for 5 min. The pellets were extracted twice more using 80% ethanol. The three supernatants were combined and diluted to 25 ml with 80% ethanol, mixed and stored at −20 °C for sucrose determinations. Sucrose was assayed on the re-suspended supernatant according to previously described protocols (Hendrix Reference Hendrix1993).
The ethanol-insoluble residue was used in starch extraction. Ethanol was removed through evaporation. Starch in the residue was released in a boiling bath with 2 ml of distilled water for 15 min and cooled to room temperature. Then leaf starch was hydrolysed with 9·2 mol/l HClO4 (2 ml) for 15 min. Distilled water (4 ml) was added to the samples, which were then centrifuged at 4000 rpm for 10 min. The residue was extracted once more using 4·6 mol/l HClO4 (2 ml). The supernatants were retained, combined and made up to 25 ml with distilled water. The starch concentration was measured spectrophotometrically at 620 nm using anthrone reagent (Seifter et al. Reference Seifter, Dayton, Novic and Muntwyler1950) and glucose was used as the standard.
Leaf enzymatic extraction and analysis
The frozen leaf sample was homogenized using a chilled mortar and pestle with cooled extraction buffer containing 50 mm of Tris–HCl (pH 7·5), 1 mm of ethylenediaminetetraacetic acid (EDTA), 1 mm of MgCl2, 12·5% (v/v) of glycerin, 10% of polyvinylpyrrolidone (PVP), and 10 mm of β-mercaptoethanol. The homogenate was centrifuged at 15 000 g for 15 min at 4 °C and 5 μl of the supernatant was used immediately to determine initial Rubisco activity as described by Sharkey et al. (Reference Sharkey, Savitch and Butz1991), with some modification (Pettigrew & Turley Reference Pettigrew and Turley1998) at room temperature (25 °C). The assay for initial Rubisco activity was started by adding 10 μl of 50 mm ribulose-1,5-bisphosphate (RuBP, Sigma) to 1 ml of an assay buffer containing 50 mM of Tris–HCl (pH 8·0), 15 mm of MgCl2, 1 mm of EDTA, 10 mm of NaCl, 10 mm of NaHCO3, 5 mm of dithiothreitol, 5 mm of phosphocreatine, 5 mm of adenosine triphosphate (ATP), 0·12 mm of nicotinamide adenine dinucleotide (NADH), 7 units of glyceraldehyde-3-phosphate dehydrogenase (Sigma), 7 units of phosphoglycerate kinase (Sigma) and 7 units of creatine phosphokinase (Sigma) and 5 μl of the supernatant. The initial activity was determined by monitoring the oxidation rate of NADH at A 340 nm and by assuming two molecules of NADH oxidized per molecule of CO2 fixed.
The cooled extraction buffer for leaf cy-FBPase contained 100 mm of Tris–HCl (pH 8·2), 1 mM of EDTA, 50 ml/l of glycerin and 15 mm of β-mercaptoethanol. Leaf cy-FBPase was extracted and analysed spectrophotometrically according to Jang et al. (Reference Jang, Lee, Lee and Hahn2003) with some modification at A 340 nm. The 1·0-ml reaction mixture contained 100 mm of Tris–HCl (pH 8·2), 5 mm of MgCl2, 0·5 mm of EDTA, 0·5 mm of NADP, 2 units of phosphoglucoisomerase (PGI, Sigma), and 1 unit of glucose-6-phosphate dehydrogenase. The reaction was initiated by adding 60 mm FBP (Sigma) at room temperature (25 °C).
The enzymes SPS and SuSy were extracted from frozen leaf samples as described by Huber & Israel (Reference Huber and Israel1982), according to the measurement of fructose 6-P or fructose-dependent formation of sucrose-P or sucrose from UDP-glucose. Each reaction contained 50 mm of UDP-glucose, 50 mm of fructose-6-P (for SPS) or 50 mm of fructose (for SuSy, measured in the sucrose synthesis direction), 50 mm of extraction buffer, 10 mm of MgCl2 and 200 μl of extract in a total volume of 550 μl. The reaction was initiated by incubating the enzyme extract at 30 °C for 30 min. The reaction was stopped using 100 μl of 2 mol/l NaOH and heating the solution for 10 min at 100 °C to destroy unreacted hexoses and hexose phosphates. Then the solution was cooled and mixed with 1 ml of 0·1% (w/v) resorcin in 95% (v/v) ethanol and 3·5 ml of 30% (w/v) HCl before being incubated for 10 min at 80 °C. Sucrose content was calculated from a standard curve measured at A 480 nm.
Data analysis
All data were subjected to analysis of variance using SPSS version 17·0, and the difference between means identified by LSD (P<0·05). The coefficient of variation (CV, %) was calculated as the ratio of the standard deviation (including all FD and FBN) to the mean.
Transport capacity of sucrose (Tn) in the subtending leaf was calculated by the formula Tn=(C n−4−C n+3)/7 according to Liu et al. (Reference Liu, Jiang, Zheng, Zhou, He and Wang2005), where n is the days post anthesis, Tn is the transport capacity of sucrose at n-DPA, C n−4 is the sucrose content at (n−4) DPA and Cn+3 is the sucrose content at (n+3) DPA.
The pattern of boll weight increase with DPA followed a typical Logistic growth model curve with the logistic equation:
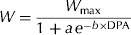 $$W = \displaystyle{{W_{\max}} \over {1 + a\,e^{ - b \times {\rm DPA}}}} $$
where DPA (d) is days post anthesis, W (g/boll) is boll weight, W max (g/boll) is the maximum boll weight, and a and b are parameters related to the specific cultivars and environmental conditions. The values of a and b derived during the logistic regression can then be used to calculate DPA1, DPA2, DPAm, V max through use of the following equations:
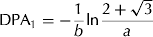 $${\rm DPA}_1 = - \displaystyle{1 \over b}\ln \displaystyle{{2 + \sqrt 3} \over a}$$
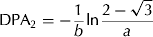 $${\rm DPA}_2 = - \displaystyle{1 \over b}\ln \displaystyle{{2 - \sqrt 3} \over a}$$
 $${\rm DPA}_m = \displaystyle{{\ln a} \over b}$$
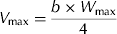 $$V_{\max} = \displaystyle{{b \times W_{\max}} \over 4}$$
where DPA1 is the DPA when boll weight started rapid increase; DPA2 is the DPA when boll weight terminated rapid increase; V max is the maximal rate of boll weight increase; DPAm is the DPA when the rate of boll weight increase reached maximum; T=(DPA1–DPA2) is the period of rapid boll weight increase.
RESULTS
Weather data during boll development
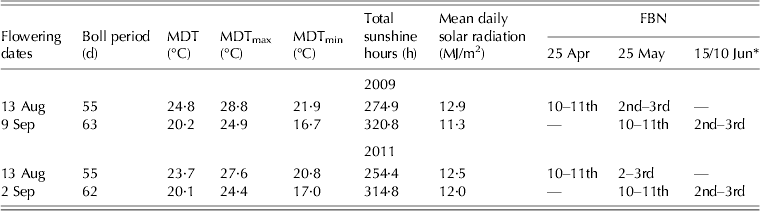
Weather data in Nanjing were collected from an established station (Nanjing meteorology, a small, automated station near the experimental plot). The growth and development conditions of bolls and their subtending leaves were similar at the same FD of different planting dates, whereas their FBN were different (Table 2). At FD 13 August 2009 and 2011, the white flowers were at the 10–11th fruiting branches (FB10–11) for the 25 April planting date, and they were at the 2nd–3rd fruiting branches (FB2–3) for the 25 May planting date. At the FD 9 September 2009 and 2 September 2011, the white flowers were at FB10–11 for the 25 May planting date and FB2–3 for the 10 June planting date (15 June in 2009). Therefore, sucrose metabolism was studied in the subtending leaf at different FBN (FB10–11 and FB2–3).
Environmental conditions and fruiting branch nodes (FBN) during boll development at different planting dates in 2009 and 2011
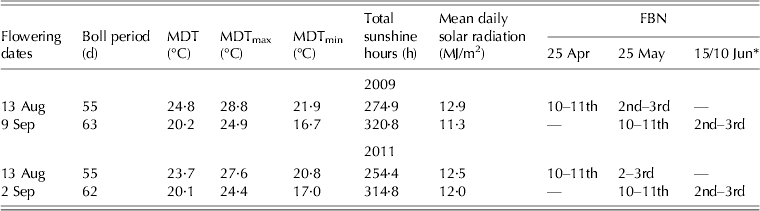
MDT, mean daily temperature; MDTmax, mean daily maximum temperature; MDTmin, mean daily minimum temperature during boll development.
* Cotton was planted on 25 April, 25 May and 15 June in 2009, and 25 April, 25 May and 10 June in 2011.
Changes of boll weight and carbohydrate contents in the subtending leaf
Variance of boll weight formation model
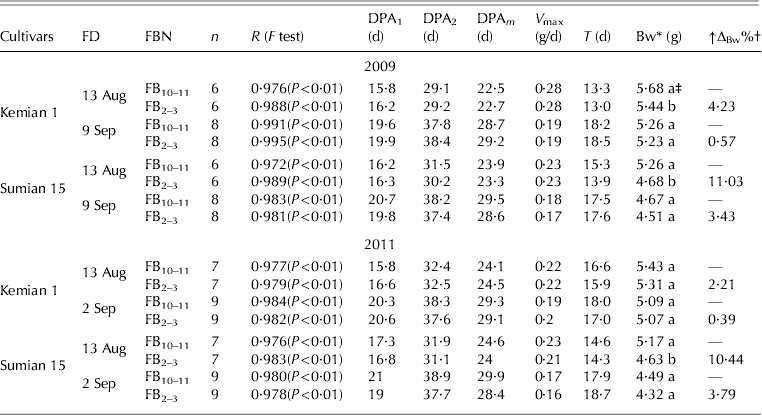
The dynamic changes of boll weight at different FBN were simulated using a Logistic growth model (P<0·01) (Table 3). Boll weight increased rapidly from 17 to 38 DPA. Compared with the 13 August FD, later DPA1 and DPA2, lower DPAm and a shorter period of rapid boll weight increase (T) of the two cultivars resulted in smaller boll weight at the delayed FD (9 September 2009 and 2 September 2011). In the current study, b is shown as the V max. The values of DPA1, DPA2, DPAm, V max and T for Kemian 1 changed little between FB10–11 and FB2–3. However, compared with FB10–11, boll weight in Sumian 15 started or terminated the rapid increase (DPA1 or DPA2) much earlier at FB2–3, and T was also shorter, thereby leading to smaller boll weight at FB2–3. Through analysing the ↑Δ% (Δ%=(FB10–11−FB2–3)×100%/FB2–3) of boll weight between FB10–11 and FB2–3 (↑ΔBw %), the difference in boll weight between FB10–11 and FB2–3 decreased as the FD was delayed from 13 August to 9 September 2009/2 September 2011. For Sumian 15, as the FD was delayed, the ↑ΔBw % changed from 11·03 to 3·43% in 2009 and from 10·44 to 3·79% in 2011, whereas for Kemian 1, the ↑ΔBw % was <5% and boll weight was not affected significantly by FBN (Table 3).
Eigenvalues of the cotton boll weight curve at different flowering dates (FD) and fruiting branch nodes (FBN) during boll development in 2009 and 2011 NS, not significant. * Bw, boll weight; DPA1 is the DPA when boll weight started rapid increase; DPA2 is the DPA when boll weight terminated rapid increase; V max is the maximal rate of increase in boll weight; DPAm is the DPA boll weight reached the maximum rate of increase; T=(DPA 2−DPA 1) is the period of rapid boll weight increase. † ΔBw%=(FB10–11−FB2–3)×100%/FB2–3. ‡ Values followed by the different letters within the same column are significantly different at P<0·05; FD and FBN flowering dates and fruiting branch nodes.

Carbohydrate content in the subtending leaf
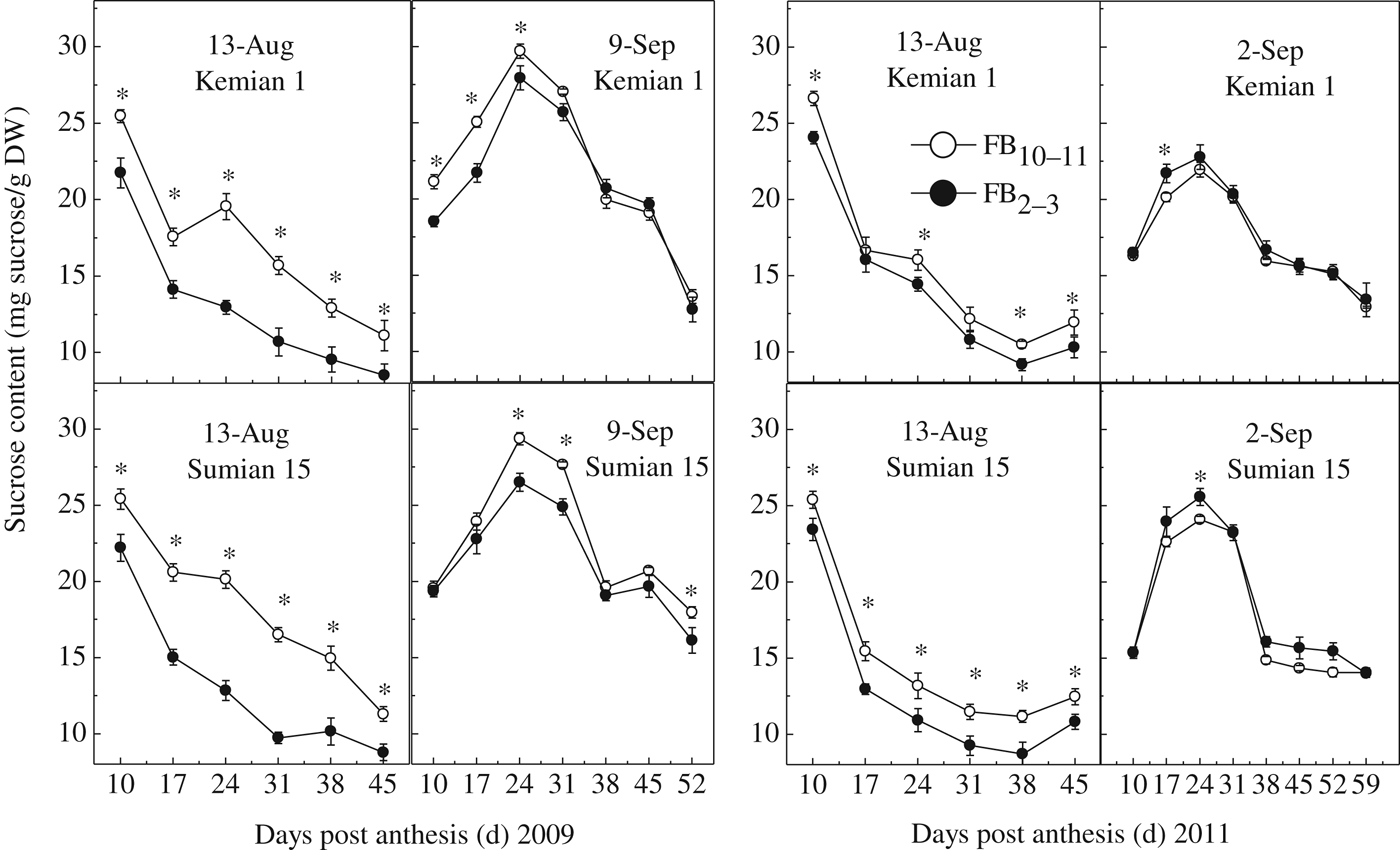
Sucrose content in the subtending leaf declined significantly from 10 to 45 DPA at the 13 August FD (P<0·05), but at the FD of 9 September 2009 and 2 September 2011, the peak value occurred at 24 DPA and declined thereafter to 52 DPA (Fig. 1). Sucrose content in the subtending leaf increased following delay of FD from 13 August to 9 September 2009/2 September 2011. In addition, sucrose content in the subtending leaf of Kemian 1 was lower than that of Sumian 15.
Effect of FD and FBN on sucrose content in the subtending leaf during boll development in 2009 and 2011. The stage labelled with an asterisk (*) indicates significant difference (P<0·05) between FB10–11 and FB2–3.
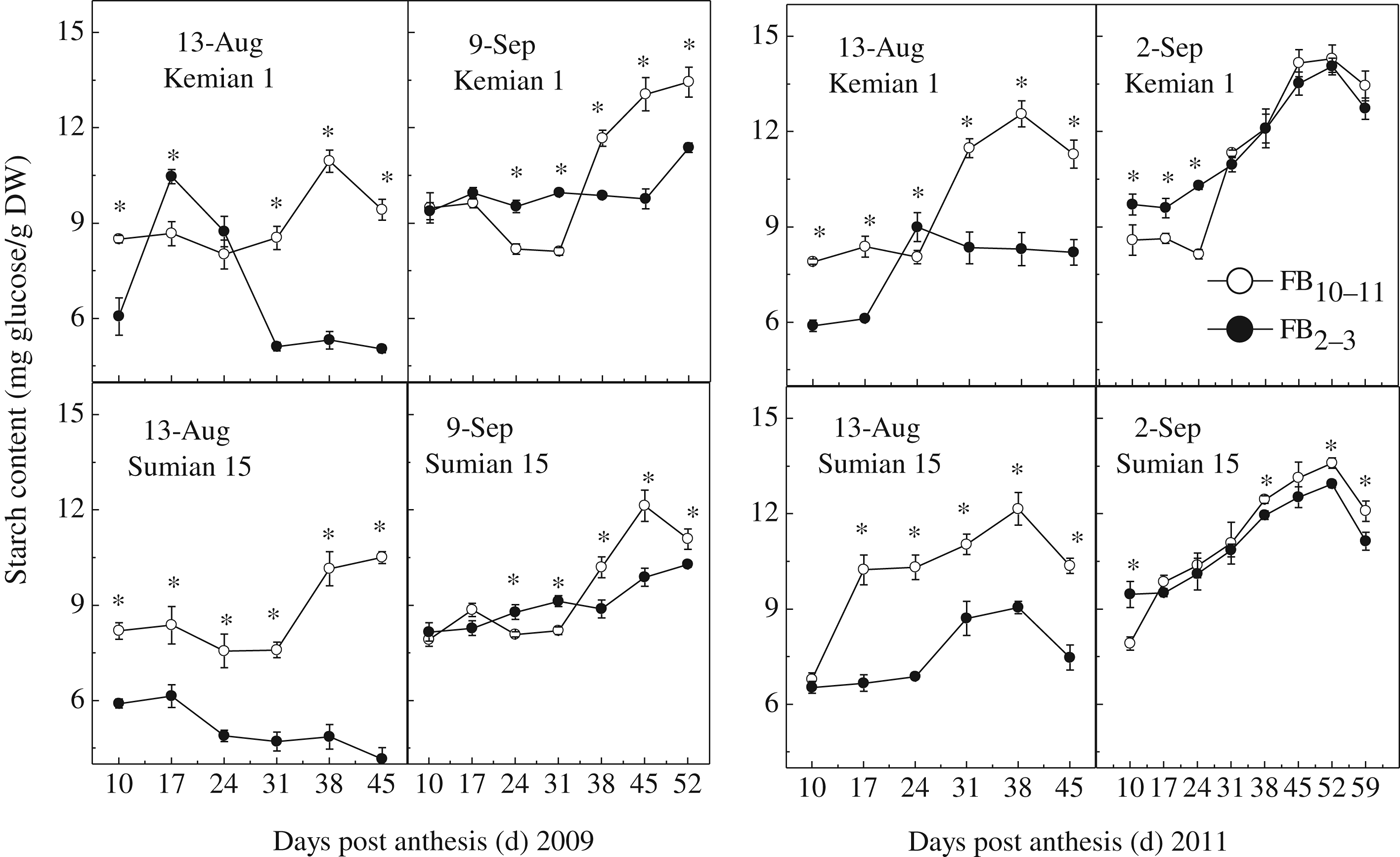
In the current study, changes of starch content in the subtending leaf with DPA show a single-peak curve at different FBN (Fig. 2). At the 13 August FD, subtending leaf peak starch content occurred at 17–24 DPA for FB2–3 whereas the peak occurred at 38 DPA for FB10–11. As the FD was delayed, peak starch content of the subtending leaf occurred later. Moreover, it was found that amounts of starch accumulated in the subtending leaf increased sharply from 38 to 59 DPA for both cultivars at FD 9 September 2009 and 2 September 2011.
Effect of FD and FBN on starch content in the subtending leaf during boll development in 2009 and 2011. The stage labelled with an asterisk (*) indicates significant difference (P<0·05) between FB10–11 and FB2–3.
In addition, at most of the time courses of the 13 August FD sucrose content and starch content in the subtending leaf of FB10–11 were significantly higher than those of FB2–3 (P<0·05).
Correlation coefficient of boll weight during development to carbohydrate content in the subtending leaf
It is well known that sucrose and starch are the principal end products of photosynthesis in most plants including cotton. Based on the results that 17–38 DPA were the key developmental stage for boll formation (Table 3) and that the trends for the two cultivars were similar, the relationship between carbohydrate content, transport capacity of sucrose (Tn) in the subtending leaf and boll weight at 17–38 DPA were analysed with cultivars as the repetitions (Table 4). At 17–31 DPA, the correlation of boll weight with sucrose content in the subtending leaf was negative (r=−0·710 to 0·872, P<0·05), whereas it was positive for Tn in the subtending leaf (r=(0·713–0·925), P<0·05). However, surprisingly, starch content in the subtending leaf was not significantly correlated with boll weight.
Regression coefficients (R) between sucrose content (mg sucrose/g DW), transport capacity of sucrose (Tn, mg sucrose/g DW/d), starch content (mg glucose/g DW) in the subtending leaf and boll weight (g) on different days post anthesis (DPA) in 2009 and 2011. There were two flowering dates (FD), two cultivars and two groups of fruiting branch nodes (FBN). (n=8, R 0·05=0·707, R 0·01=0·834)

Changes of enzyme activities in sucrose metabolism in the subtending leaf
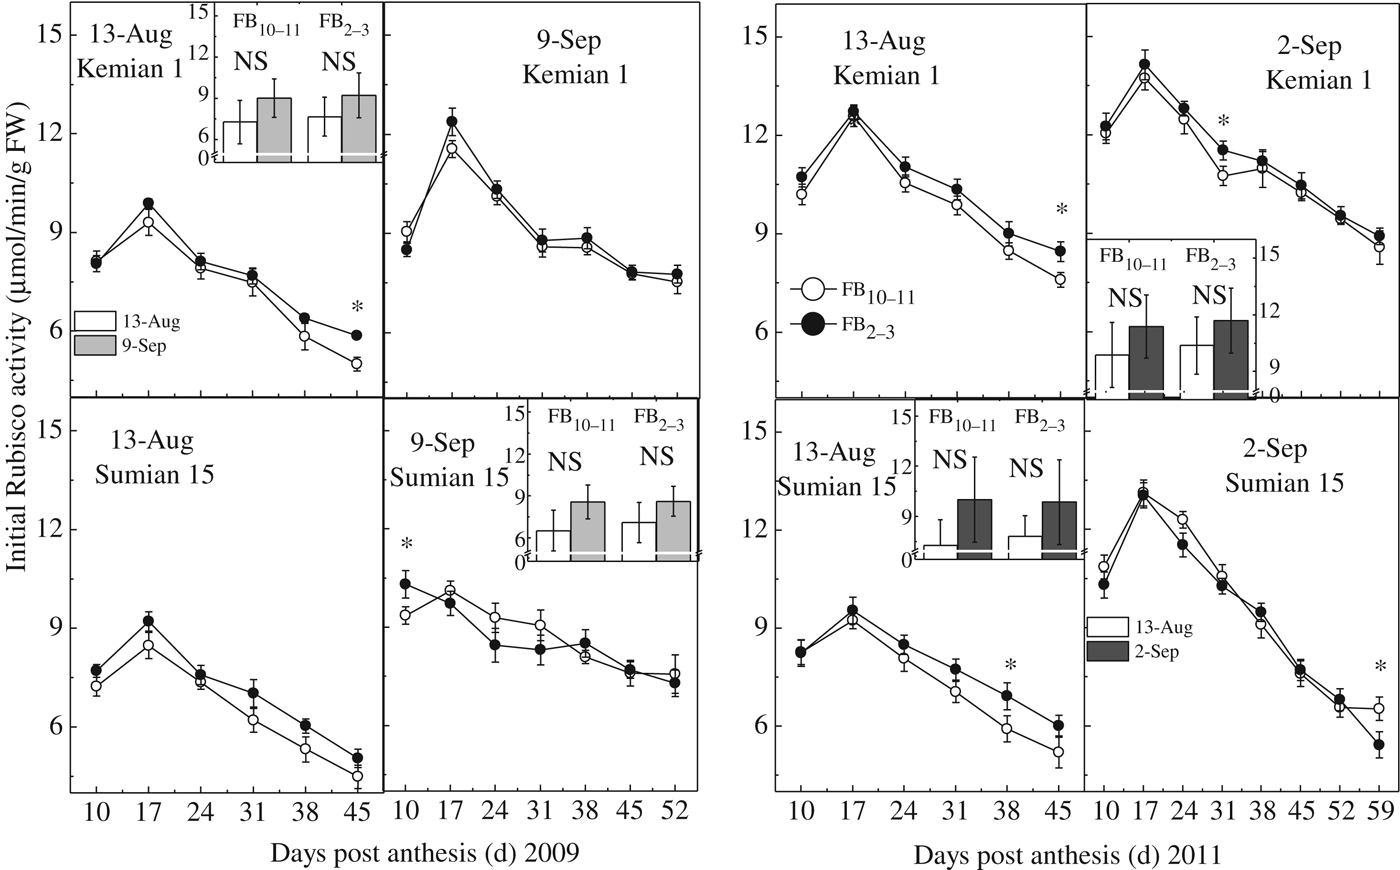
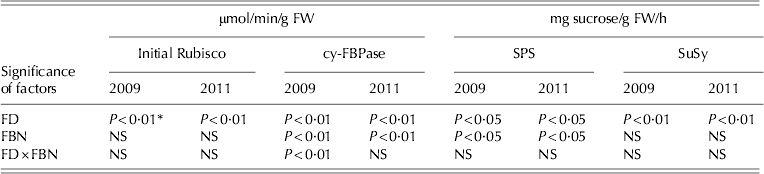
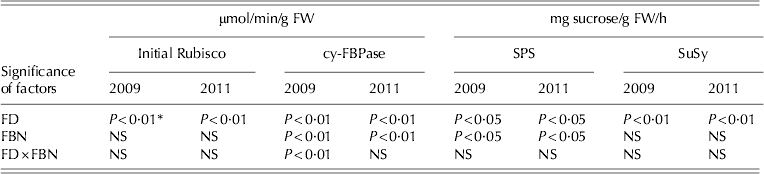
Initial Rubisco activity in the subtending leaf increased from 10 DPA and reached its highest level at 17 DPA, decreasing subsequently at different FBN (Fig. 3). Initial Rubisco activity in the subtending leaf of FB2–3 was slightly higher than that for FB10–11 from 10 to 59 DPA at FD 13 August and 9 September 2009/2 September 2011, whereas most of the time courses in initial Rubisco activity were not significant between FB10–11 and FB2–3 in the 2 years. Moreover, for both FB10–11 and FB2–3, non-significant differences in initial Rubisco activity was observed between the two FD (Fig. 3, inset), when all data for every FBN were averaged. In particular, compared to FB2–3, initial Rubisco activity in the subtending leaf of FB10–11 was down-regulated by 4·86–8·26% and −1·37 to 2·78% at FD 13 August and 9 September 2009/2 September 2011 in the 2 years, respectively. In general, initial Rubisco activity in the subtending leaf was affected significantly by FD (P<0·05, Table 5), whereas no significant differences in FBN or the interaction of FD and FBN on initial Rubisco activity were detected in the 2 years.
Effect of FD and FBN on initial Rubisco activity in the subtending leaf during boll development in 2009 and 2011. Data are the mean of three replicates ±s.e. Main part: dynamic changes of initial Rubisco activity in the subtending leaf at different FD and FBN. Inset: initial Rubisco activity averaged all data of each treatment. The stages labelled with an asterisk (*) indicate significant differences (P<0·05) between FB10–11 and FB2–3 in the main part and between FD in the inset by randomization test (NS, not significant).
Interactions of flowering dates (FD) and fruiting branch nodes (FBN) on initial Rubisco, cy-FBPase, SPS and SuSy activities in the subtending leaf during boll development in 2009 and 2011
FD and FBN, flowering dates and fruiting branch nodes; NS, not significant.
* n=12.
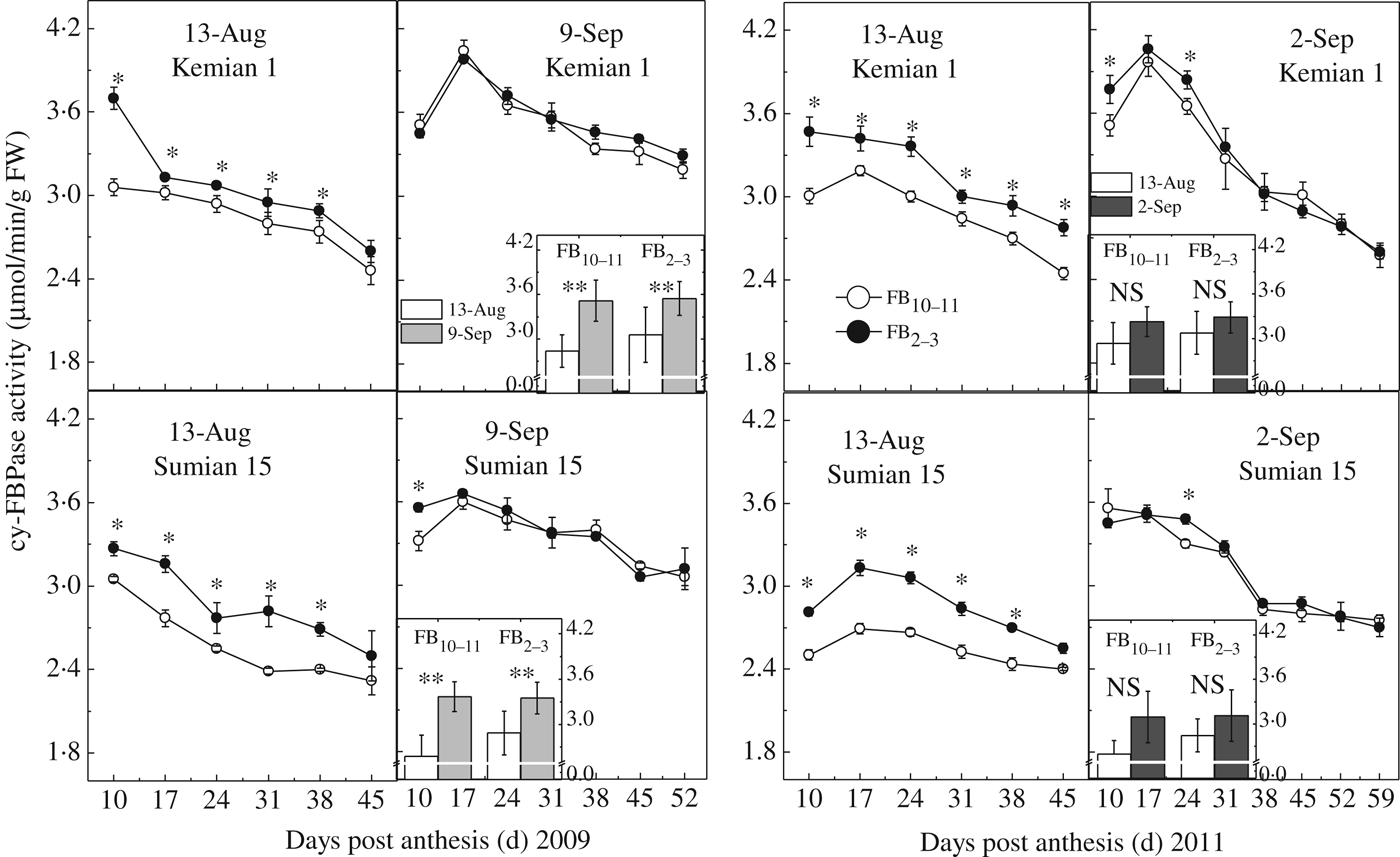
The cy-FBPase activity in the subtending leaf declined from 10 DPA at the 13 August FD, but for the delayed FD, the peak value occurred at 17 DPA (Fig. 4). The cy-FBPase activity in the subtending leaf of FB2–3 was significantly higher than that for FB10–11 from 10 DPA to 38 and 45 DPA in 2009 and 2011, respectively, at the 13 August FD, whereas most of the time courses of cy-FBPase activity were not significant at FD 9 September 2009 and 2 September 2011. In addition, cy-FBPase activity in the subtending leaf for both FB10–11 and FB2–3 increased significantly following the delayed FD in 2009 (P<0·05, Fig. 4, inset). Nevertheless, a non-significant difference in cy-FBPase was observed between the two FD in 2011, when all data for every FBN were averaged. This might be due to the large temperature difference between FD in 2009, ranging from 21·9 to 16·7 °C (Table 2). Moreover, compared to FB2–3, cy-FBPase activity in the subtending leaf of FB10–11 was down-regulated by 7·26–10·91% and 0·53–2·00% at FD 13 August and 9 September 2009/2 September 2011, respectively. In general, cy-FBPase activity in the subtending leaf was affected significantly by both FD and FBN (P<0·05, Table 5). However, a significant interaction between FD and FBN on cy-FBPase activity was detected only in 2009.
Effect of FD and FBN on cy-FBPase activity in the subtending leaf during boll development in 2009 and 2011. Data are the mean of three replicates ±s.e. Main part: dynamic changes of cy-FBPase activity in the subtending leaf at different FD and FBN. Inset: cy-FBPase activity averaged all data of each treatment. The stages labelled with an asterisk (*) indicate significant differences (P<0·05) between FB10–11 and FB2–3 in the main part and between FD in the inset by randomization test (NS, not significant).
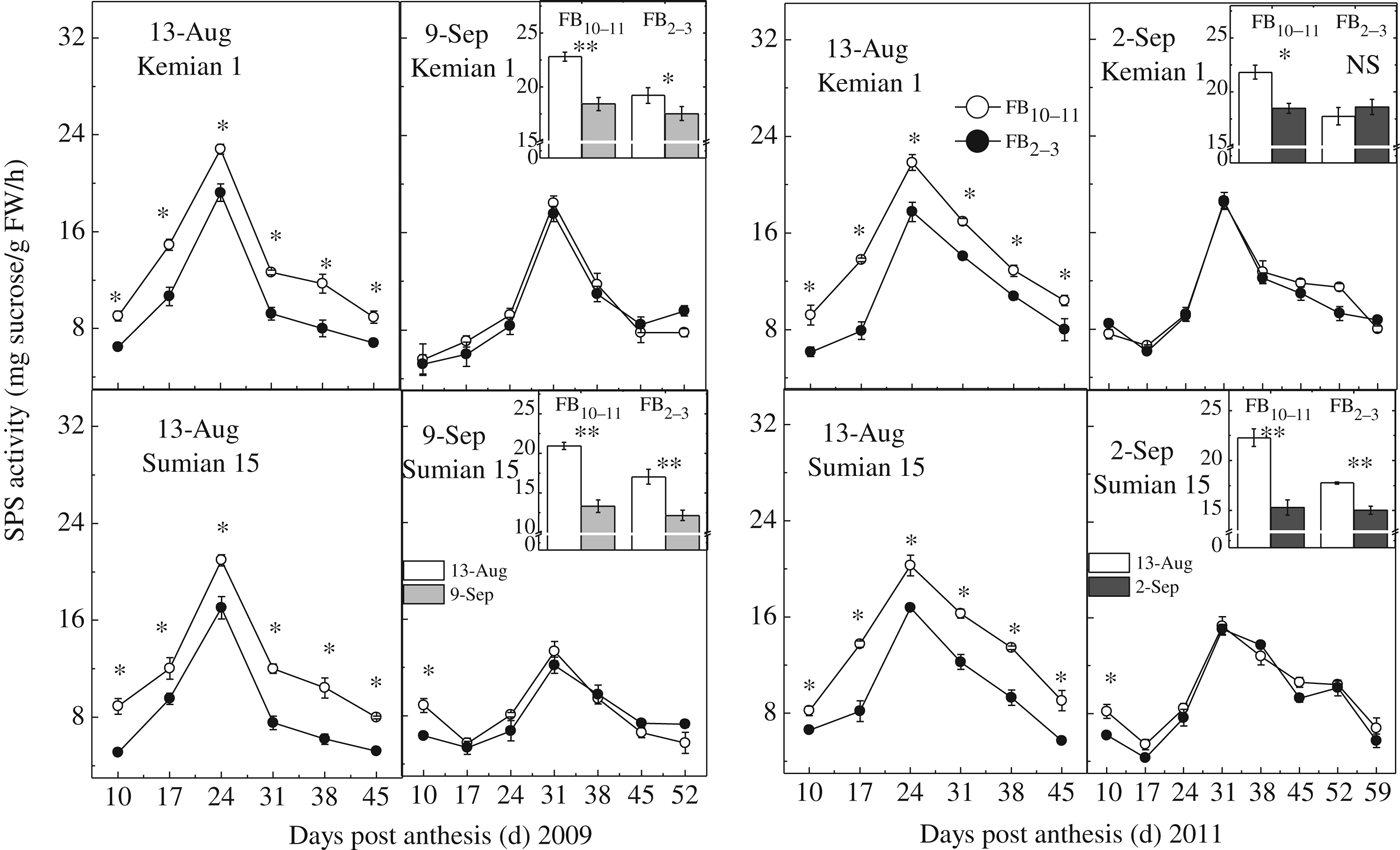
Sucrose-phosphate synthase facilitates carbon removal from chloroplasts and uses fructose and free UDP-glucose to synthesize sucrose-P, which then is dephosphorylated by sucrose-6-phosphate phosphatase to form sucrose. The patterns of SPS activity in the subtending leaf were similar at different FD and FBN, increasing from 10 DPA to a peak at 24–31 DPA in the 2 years, and then declining significantly until the bolls opened at the 13 August FD (Fig. 5). Delaying FD resulted in delayed peaking of SPS activity. Also, peak SPS activity was generally lower, and rate of decline slower at the late FD. At the 13 August FD, SPS activity in the subtending leaf of FB2–3 was significantly (P<0·05) lower than that of FB10–11 from 10 to 45 DPA. However, no significant difference in SPS activity was observed between FB10–11 and FB2–3 at the delayed FD. In addition, peak SPS activity in the subtending leaf decreased significantly following the delayed FD for FB10–11 in the 2 years (P<0·05, Fig. 5, inset). Nevertheless, for FB2–3, only Sumian 15 had a significant difference (P<0·05) between the two FD in 2011. When all data for every treatment were averaged, SPS activity in the subtending leaf at FB10–11 was up-regulated by 30·33–42·81% and −4·96 to 8·08% at the FD of 13 August and 9 September 2009/2 September 2011, respectively, compared to FB2–3. Moreover, SPS activity in the subtending leaf was affected significantly by both FD and FBN (P<0·05, Table 5). However, no significant interaction between FD and FBN on SPS activity was detected in the 2 years.
Effect of FD and FBN on SPS activity in the subtending leaf during boll development in 2009 and 2011. Data are the mean of three replicates ±s.e. Main part: dynamic changes of SPS activity in the subtending leaf at different FD and FBN. Inset: peak SPS activity at different FD and FBN. The stages labelled with an asterisk (*) indicate significant differences (P<0·05) between FB10–11 and FB2–3 in the main part and between FD in the inset by randomization test (NS, not significant).
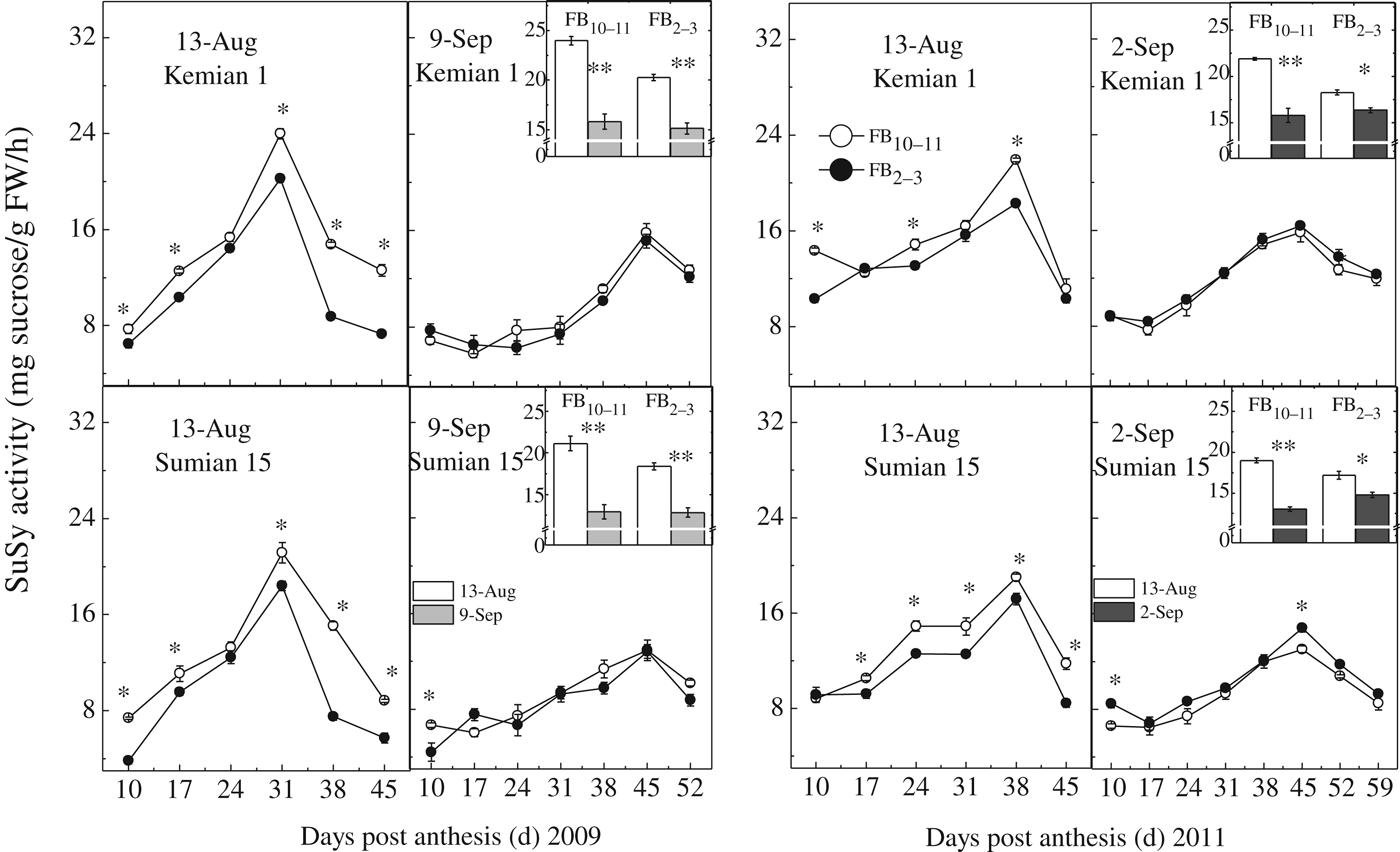
Sucrose synthase plays an important role in sucrose degradation in vivo. The changes of SuSy activity in the subtending leaf were similar to those of SPS activity in the 2 years (Fig. 6). For Kemian 1 and Sumian 15, SuSy peak activity in the subtending leaf of FB10–11 and FB2–3 decreased significantly following the delayed FD in the 2 years (P<0·05, Fig. 6, inset). It was observed that SuSy activity in the subtending leaf was only affected significantly by FD (P<0·05) (Table 5). When all data for every treatment were averaged, compared to FB2–3, SuSy activity in the subtending leaf at FB10–11 was up-regulated by 13·25–33·56% and −3·58 to 9·15% at the FD of 13 August and 9 September 2009/2 September 2011, respectively. Moreover, SuSy activity in the subtending leaf was only affected significantly by FD in the 2 years (P<0·05, Table 5).
Effect of FD and FBN on SuSy activity in the subtending leaf during boll development in 2009 and 2011. Data are the mean of three replicates ±s.e. Main part: dynamic changes of SuSy activity in the subtending leafat different FD and FBN. Inset: peak SuSy activity at different FD and FBN. The stages labelled with an asterisk (*) indicate significant differences (P<0·05) between FB10–11 and FB2–3 in the main part and between FD in the inset by randomization test (NS, not significant).
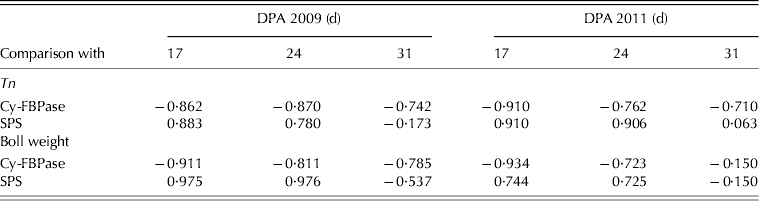
Correlation coefficients of subtending leaf cy-FBPase and SPS activities with transport capacity of sucrose and boll weight during boll development
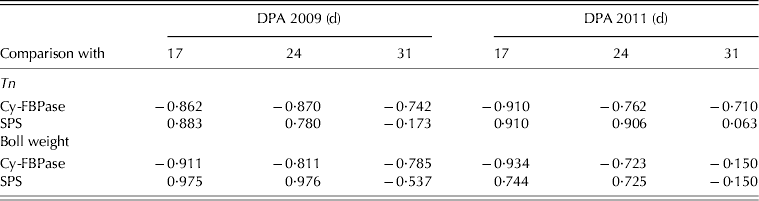
Among these sucrose-metabolizing enzymes, only cy-FBPase activity and SPS activity in the subtending leaf were affected significantly by FBN (P<0·05, Table 5). Moreover, to understand the relationships between key sucrose-metabolizing enzymes, transport capacity of sucrose (Tn) in the subtending leaf and boll weight, the correlations between them were clarified at 17, 24 and 31 DPA. At 17–24 DPA, cy-FBPase activity had significant negative correlations with Tn and boll weight (r=−0·762 to 0·910 for Tn and r=−0·723 to 0·934 for boll weight, both P<0·05), and SPS activity had significantly positive correlations with them in the 2 years (r=0·780–0·910 for Tn and r=0·725–0·976 for boll weight, both P<0·05) (Table 6).
Regression coefficients (R) between enzymatic activities (μmol/min/g FW for cy-FBPase and mg sucrose/g FW/h for SPS) and transport capacity of sucrose (Tn, mg sucrose/g DW/d), boll weight (g) in the subtending leaf at 17, 24 and 31 days post anthesis (DPA) in 2009 and 2011. (n=8, R 0·05=0·707, R 0·01=0·834)
DISCUSSION
In the current study, the growth and development conditions of cotton bolls and their subtending leaves were similar at the same FD from different planting dates, whereas the FBN were different, which indicated that their physiological ages were different. Therefore, the current study analysed different FBN at the same FD for different planting dates, which could more accurately reflect growth conditions of the boll and its subtending leaf.
Cotton boll biomass and fibre quality have been reported to be influenced by environmental conditions (Gormus & Yucel Reference Gormus and Yucel2002; Boquet & Clawson Reference Boquet and Clawson2009). About 0·60–0·87 of boll biomass is provided by the subtending leaf (Ashley Reference Ashley1972; Constable & Rawson Reference Constable and Rawson1980; Wullschleger & Oosterhuis Reference Wullschleger and Oosterhuis1990) and the principal carbohydrate translocated from leaves to bolls is sucrose, which is sensitive to abiotic stress (Lunn & Hatch Reference Lunn and Hatch1995). Therefore, factors which affect sucrose metabolism in the subtending leaf may also restrict boll formation. In the current study, sucrose metabolism in the subtending leaf and boll weight was affected by FBN. In addition, the Δ% (Δ%=(FB10–11−FB2–3)×100%/FB2–3) in sucrose metabolism differed at the FD of 13 August and 9 September 2009/2 September 2011.
The current study has shown that boll weight was significantly affected by FD for both Kemian 1 and Sumian 15. However, no significant difference in boll weight for Kemian 1 was detected between FB2–3 and FB10–11 or for the FD×FBN interaction. The position of the FBN was found to affect the process of boll formation in Kemian 1 and Sumian 15. At FB2–3, compared with FB10–11, the rapid increase in boll weight started earlier and V max was higher, whereas T was shorter. This might be due to low boll number per plant at FB2–3, thus resulting in a high ratio of source (the subtending leaf) to sink (boll) in cotton and a higher rate of carbon export to the boll during boll development. In addition, sucrose content and starch content in the subtending leaf of FB10–11 were higher than those of FB2–3 (P<0·05), indicating that more carbon in the subtending leaf was transported into the boll during the earlier period of boll development. As the numbers of fruiting branches and bolls increased rapidly and cotton growth transitioned from vegetative growth to reproductive growth, boll weight increased more rapidly and T was longer. Moreover, SPS activity and Tn in the subtending leaf were higher at FB10–11 than at FB2–3. Therefore, boll weight at FB10–11 was higher than that of FB2–3. For FB10–11 and FB2–3, changes in boll weight at the same FD have been documented (Zhao et al. Reference Zhao, Wang, Shu and Zhou2010), and the pattern of boll weight between FBN in the current study agrees with the findings of previous studies (Zhao et al. Reference Zhao, Wang, Shu and Zhou2010). In addition, the degree of change in boll weight between FB2–3 and FB10–11 (ΔBw%) was lower when FD was delayed. These results indicated that FBN was the secondary factor to affect sucrose metabolism in the subtending leaf at the delayed FD.
In most plants including cotton, sucrose and starch are the principal end products of photosynthesis (Lunn & Hatch Reference Lunn and Hatch1995). In the subtending leaf, the dominant source of photosynthate for the attached boll (Constable & Rawson Reference Constable and Rawson1980), the main storage carbohydrate is starch (Hendrix et al. Reference Hendrix, Mauney, Kimball, Lewin, Nagy and Hendrey1994; Gandin et al. Reference Gandin, Lapointe and Dizengremel2009). However, in most time courses, starch content in the subtending leaf was not correlated with boll weight, perhaps because starch acts as a buffer to sucrose metabolism (Stitt & Heldt Reference Stitt and Heldt1981). Starch is converted to sucrose and exported to the developing boll only when sucrose in the subtending leaf is depleted, i.e. where sucrose in the cells is in short supply (Hendrix & Grange Reference Hendrix and Grange1991).
In previous studies with spinach (Spinacia oercea), soybean (Glyvcie max L. Merr.), tobacco (Nicotana tabacum L.) and wheat (Triticum aestvum L.), it has been shown that cy-FBPase (Weeden & Buchanan Reference Weeden and Buchanan1983; Daie Reference Daie1993) and SPS (Huber et al. Reference Huber, Wilson and Burton1983; Rufty & Huber Reference Rufty and Huber1983) play the key regulatory roles in partitioning of carbon into sucrose. In the current study, it was confirmed that cy-FBPase activity and SPS activity in the subtending leaf were affected significantly by delayed FD, which resulted in lower temperatures (Guy et al. Reference Guy, Huber and Huber1992; Van Heerden et al. Reference Van Heerden, Viljoen, De Villiers and Krüger2004). Among the four enzymatic activities in sucrose metabolism, only cy-FBPase and SPS activities in the subtending leaf were affected significantly by FBN (P<0·05). At the 13 August FD, cy-FBPase activity in the subtending leaf of FB2–3 was higher than that at FB10–11, whereas the opposite was seen for SPS activity. With delayed FD, cy-FBPase and SPS activities in the subtending leaf between FB2–3 and FB10–11 were similar.
The current study showed that SPS activity had a significant positive correlation with Tn and boll weight in the subtending leaf at 17–24 DPA, the period of rapid increases in boll weight (Table 3) and cellulose (Wang et al. Reference Wang, Shu, Chen, McGiffen, Zhang, Xu and Zhou2009). Meanwhile, large amounts of sucrose for fibre were needed for boll formation and cellulose synthesis, most of which were transported from the subtending leaf. The low amount of sucrose retained in the subtending leaf, and the higher SPS activity was probably to ensure adequate sucrose in the leaf was exported to the boll (Kelly Reference Kelly, Kelly and Latzko2006). Overexpression of FBPase in transgenic plants leads to increased carbohydrate accumulation (Miyagawa et al. Reference Miyagawa, Tamoi and Shigeoka2001) which means that metabolic adjustments partly compensate for the decreased SPS expression (Neuhaus et al. Reference Neuhaus, Quick, Siegl and Stitt1990). In the current study, it was observed that cy-FBPase activity had significant negative correlations with Tn in the subtending leaf and boll weight. These results indicated that Tn in the subtending leaf was affected significantly by sucrose-metabolizing enzymes, and a higher Tn in the subtending leaf was favourable for carbon export and boll weight increase. Moreover, SPS probably exerts more of a limitation to the maximal rate of sucrose synthesis than leaf cy-FBPase (Stitt Reference Stitt1989). Overexpression of SPS in cotton delays leaf senescence (Baxter et al. Reference Baxter, Foyer, Turner, Rolfe and Quick2003) and enhances sucrose synthesis (Haigler et al. Reference Haigler, Singh, Zhang, Hwang, Wu, Cai, Hozain, Kang, Kiedaisch, Strauss, Hequet, Wyatt, Jividen and Holaday2007) under controlled environmental conditions. Therefore, SPS in the subtending leaf is the key enzyme at different FD and FBN during boll development.
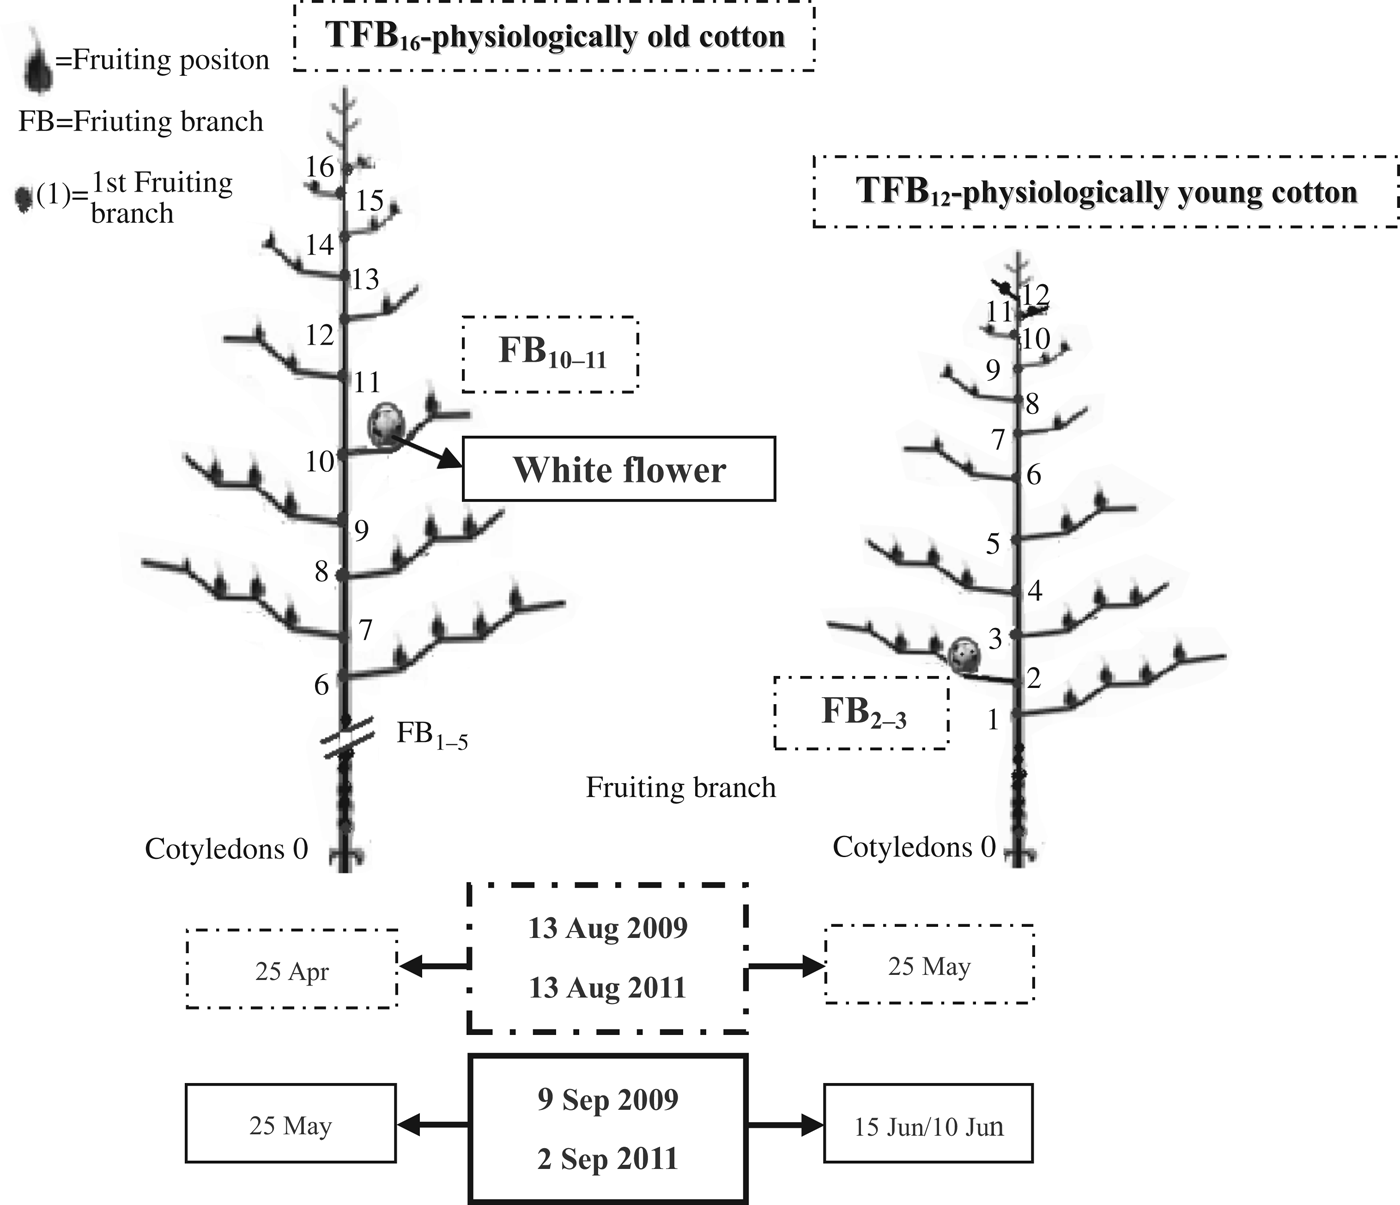
Plant physiological age, as proposed by botanists, is used to describe the growth process of plants, expressed in days post-germination or numbers of unfolded leaves (Hartmans & Van Loon Reference Hartmans and Van Loon1987). Physiological age can represent metabolic activities of plants closely related to crop yield and quality formation (Hartmans & Van Loon Reference Hartmans and Van Loon1987; Johansen & Nilsen Reference Johansen and Nilsen2004). The content of soluble protein and chlorophyll have been found to be lower in the leaf of a 6-week-old plant than in an 8-week-old plant, although the two groups of leaves were in the same stage of senescence (Zentgraf et al. Reference Zentgraf, Jobst, Kolb and Rentsch2004). Also, the growth of squares and bolls are affected by physiological time, which incorporates the effect of temperature (Liakatas et al. Reference Liakatas, Roussopoulos and Whittington1998). This indicates that leaf physiological metabolism and boll development are affected by the physiological age. In addition, leaf age has also been used to characterize leaf physiological age (Peng & Krieg Reference Peng and Krieg1991). In the current study, leaf physiological ages at different FBN were essentially the same (c. 23 d after emerging) as the FD was delayed. However, sucrose metabolism in the subtending leaf and boll weight was affected by FBN. It was found that the numbers of total fruiting branches in the treatments were 12 for FB2–3, but 16 for FB10–11 at all FD. Therefore, FBN were used to characterize cotton physiological age in the current study. Cotton plants at FB2–3 were characterized as physiologically young cotton (TFB12) and those at FB10–11 as physiologically old cotton (TFB16) (Fig. 7).
Schematic diagram of cotton physiological age in 2009 and 2011. TFB, Total fruiting branches.
CONCLUSIONS
Cy-FBPase and SPS activities, sucrose content in sucrose metabolism of the subtending leaf to cotton boll and boll weight were affected significantly by FBN, and following a delay in FD, the degree of influence between FB10–11 and FB2–3 was lower. The SPS activity in the subtending leaf was correlated significantly with Tn and boll weight at 17–24 DPA.
Therefore, delayed FD, resulting in lower temperatures during boll development, was the main factor affecting sucrose metabolism in the subtending leaf. To be precise, the effects of FBN on boll weight and sucrose metabolism in the subtending leaf were higher at the optimal FD (13 August) than those at the later FD (9 September 2009 and 2 September 2011) and FBN were used to characterize cotton physiological age in the current study. A crucial period for boll development is 17–24 DPA, which might be affected significantly by physiological and ecological factors of the subtending leaf. In addition, higher SPS activity was favourable for sucrose export and boll weight increase at different FD and FBN during boll development.
This research was supported by the National Natural Science Foundation of China (grant no. 30971735), China Agriculture Research System (grant no. CARS-18-20) and the Special Fund for Agro-scientific Research in the Public Interest (Impact of climate change on agriculture production of China, grant no. 200903003). We would like to thank Professor Derrick M. Oosterhuis for his help with the corrections of English grammar in the revised manuscript.