Introduction
Precision agriculture is a revolutionary technology for crop production around the world. Today, producers can measure spatial yields, obtain aerial images of crop biomass, gather information such as soil water content and spatial N levels, and use this information to manage their crops precisely at a small spatial scale. However, producers have difficulty in interpreting the vast amount of data available and turning that data into production decisions.
Nitrogen (N) is critical for crop production, but over-application of N can reduce profits and cause environmental degradation. In 2014, nearly 2 million tonnes of N was used for agricultural production in Germany, while 12.5 million tonnes were used in the US (FAOSTAT 2014). Over-application of N is common in these countries and around the world and there is a great need to reduce NO3–N amounts left in the soil after harvest to prevent leaching into the ground water. Optimizing N timing and spatial application rate to better match crop needs can lead to a reduction in N losses to the environment.
Crop growth models have been used in the past to estimate long term optimum spatial N rates for maize. Paz et al. (Reference Paz, Batchelor, Colvin, Logsdon, Kaspar, Karlen and Babcock1999) developed a technique to calibrate spatial soil properties for the CERES-Maize v3.7 model for individual grids within a field to minimize the error between simulated and measured yields over multiple years. In this approach, they divided fields into smaller grids and collect spatial yield data over several seasons for each grid. They developed crop model input files and weather files for each year and grid. Then they coupled the CERES-Maize (Jones et al., Reference Jones, Hoogenboom, Porter, Boote, Batchelor, Hunt, Wilkens, Singh, Gijsman and Ritchie2003) model to an optimizer that used the simulated annealing algorithm to estimate optimum soil parameters for each grid that minimized the error between simulated and measured yield over multiple seasons for each grid. Estimated soil parameters are listed in the model development section. Using this technique, they were able to explain over 80% of spatial yield variability in maize and soybean fields in Iowa based on variable soil properties. This technique was integrated into a software system called Apollo ( A pplication of P recisi O n Agricu L ture for Fie L d Management O ptimization) which was developed in Visual Basic for implementation on a personal computer (Batchelor et al., Reference Batchelor, Paz and Thorp2004). The Apollo software was extended to evaluate optimum N rates and plant population for each grid. The software was designed to use calibrated soil properties for each grid to simulate different combinations of N application timing and rate, and plant populations over many seasons of historical weather data in order to determine the N rate and population that maximized the long term marginal net return for assumed values of N and seed cost and yield price (Batchelor et al., Reference Batchelor, Paz and Thorp2004). The software was written in Visual Basic for Windows XP and is no longer operational on recent Microsoft Windows platforms due to substantial changes made to Visual Basic to integrate it with the Microsoft .NET platform supported in recent releases of Windows.
Other researchers have implemented these techniques for soybean (Paz et al., 2001), wheat (Link et al. Reference Link, Graeff and Batchelor2008) and maize (Miao et al., Reference Miao, Mulla, Batchelor, Paz and Robert2006), but required extensive training from the Apollo model developers. Using process oriented crop growth models to evaluate spatial yields and prescriptions at small spatial scales is complex because the crop models require numerous inputs and specialized software such as Apollo must be developed to assist with model calibration and prescription development (Batchelor et al., Reference Batchelor, Basso and Paz2002). Thus, these techniques have not been widely adopted, and a comprehensive software package does not exist to use crop growth models for precision agriculture decisions (Link et al., Reference Link, Graeff, Batchelor and Claupein2006).
Thorp et al. (Reference Thorp and Bronson2013) recently developed open source model optimization software called GeoSim, which is distributed as a plug-in to the open source QGIS geographic information software. The purpose of GeoSim is to allow users to calibrate parameters for any environmental or crop model using an optimizer based on the simulated annealing optimization technique. This software offers a modern open source replacement to the calibration procedures developed in the outdated Apollo software. Using QGIS and GeoSim, users can develop a map of a field, divide the field into management units, set up crop modelling inputs files for each grid, and calibrate soil properties to minimize error between simulated and measured spatial yields over multiple seasons of weather and yields. GeoSim was written in Python, which is an open source language and is available as a plug-in for QGIS and can be downloaded at http://www.qgis.org/. While GeoSim provides an excellent platform for model calibration, it does not contain software to develop and evaluate N management prescriptions.
The purpose of this work was to 1) develop a prototype open source software package to evaluate economic consequence of N management prescriptions for maize and 2) test the software for two maize datasets in Germany and the US. The long term goal is to distribute this software as an additional plug-in to the QGIS software to be used in conjunction with GeoSim. This pair of add-ins to QGIS would provide users with the tools needed to calibrate crop models to simulate historical spatial yield variability and to develop optimum N management prescriptions using long-term historical or future climate change weather records.
Model Development
In this project, we developed the GeoSim Nitrogen Prescription Model (GeoSim NPM) as a stand-alone Python program to simulate optimum N prescriptions for maize. The program uses optimum soil parameters calibrated using GeoSim (Thorp et al., Reference Thorp and Bronson2013) to run different combinations of N rates and application dates using a user specified number of historical (or future) years of weather data. The program generates yield and N levels in the soil at harvest for each grid and weather year. The economic optimizer component of GeoSim NPM allows the user to enter the selling price for maize, the cost of N, and the cost of leaving N in the field to account for policies such as the current German compensation payment, which incentivises producers to limit N left in the field. It then computes the marginal net return (MNR) for each N rate each year of the simulation. The seasonal MNR’s are then used to compute the N prescription that maximizes the long-term MNR over the user selected seasons of weather data.
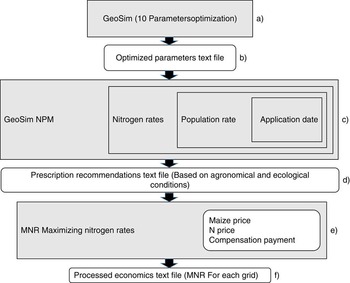
Figure 1 shows a block diagram of the system. Grey boxes represent computational parts of the GeoSim and GeoSim NPM, while white boxes represent passed or computed (simulated) parameters or additional information necessary to compute final result. The modified version of CERES-Maize (v 3.7) used in Apollo allows the optimization of up to 10 soil parameters for each grid in the field, including SCS curve number, drainage rate, effective tile drainage rate, saturated hydraulic conductivity of deep impermeable layer, hard pan factor, depth of hard pan, root distribution reduction factor, N mineralization factor, soil fertility factor and adjustment of soil water availability. Combinations of these 10 parameters are optimized by GeoSim (Figure 1a) and passed to the GeoSim NPM using a text file (Figure 1b).
Flow diagram of the optimization and simulation process in GeoSim NPM.

In GeoSim NPM (Figure 1c), the user specifies the weather seasons to be simulated, as well as the date of N application and range and increments within the range of N levels to simulate yield and N left in the field at the end of each season in order to compute the optimum N rate for each grid or management zone over long term seasons of weather. The CERES-Maize model is then run for all combinations of N dates and rates and seasons of weather data for each grid using the parameters calibrated for each grid by GeoSim and stores this information in a database for future analysis.
The GeoSim NPM software also requires the user to specify economic data including N price and value of yield in order to simulate Marginal Net Return (MNR) for different combinations of N dates and rates. Marginal net return is computed by
 $$\eqalignno{ MNR\,& {\equals}\,Yield\,{\asterisk}\,Price\,{\minus}\,NRate\,{\asterisk}\,NCost \cr & \ \ {\plus}Compensation\ Payment$$
where, MNR is the marginal net return ($ ha−1), Yield is simulated crop yield (kg ha−1), Price is crop price ($ kg−1), NRate is N the application rate (kg N ha−1), NCost is nitrogen cost ($ kg−1), and Compensation Payment is the value or penalty for leaving N in the field at harvest ($ kg N−1 ha−1). Once the database is computed for all combinations of N rates and seasons of weather, GoeSim NPM searches the database to determine the N rate that maximizes the average MNR computed over all seasons.
Model Evaluation
Case study 1 – McGarvey field
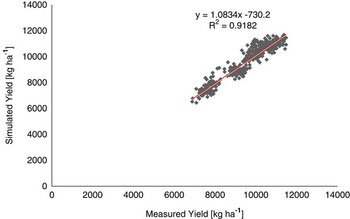
The 40-ha McGarvey field is located in Perry, Iowa. Spatial maize yield data were collected each year from 1994-2002. The field was divided into 100 grids 0.4 ha in size. Maize was planted in even years and soybean was planted in odd numbered years. Weather data were measured at a local weather station. GeoSim was used to calibrate three soil parameters including optimum effective tile drain spacing, saturated hydraulic conductivity of the lower impermeable layer, and the percent available soil water in each soil layer to minimize the error between simulated and observed yield in each of 100 grids over five seasons. The results of the simulated and observed yields for the 100 grids and five years are shown in Figure 2. The R2 between simulated and observed yield over all grids and years was 0.92, which is consistent with results reported by Thorp et al. (Reference Thorp, Batchelor, Paz, Steward and Caragea2006) who used Apollo to conduct a similar calibration for this dataset. Thus, these soil properties explained 92% of spatial yield variability over the 100 grids and 5 seasons.
Relationship between simulated and measured maize yield [kg ha−1] for the three soil parameters for the McGarvey field, Perry, Iowa (n=459).

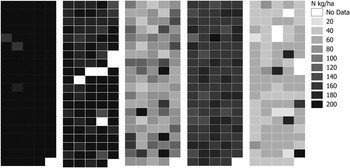
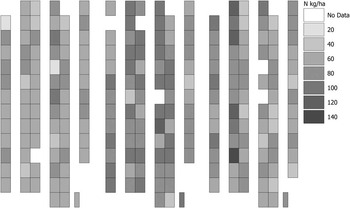
GeoSim NPM was then used to compute the MNR for different combinations of N rate for these five seasons (1994, 1996, 1998, 2000 and 2002). The price of maize and N fertilizer was assumed to be 0.13 $ kg−1 and 0.5 $ kg−1, respectively. The N compensation payment was set to 0 $ kg−1 ha−1 since there is no compensation payment for N management in the US. Figure 3 shows the spatial N rate that maximized the MNR over five seasons. The farmer applied 207 kg N ha−1 just before planting in 1994 and 1996 and 180 kg N ha−1 in 1998, 2000 and 2002. Over the five growing seasons, GeoSim NPM simulated an optimum value of applied N that averaged 42% lower than the uniform rates actually applied in the field.
Map of simulated N application rates that maximized MNR in each growing season (1994, 1996, 1998, 2000 and 2002) using GeoSim NPM.

Thus, using this approach, the farmer could have reduced N application rate by an average of 42%, leading to no loss in MNR. The model based MNR was higher in all growing seasons except in the year 1996. Based on GeoSim NPM simulations, maize yield could have been increased by 2% over 5 seasons by using this approach to site-specific N-fertilization. This would result in a 6% increase of MNR averaged over 5 years compared to the producer’s current practices.
Case study 2 – Riech field
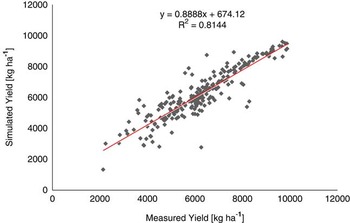
The Reich field is 10 ha in size and located in Ihinger Hof, Agricultural Research Station, University of Hohenheim, Germany. Maize was planted in 2006, 2007 and 2008 following normal farmer management practices. Weather data were measured at a local weather station. The field was divided into 80 grids for this analysis. Yield was measured each season using a yield monitor. Soil information was available for crop model input file development. Model inputs were developed for each grid and year. Four parameters including the hard pan depth, hard pan factor, root distribution factor, and percent available soil water were optimized using the GeoSim software to minimize the error between simulated and observed yield in each grid over the three seasons. The results are shown in Figure 4. The R2 between simulated and measured yields across all grids and seasons was 0.81. Thus, the model explained 81% of the spatial yield variability in the field across all grids and seasons.
Relationship between simulated and measured maize yield [kg ha−1] calibrated using four soil parameters for the Riech field, Ihinger Hof Germany (n=231).

GeoSim NPM was then used to compute the MNR for different combinations of N rate for these three seasons (2006, 2007, and 2008). The price of maize and N fertilizer was assumed to be 0.13 $ kg−1 and 0.5 $ kg−1, respectively. The N compensation payment was set to 0 $ kg−1 ha−1 for this analysis.
Figure 5 shows the simulated optimum N rate that maximized the MNR for these three seasons of weather for this field. The producer practice was to apply 120 kg N ha−1. Based on the model analysis shown in Figure 5, the model gave a 39% lower N rate that maximized MNR over these seasons compared to the current producer practice.
Map of N application rates that maximized MNR in each growing season (2006, 2007 and 2008) for the Riech field (Ihinger Hof, Germany) simulated using GeoSim NPM.

Conclusions
In this project, we developed an open source software package that can be used in conjunction with the GeoSim open source software and QGIS to allow users to calibrate the CERES-Maize model to simulate historical spatial yield variability and evaluate the economic consequences of variable rate N prescriptions. While GeoSim NPM is currently operated as a stand-alone program, future work will focus on making this an open source plug-in for QGIS, which can be installed with the GeoSim plug-in. Results of model calibration for fields in Germany and the US explained 81% and 92% of historical spatial yield variability. The GeoSim NPM was used to compute the optimum N rate that maximized marginal net return, and indicated that N rates could be reduced in both fields compared with current producer practices.