I. INTRODUCTION
Utilization of solar energy and semiconductor photocatalysis techniques are promising in solving the energy crisis and environmental pollution. Reference Hoffmann, Martin, Choi and Bahnemannt1,Reference Chen, Shen, Guo and Mao2 Since Honda and Fujishima reported the breakthrough of photocatalytic hydrogenation evolution by TiO2 under ultraviolet (UV) light, Reference Fujishima and Honda3 thousands of papers have witnessed the development of TiO2 in the fields of photovoltaic, solar cell, CO2 reduction, photocatalytic hydrogen or oxygen production, etc., Reference Hoffmann, Martin, Choi and Bahnemannt1,Reference Chen, Shen, Guo and Mao2,Reference Chen and Selloni4–Reference Chen and Burda6 as well as photocatalytic degradation of the environmental contaminants, due to its environmental friendliness, low cost, and its utilization of solar energy. Reference Chen and Mao5–Reference Liu, Yan, Chen, Tian, Xia and Chen7 It is known that photocatalytic reactions occurring on the surface of catalysts and TiO2 crystals with different types of exposed facets usually exhibit different physical and chemical properties. Theoretical calculations testified that the order of the average surface energy of anatase TiO2 is 0.90 J/m2 for {001} > 0.53 J/m2 for {100} > 0.44 J/m2 for {101}. Reference Lazzeri, Vittadini and Selloni8 A natural anatase crystal typically exhibits (101), (100)/(010), and minority (001) surfaces, ascribed to the thermodynamic instability of (001) facets with the highest surface energy. Reference Wang, Sun, Tan, Feng, Cheng, Zhao, Zhao, Wang, Luo, Yang and Hou9 Recently, a selective increase in the fraction of {001} facets in TiO2 crystals has been extensively reported, Reference Lazzeri, Vittadini and Selloni8–Reference Kuang, Wang, Jiang, Xie and Zheng11 due to the fact that {001} facets with high surface energy have more undersaturated coordination Ti5c sites and higher reactivity than other low-energy facets. However, a high-energy surface can be fabricated either through the thermodynamic reduction of the surface energy via selective adsorption of capping agents on specific crystal faces or through control of the growth kinetics. Reference Kwon and Hyeon12,Reference Xia, Xiong, Lim and Skrabalak13 A fluorine-rich surface is therefore usually essential for obtaining a high percentage of {001} facets during TiO2 crystal growth. Reference Yang, Sun, Qiao, Zou, Liu, Smith, Cheng and Lu10,Reference Han, Kuang, Jin, Xie and Zheng14,Reference Liu, Yang, Wang, Cheng, Pan, Lu and Cheng15 These Ti–F bonds on the (001) surface were controversial to the photocatalytic activity of TiO2. For example, some researches claimed that the surface Ti–F bond can change surface five-coordinated Ti atoms in exposed (001) and (101) facets to six-coordinated ones, which will have greatly lowered surface reactivity, and the removal of surface fluorine species resulted in a substantially enhanced capacity for generating ·OH radicals for both the nanosized and micron-sized anatase TiO2. Reference Selloni16,Reference Liu, Sun, Yang, Smith, Wang, (Max) Lu and Cheng17 Han et al. also found that the photocatalytic degradation efficiency of methyl orange in aqueous solution is remarkably enhanced by the removal of surface fluorine ions on TiO2. Reference Han, Kuang, Jin, Xie and Zheng18 However, surface fluorination of TiO2 was also reported to greatly accelerate the hydroxyl radical-mediated photocatalytic degradation reaction. Mrowetz and Selli reported direct experimental evidence on more hydroxyl radicals generated on fluorinated titanium dioxide obtained by spin-trapping electron paramagnetic resonance (EPR) measurements and the faster photoinduced bleaching of the azo dye Acid Red 1 in the presence of F–TiO2. Reference Mrowetz and Selli19 Yu and co-workers also found that surface fluorination can significantly enhance the photocatalytic activity of TiO2 nanosheets because the strong electron-withdrawing ability of the surface ≡Ti–F groups reduces the recombination of photogenerated electrons and holes and enhances the formation of free ·OH radicals. Reference Xiang, Lv and Yu20 Therefore, it is still vital to investigate the property of {001} facets exposed TiO2. In addition, TiO2 has a large band gap of about 3.2 eV and only absorbs the UV light in the solar spectra. The above two obstacles limited the practical application of {001} facets dominating TiO2 under sunlight. So far, many approaches have been taken to extend the absorption of {001} facets dominating TiO2 to visible light, including metal or/and nonmetal element doping, Reference Zhang, Wang, Liu, Han, Yao, Zou, Cheng and Zhao21,Reference Zhang, Xi and Ji22 noble metal loading, Reference Zhu, Liang, Gu, Xie, Wang, Ding and Liu23,Reference Xing, Yang, Yu, Tian, Bagwasi, Zhang and Gong24 forming composites with other carbon-based materials, Reference Gu, Wang, Zou and Han25,Reference Ong, Tan, Chai, Yong and Mohamed26 etc. However, the photocatalytic activity is still unsatisfactory.
Hydrogenation treatment is an innovative method to realize the color of TiO2 changing from white to black, indicating that the absorption of hydrogenated TiO2 can cover the entire visible light region. Reference Chen, Liu, Yu and Mao27 It sparked world-wide researchers’ interests on its synthesis, chemical and physical properties, and application of hydrogenated TiO2. At present, the vast majority of studies have confirmed that hydrogenated TiO2 showed remarkable photocatalytic performance, likely ascribed to the presence of oxygen vacancies, Ti3+ species, and hydroxyl groups induced by hydrogen thermal treatment. Reference Chen, Liu, Yu and Mao27–Reference Wang, Wang, Ling, Tang, Yang, Fitzmorris, Wang, Zhang and Li30 For example, Zheng et al. found that hydrogenated brown anatase nanowire microspheres showed a highly enhanced photocatalytic activity in the photodecomposition of 2, 4-dichlorophenol in the visible-light region. Reference Zheng, Huang, Lu, Wang, Qin, Zhang, Dai and Whangbo31 For the fluorine-rich {001} facets exposed TiO2, Wang et al. found that the surface Ti–F bond was reduced to a Ti–H bond along with the presence of Ti3+ in H2 with high pressure and the hydrogenated TiO2 with exposed {001} facets showed an enhanced photocatalytic activity. Reference Wang, Ni, Lu and Xu32 Li et al. modified the TiO2 nanosheets with {001} facets by a low-temperature plasma method and found that oxygen vacancies and Ti3+ were obtained. Reference Li, Zhao, Zhou, Meng, Meng and Qiu33 Moreover, Chen et al. found that hydrogenation can introduce disorders and defects in the crystal structure to induce electronic states in the band gap, long-wavelength optical absorption, and effective charge separation. The hydrogenated black TiO2 nanoparticles had much higher photocatalytic activities in decomposing organic pollutants [methylene blue (MB) and phenol] and generating H2 from water/methanol solutions, due to the valence band, maximum energy blue-shifts, and the narrow band gap (∼1.0 eV). Reference Gu, Wang, Zou and Han25
Palladium species, including PdO and Pd nanoparticles, have been reported to promote the separation of charge carriers to enhance the catalytic activity of photocatalysts. For instance, Shang’s group coupled the PdO with N-doping TiO2 to accelerate the photocatalytic disinfection of Escherichia coli. Reference Li, Li, Wu, Xie and Shang34 Tomita et al. Reference Tomita, Otsubo, Higashi, Ohtani and Abe35 found that palladium oxide loading, WO3, selectively oxidizes the alcohol 2-propanol to the corresponding aldehydes or ketones (e.g., 80% selectivity for acetone production with approximately 96% conversion of 2-propanol) in water containing molecular O2, due to the high selectivity of the PdO x cocatalyst for the two-electron reduction of O2 molecules. Moreover, the Pd cocatalyst was confirmed to have a promotional effect on the catalytic activity of TiO2 because of its good ability of transport or store electrons. Reference Su, Dimitratos, Liu, Carter, Althahban, Wang, Shen, Wendt, Wen, (Hans) Niemantsverdriet, Iversen, Kiely and Hutchings36 However, no research on the deposing palladium species on {001} facet dominant TiO2 and their photocatalytic activity has been reported.
Herein, we focused on the effect of hydrogenation on the surface properties of TiO2 nanosheets with a high proportion of {001} facets by investigating the removal of surface F atoms bonding with Ti and the type of palladium species on TiO2 nanosheets with exposed {001} facets before and after hydrogenation. The effect of palladium species and hydrogenation on the photocatalytic activity of different composites was also studied. It is found that the hydrogenation removed the surface fluorine atoms and promoted the deposition of PdO and Pd nanoparticles on the {001} facet exposed TiO2. The synergy of palladium species and their hydrogenation significantly enhanced the degradation of rhodamine B (RhB) and MB of TiO2 nanosheets with exposed {001} facets.
II. EXPERIMENTAL SECTION
A. Synthesis of photocatalysts
1. Hydrogenated TiO2 nanosheets
{001} facets dominant TiO2 nanosheets (TiO2 NS) were prepared by a hydrothermal method with titanium butoxide and concentrated hydrofluoric acid solution, followed by a calcination at 500 °C for 6 h in air. Reference Zhang, Xia, Shang, Wallenmeyer, Katelyn, Peterson, Murowchick, Dong and Chen37 Typically, titanium butoxide [Ti(OC4H9)4, 5 mL] and hydrofluoric acid solution (0.6 mL, 48 wt%) were mixed in a Teflon-lined 20 mL autoclave and then kept at 200 °C for 24 h. After hydrothermal reaction, the precipitates were collected, washed with deionized water and ethanol several times, and dried at 100 °C overnight. Hydrogenated TiO2 nanosheets were achieved by heating powders at 500 °C for 6 h under a hydrogen atmosphere, which were denoted as H–TiO2.
2. Palladium species loaded catalysts
Palladium species were deposited onto both the pristine TiO2 NS and the H–TiO2. Typically, 50 mg of the TiO2 NS or H–TiO2 were dispersed into 30 mL distilled H2O under sonication for 15 min to obtain a uniform solution. Then, 1.128 mL of H2PdCl4 was added to the above solution with strongly stirring for 10 min. The solution was heated in a boiling water bath for 2 h. The resulting powders obtained by centrifugation, washing with ethanol and water for several times, and dried overnight at 60 °C were marked as Pd–TiO2 and Pd–H–TiO2, respectively.
B. Characterization
The X-ray diffraction (XRD) was performed on a Rigaku Miniflex XRD instrument (Rigaku Corporation, Tokyo, Japan) with Cu Kα as the X-ray source (wavelength = 1.5418 Å). The Raman spectra were collected on an EZRaman-N benchtop Raman spectrometer (TSI Incorporated, Shoreview, Minnesota) with the excitation wavelength of 785 nm. The transmission electron microscopy (TEM) study was performed on a FEI Tecnai F200 TEM (FEI, Hillsboro, Oregon). The electron accelerating voltage was at 200 kV. A small amount of sample was dispersed in water, dropped onto a thin holey carbon film, and dried overnight before TEM measurement. The Fourier transform infrared (FTIR) spectra were collected using a Thermo-Nicolet iS10 FT-IR spectrometer (Thermo Scientific, Shanghai, China) with an attenuated total reflectance (ATR) unit. TiO2 nanoparticles were pressed onto the ZnSe crystal of the ATR unit, and the measurements were performed in air at room temperature. UV–Vis diffusive reflectance spectra (UV–Vis DRS) were obtained for the dry-pressed disk samples on a UV–Vis spectrophotometer (JASCO, Easton, Maryland) with MgSO4 as the reference. X-Ray photoelectron spectroscopy (XPS) measurements were carried out using a VG Multilab 2000 spectrometer (Thermo Fischer Scientific, Shanghai, China) with an Al Kα X-ray source, and all the spectra were calibrated to the C 1s peak at 284.6 eV. Photocurrents were measured on an electrochemical analyzer (CHI 660C; CH Instruments, Inc., Shanghai, China) in a standard two-electrode system with the as-prepared samples as the working electrodes and a Pt plate as the counter electrode. A 300 W xenon lamp (CEL-HXF300, AuLight, Beijing, China) was used as the light source and the electrolyte was 0.5 mol/L Na2SO4 aqueous solution.
C. Photocatalytic tests
Two dyes, RhB and MB, were chosen to evaluate the photocatalytic activity of Pd–TiO2 and Pd–H–TiO2 under simulated sunlight. In a typical run, 1 mg of powders was dispersed to 3 mL RhB or MB solution (abs = 1.0). Prior to light irradiation, the suspension was sonicated for 30 min and stirred for an hour in the dark to ensure the establishment of the adsorption/desorption equilibrium on the catalysts surface. Then the solution was placed in a quartz reaction and stirred with a magnetic stirrer. A high-pressure xenon lamp (CEL-HXF300 Beijing Cel Sci-tech Co., Ltd., Beijing, China) was used as the light source. At given time intervals, the absorbance of the centrifuged solution was determined with a UV–Vis spectrophotometer (JASCO, Easton, Maryland).
III. RESULTS AND DISCUSSION
A. Crystalline structure and surface composition
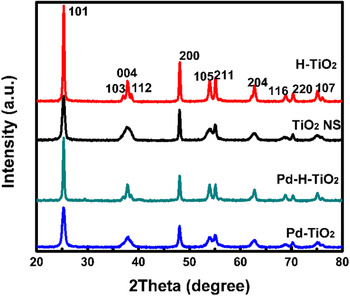
The XRD patterns of all samples are shown in Fig. 1. The strong diffractive peaks at 2θ of 25.3°, 37.8°, 48.0°, 53.9°, 55.1°, and 62.7° corresponded to the (101), (004), (200), (105), (211), and (204) crystalline planes of tetragonal anatase TiO2 (JCPDF no. 21-1272), respectively, indicating the good crystallinity of all TiO2 materials. Reference Jenkins and Snyder38,Reference Xia, Li, Zhang, Kruger, Murowchick, Selloni and Chen39 After hydrogenation treatment, the intensity of all peaks increased, but the ratio of I (004)/I (101) of H–TiO2 and Pd–H–TiO2 decreased compared with that of TiO2 NS and Pd–TiO2, manifesting that hydrogenation promoted the crystallinity of TiO2 and the growth of {101} facets. No characteristic peaks of Pd metal and/or PdO were observed in Pd–H–TiO2 and Pd–TiO2, likely due to the small amount of Pd or PdO loading on catalysts.
XRD patterns of all samples.

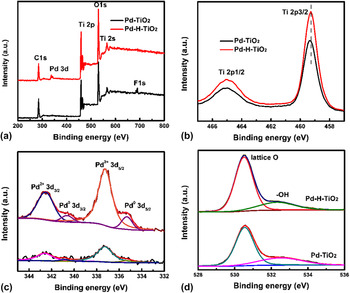
The XPS spectra were recorded to investigate the surface element composition and valence. Three elements, Ti, O, and F, were obviously observed for Pd–TiO2 but with a negligible palladium signal in Fig. 2(a). However, for Pd–H–TiO2, the peak of F disappeared and an apparent peak of palladium element was displayed. This indicated that hydrogenation removed the surface bonding F with Ti atoms and promoted the deposition of palladium species on H–sTiO2. The peaks at 459.4 and 465.1 eV contributed to the Ti 2p 3/2 and Ti 2p 1/2 of Ti4+ ions for Pd–TiO2 and that of Pd–H–TiO2 down-shifted 0.1 eV–459.3 and 465.0 eV, respectively, which further confirmed the removal of surface fluorine atoms in Fig. 2(b). No signals of Ti3+ were observed [Fig. 2(b)] because of the absence of low binding energy of titanium element. Two weak peaks at 342.5 and 337.3 eV were ascribed to the Pd 3d 3/2 and Pd 3d 5/2 of PdO in Fig. 2(c). Reference Brun, Berthet and Bertolini40 The stronger bands of PdO and the peaks of Pd0 at 340.6 and 335.3 eV were present in the Pd–H–TiO2 spectrum. Reference Brun, Berthet and Bertolini40 This result indicated that PdO preferred to deposit on the {001} facets dominant TiO2 surface, and after hydrogenation, the clean (001) surface without F atoms was more in favor of the deposition of PdO nanoparticles; moreover, the hydrogenation on TiO2 induced the loading of Pd metal. This was likely due to the fact that hydrogenation produced an amorphous structure and decreased the percent of {001} facets with rich oxidative sites and increased the percent of {101} with reductive sites to some extent (XRD results). Reference Fujiwara, Müller and Pratsinis41 The peaks at 530.5 and 532.3 eV corresponded to the lattice oxygen of TiO2 nanosheets and surface hydroxyl groups in Fig. 2(d).The peak intensity of lattice oxygen increased for Pd–H–TiO2 compared to that of Pd–TiO2, likely due to the removal of surface fluorine atoms.
The comparison of XPS spectra of Pd–TiO2 and Pd–H–TiO2, the whole spetra (a), Ti 2p (b), Pd 3d, (c) and O 1s (d).

B. FT-IR, Raman and UV–Vis DRS spectra
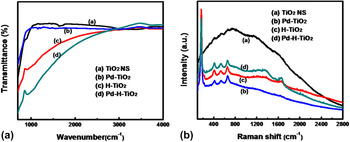
The board absorption band at 600–800 cm−1 in the FT-IR spectra of all samples is characteristic vibration of Ti–O bond. A weak peak at 1630 cm−1 and the band at 3000–3400 cm−1 came from the absorbed H2O molecule and the stretching vibration of associated hydroxyl groups for TiO2 NS in Fig. 3(a). PdO nanoparticles loading weaken the absorption of H2O or hydroxyl groups. After the hydrogenation of TiO2 NS, it showed the enhanced Ti–O variation, but a weakened absorption at around 3300 cm-1 from O–H stretching vibrations was observed.
The Fourier transform infrared spectra (a) and Raman spectra (b) of all samples.

Raman spectroscopy is widely used to characterize surface structures, spatial uniformity, phase transformation, defects, etc. of materials. Reference Gouadec and Colomban42 The active-Raman modes of all samples were detected and compared in Fig. 3(b). Pristine TiO2 NS showed a strong luminescent background due to the unsaturated Ti5c and abundant oxygen vacancies in {001} facet dominant TiO2 NS. Reference Yang, Sun, Qiao, Zou, Liu, Smith, Cheng and Lu10 After palladium species loading, the intensity of the luminescent background dramatically decreased. That meant palladium oxide likely attached on some defects sites, such as oxygen vacancy. The characteristic peaks appeared at 157 cm−1 (e.g.,), 410 cm−1 (B1g), 531 cm−1 (A1g), and 660 cm−1 (E1g) were ascribed to the stretching and bending modes of the O–Ti–O bond, Reference Tian, Zhang, Zhang and Pan43 respectively. H–TiO2 and Pd–H–TiO2 showed similar Raman modes to Pd–TiO2, whereas an increasing luminescent background indicated that hydrogenation produced a surface amorphous structure or defects on the H–TiO2 and Pd–H–TiO2, which is identical to previous reports. Reference Gu, Wang, Zou and Han25
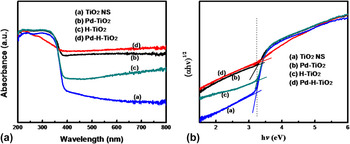
The UV–Vis diffractive reflection spectra of all catalysts were shown in Fig. 4(a). The pristine TiO2 displays a strong absorption in the UV region and the band edge absorption is about 380 nm. Hydrogenation is an effective approach to enhance the absorption of titanium dioxide nanosheets in visible light. Hydrogenated TiO2 showed an enhanced absorption in visible light from 400 to 800 nm. It is noteworthy that the Pd–H–TiO2 displayed the strongest absorption in Fig. 4(a), ascribed to the absorption of PdO or/and plasmonic-induced absorption of Pd nanoparticles. Reference Chang, Fu, Hu, Wang, Shan and Zhu44 As seen from Fig. 4(b), the band gap of pristine TiO2 nanosheets was 3.23 eV, which was identical to the previous report. Reference Chen, Shen, Guo and Mao2–Reference Liu, Yan, Chen, Tian, Xia and Chen7 It was 3.25, 3.24, and 3.24 eV for Pd–TiO2, H–TiO2, and Pd–H–TiO2, respectively, that is, surface palladium species loading and hydrogenation did not change the band gap of {001} facet dominant TiO2 nanosheets.
UV–Vis diffusive reflectance spectra (a) and plots of (αhν)1/2 versus hν (b).

C. Morphologies and structure
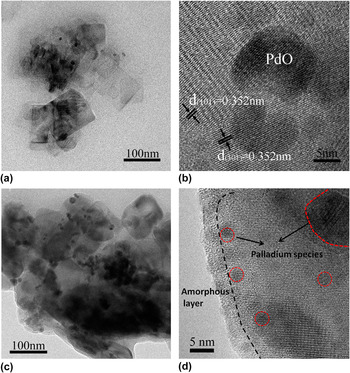
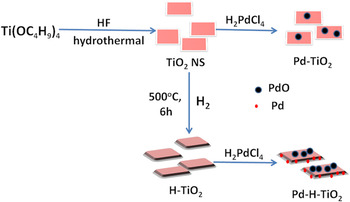
Figure 5 displays the TEM graphs of Pd–TiO2 and Pd–H–TiO2. It can be seen from Fig. 5(a) that the thin cubic TiO2 nanosheets with sharp edges and corners were obtained by hydrothermal methods. The width of nanosheets varied from 60 to 100 nm and the length was about 150 nm. Only a small amount of palladium species, likely being PdO according to XPS results, were dispersed on TiO2 nanosheets. The clear lattice fringes in Fig. 5(b) indicated a high crystallinity of TiO2 nanosheets and the size of PdO nanoparticles is about 10–14 nm. The lattice spacing of around 0.352 nm corresponded to the (101) plane of anatase TiO2, confirming {001} facets exposed TiO2 nanosheets. After the hydrogenation, the edge and corner of H–TiO2 nanosheets become unsharp and more palladium species were observed on hydrogenated TiO2 nanosheets in Fig. 5(c), indicating the removal of surface bonding of fluorine atoms on (001) surface and hydrogenation were beneficial to the deposition of palladium species, which was identical to the XPS analysis. Figure 5(d) displayed hydrogenation created an amorphous layer out of TiO2 nanosheets and both PdO and Pd nanoparticles with the size of 2–3 nm were observed. Accordingly, a formation process of Pd–H–TiO2 was presented in Scheme 1.
TEM and HRTEM graphs of Pd–TiO2 (a, b) and Pd–H–TiO2 (c, d).

The graphic formation process of Pd–H–TiO2.

D. Photocatalytic activity and mechanism
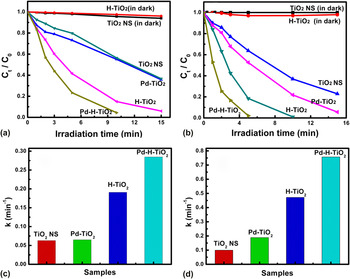
The photocatalytic activity of all catalysts was evaluated by the degradation of MB and RhB under simulated sunlight and shown in Figs. 6(a) and 6(b). RhB and MB cannot be degraded on both TiO2 NS and H–TiO2 without light irradiation. Apparently, PdO loading only slightly enhanced the activity of TiO2 NS on degrading both MB and RhB. However, hydrogenation significantly increased the photocatalytic activity of {001} facets dominant TiO2 nanosheets without surface F atoms. The MB and RhB completely decomposed in 15 and 10 min on H–TiO2 under simulated sunlight. More importantly, the palladium species (PdO and Pd) loading further improved the performance of H–TiO2. At our experiment, MB and RhB were quickly degraded completely in around 10 and 5 min on Pd–H–TiO2, respectively. The first-order rate constant (k) was 0.2848 min−1 (MB) and 0.7573 min−1 (RhB) on Pd–H–TiO2 and 4.5 and 4.0 times as that on Pd–TiO2 in Figs. 6(c) and 6(d), 0.0650 min−1 (MB), and 0.1883 min−1 (RhB), respectively. The order of the first rate constant of both degrading MB and RhB on all catalysts was Pd–H–TiO2 > H–TiO2 > Pd–TiO2 > TiO2. Apparently, the synergistic effect of hydrogenation and palladium species loading dramatically improved the photocatalytic activity of Pd–H–TiO2.
The comparison of photocatalytic degradation and the first-order rate constant of MB (a, c) and RhB (b, d) on all catalysts under simulated sunlight.

It is known that, in photocatalytic reaction, photogenerated electrons and holes are first generated after the catalyst absorbs light, and they separate and migrate to the surface to perform photocatalytic reactions. Reference Chen, Shen, Guo and Mao2–Reference Liu, Yan, Chen, Tian, Xia and Chen7 The overall photocatalytic activity is mainly related to light absorbing, exposed active surface, the separation efficiency of charge carriers, etc. According to above UV–Vis DRS, XRD, and TEM results, Pd–H–TiO2 showed the strongest absorption in range of 200–800 nm; moreover, hydrogenation helps to remove the surface boding F atoms on (001) surface and provides more active sites than the other catalysts. That contributed to the high photocatalytic activity of Pd–H–TiO2. In addition, to figure out how the palladium species and hydrogenation affected the separation of electrons and holes on Pd–H–TiO2, the transient photocurrent of all catalysts is shown in Figs. 7(a) and S1 in Supplementary Material. The pristine {001} facets dominant TiO2 nanosheets (TiO2 NS) had a slight photocurrent response (Fig. S1). Pd–TiO2 showed an increased photocurrent of TiO2, indicating that palladium oxide loading promoted the separation of charge carriers but it was lower than that of H–TiO2 [Fig. 7(a)]. That manifested that the hydrogenation was more efficient on the separation of electron–hole pairs than PdO loading of {001} dominant TiO2 NS. There, H–TiO2 showed better photocatalytic activity than Pd–TiO2 (Fig. 6). However, it is interesting that Pd–H–TiO2 showed an opposite photocurrent compared to H–TiO2 and Pt–TiO2, likely ascribed to the plasmonic-induced electrons from Pd nanoparticles injecting into the conduction band of H–TiO2. Accordingly, a mechanism scheme was proposed in Fig. 7(b) to help understand the transfer of charge carries and the degradation of pollution of Pd–H–TiO2. In photocatalytic degradation of organic pollution, two main active radicals, hydroxyl radicals (·OH) and superoxide radicals (·O2 −), are responsible for the decomposition of organic contaminants. These ·OH and ·O2 − radicals are from the reactions of electrons on conduction reducing O2 and holes the in valence band oxidizing H2O, respectively. For Pd–H–TiO2, the clean surface without fluorine atoms enhanced the adsorption of pollution molecules on the catalyst. Under simulated sunlight, both PdO on the (001) surface and hydrogenated amorphous structure promoted the separation of electron–hole pairs on Pd–H–TiO2. Furthermore, plasmonic-induced electrons from Pd nanoparticles were transferred to the conduction band of TiO2. These electrons likely reacted with O2 to produce ·O2 − radicals and holes in the valence band that oxidized the H2O to ·O2 − radicals. The reactive radicals resulted in the fast degradation of MB and RhB. Thus, the synergy of palladium species (PdO and Pd) and hydrogenation contributed to the enhanced catalytic activity of Pd–H–TiO2.
The transient photocurrent of Pd–TiO2 and Pd–H–TiO2 (a), and the proposed photocatalytic mechanism of Pd–H–TiO2 (b).

IV. CONCLUSIONS
Palladium species loading hydrogenated {001} facets dominant TiO2 nanosheets have been synthesized successfully. It is found that surface bonding F atoms limited the deposition of palladium species and only small amounts of PdO on {001} facets were exposed to TiO2 nanosheets. However, after hydrogenation removed the surface F atoms, the clean (001) surface was in favor of the deposition of PdO and the amorphous structure on H–TiO2 induced the loading of Pd nanoparticles. The synergy of palladium species and hydrogenation not only enhanced the absorption of Pd–H–TiO2 in the visible light region and promoted the separation of electron–hole pairs, but also induced the plasmonic electrons transferring from Pd nanoparticles to the conduction band of TiO2 nanosheets. That led to a high photocatalytic activity of Pd–H–TiO2. The k of degrading MB and RhB on Pd–H–TiO2 was 4.5 and 4.0 times as that on Pd–TiO2, respectively.
Supplementary Material
To view supplementary material for this article, please visit https://doi.org/10.1557/jmr.2017.232.
ACKNOWLEDGMENTS
L. Tian gratefully acknowledges the support from National Natural Science Foundation of China (No. 51302072) and Natural Science Fund for Creative Research Groups of Hubei Province of China (No. 2014CFA015).